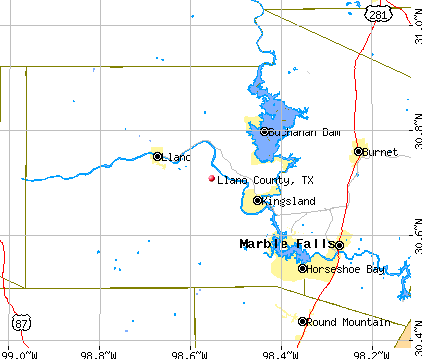
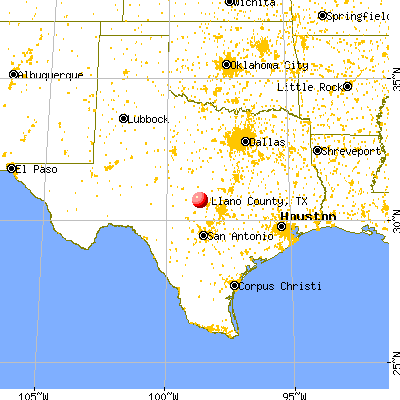
Llano County, Texas (TX)
County owner-occupied free and clear houses and condos in 2010: 3,805
County owner-occupied houses and condos in 2000: 6,372
Renter-occupied apartments: 1,941 (it was 1,507 in 2000)
| % of renters here: | 19% |
| State: | 36% |
Land area: 935 sq. mi.
Water area: 31.4 sq. mi.
Population density: 24 people per square mile (low).
Industries providing employment: Educational, health and social services (17.3%), Retail trade (14.5%), Professional, scientific, management, administrative, and waste management services (14.3%), Construction (12.1%).
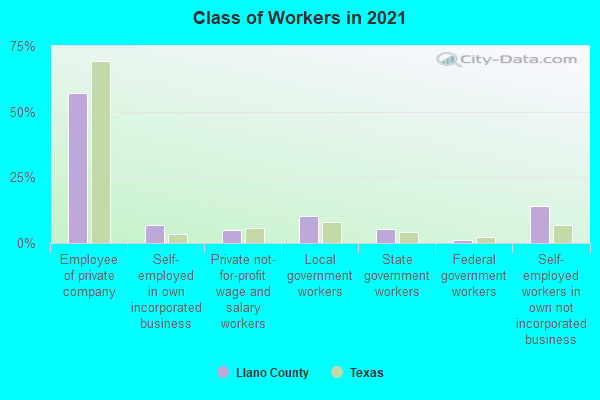
Type of workers:
- Private wage or salary: 72%
- Government: 14%
- Self-employed, not incorporated: 14%
- Unpaid family work: 0%
- OSM Map
- General Map
- Google Map
- MSN Map

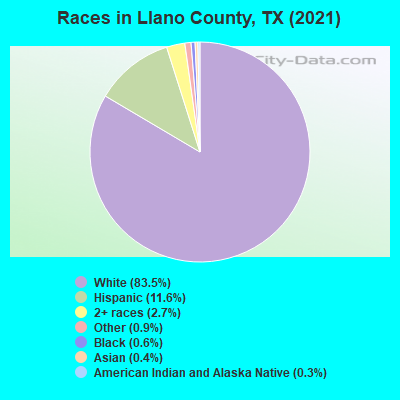
- 18,17283.3%White Non-Hispanic Alone
- 2,60912.0%Hispanic or Latino
- 5742.6%Two or more races
- 1400.6%Some other race alone
- 1350.6%Black Non-Hispanic Alone
- 1090.5%Asian alone
- 810.4%American Indian and Alaska Native alone
| Median resident age: | 58.1 years |
| Texas median age: | 35.6 years |
| Males: 10,611 | |
| Females: 11,607 |

 | Tropical Storm Marco (72 replies) |
| Llano TX No-flood zones? (2 replies) |
| If you could live ANYWHERE in Texas, where would it be? (57 replies) |
| New County Population Estimates from the Census Bureau for Jluy 1, 2016 posted this morning about 9 A. M. (13 replies) |
| Welcome to Austin Info Thread... (102 replies) |
| Texas Trivia (1626 replies) |
| Llano County: | 2.0 people |
| Texas: | 3 people |
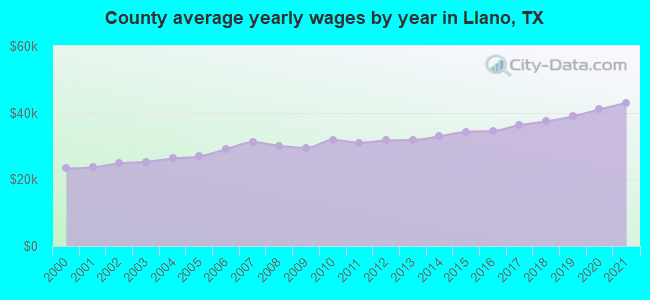
Estimated median household income in 2022: $63,580 ($34,830 in 1999)
| This county: | $63,580 |
| Texas: | $72,284 |
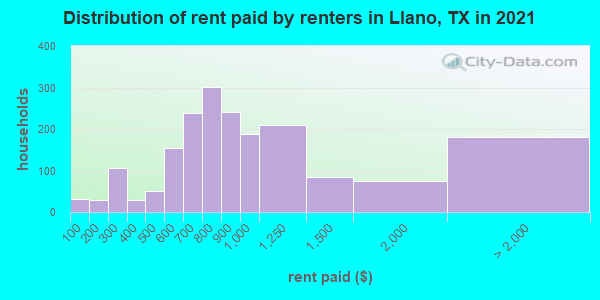
Median contract rent in 2022 for apartments: $859 (lower quartile is $642, upper quartile is $1,022)
| This county: | $859 |
| State: | $1117 |
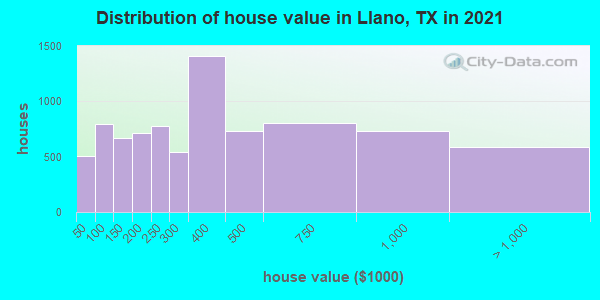
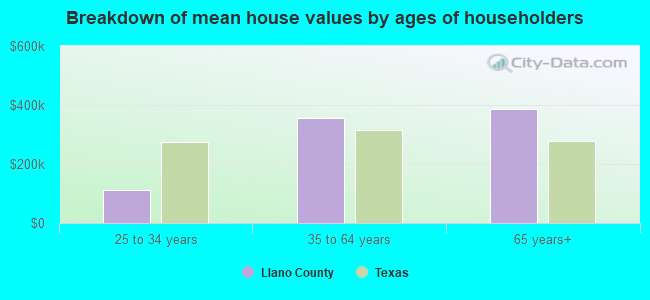
Estimated median house or condo value in 2022: $332,100 (it was $89,200 in 2000)
| Llano: | $332,100 |
| Texas: | $275,400 |
Mean price in 2022:
Median monthly housing costs for homes and condos with a mortgage: $1,471Detached houses: $547,980
Here: $547,980 State: $369,058 Townhouses or other attached units: $251,579
Here: $251,579 State: $327,631 In 2-unit structures: $384,322
Here: $384,322 State: $374,947 In 5-or-more-unit structures: $170,282
Here: $170,282 State: $413,944 Mobile homes: $128,085
Here: $128,085 State: $124,413 Occupied boats, RVs, vans, etc.: $44,544
Here: $44,544 State: $73,921
Median monthly housing costs for units without a mortgage: $661
Institutionalized population: 178
Crime in 2021 (reported by the sheriff's office or county police, not the county total):
- Murders: 0
- Rapes: 5
- Robberies: 1
- Assaults: 17
- Burglaries: 55
- Thefts: 115
- Auto thefts: 23
Crime in 2020 (reported by the sheriff's office or county police, not the county total):
- Murders: 0
- Rapes: 4
- Robberies: 0
- Assaults: 20
- Burglaries: 42
- Thefts: 148
- Auto thefts: 24
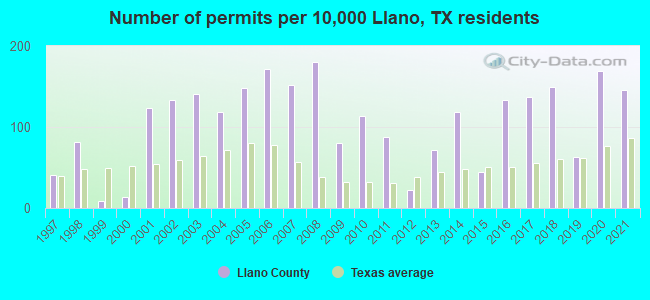
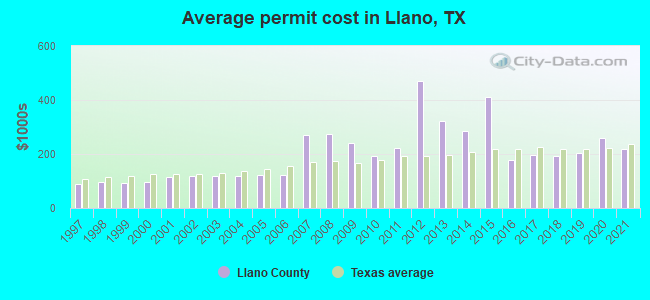
Single-family new house construction building permits:
- 2022: 272 buildings, average cost: $261,200
- 2021: 248 buildings, average cost: $217,500
- 2020: 288 buildings, average cost: $261,100
- 2019: 107 buildings, average cost: $204,900
- 2018: 254 buildings, average cost: $192,400
- 2017: 234 buildings, average cost: $196,600
- 2016: 226 buildings, average cost: $175,700
- 2015: 76 buildings, average cost: $411,000
- 2014: 202 buildings, average cost: $287,300
- 2013: 121 buildings, average cost: $320,700
- 2012: 37 buildings, average cost: $471,800
- 2011: 150 buildings, average cost: $223,200
- 2010: 195 buildings, average cost: $194,200
- 2009: 136 buildings, average cost: $238,500
- 2008: 307 buildings, average cost: $274,600
- 2007: 259 buildings, average cost: $269,700
- 2006: 294 buildings, average cost: $123,800
- 2005: 252 buildings, average cost: $120,700
- 2004: 201 buildings, average cost: $117,300
- 2003: 240 buildings, average cost: $117,400
- 2002: 227 buildings, average cost: $118,900
- 2001: 210 buildings, average cost: $114,300
- 2000: 24 buildings, average cost: $94,500
- 1999: 16 buildings, average cost: $94,100
- 1998: 139 buildings, average cost: $95,500
- 1997: 70 buildings, average cost: $87,900
Median real estate property taxes paid for housing units with mortgages in 2022: $2,691 (0.9%)
Median real estate property taxes paid for housing units with no mortgage in 2022: $2,626 (0.8%)

| Llano County: | 11.3% |
| Texas: | 14.0% |
Median age of residents in 2022: 58.1 years old
(Males: 57.5 years old, Females: 58.7 years old)
(Median age for: White residents: 61.5 years old, Black residents: 36.6 years old, American Indian residents: 29.8 years old, Asian residents: 38.9 years old, Hispanic or Latino residents: 33.1 years old, Other race residents: 34.3 years old)
Fair market rent in 2006 for a 1-bedroom apartment in Llano County is $502 a month.
Fair market rent for a 2-bedroom apartment is $661 a month.
Fair market rent for a 3-bedroom apartment is $791 a month.
Cities in this county include: Kingsland, Horseshoe Bay, Llano, Buchanan Dam, Sunrise Beach Village, Buchanan Lake Village, Cedar Point.
Neighboring counties: Escambia County, Florida  , Greene County, Mississippi , Livingston Parish, Louisiana , Leon County, Florida , Pointe Coupee Parish, Louisiana , Nassau County, Florida , Marion County, Mississippi .
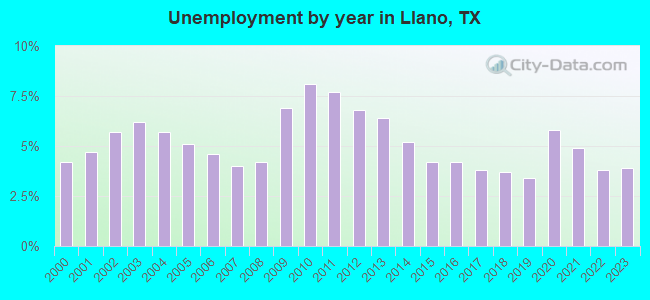
| Here: | 3.2% |
| Texas: | 3.5% |

Current college students: 182
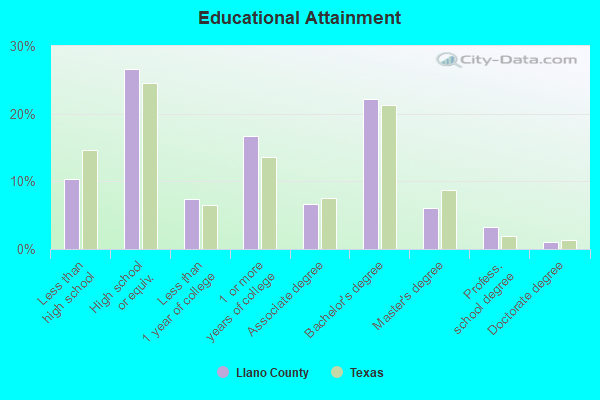
People 25 years of age or older with a high school degree or higher: 91.5%
People 25 years of age or older with a bachelor's degree or higher: 31.8%
Number of foreign born residents: 904 (42.5% naturalized citizens)
| Llano County: | 4.1% |
| Whole state: | 17.2% |
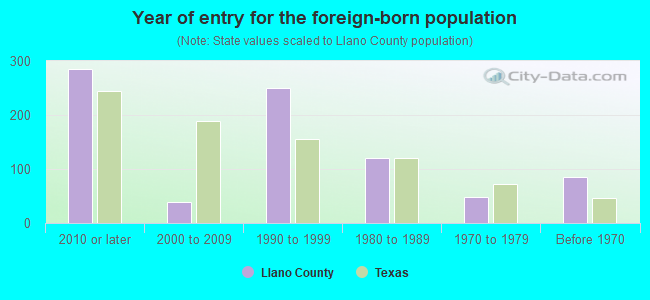
- Year of entry for the foreign-born population
- 3922010 or later
- 712000 to 2009
- 1741990 to 1999
- 1211980 to 1989
- 481970 to 1979
- 85Before 1970
Mean travel time to work (commute): minutes
Percentage of county residents living and working in this county: 99.4%
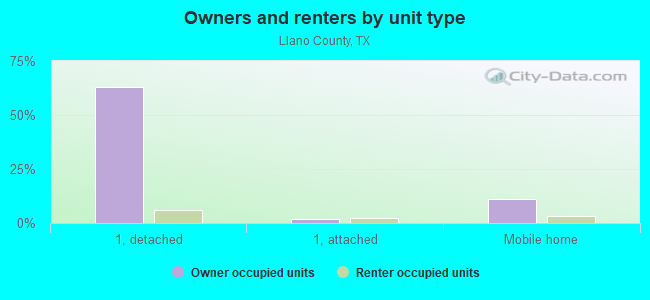
Housing units in structures:
- One, detached: 11,669
- One, attached: 556
- Two: 344
- 3 or 4: 515
- 5 to 9: 475
- 10 to 19: 215
- 20 to 49: 97
- 50 or more: 244
- Mobile homes: 1,752
- Boats, RVs, vans, etc.: 57
Housing units in Llano County with a mortgage: 3,605 (100 second mortgage, 0 home equity loan, 105 both second mortgage and home equity loan)
Houses without a mortgage: 183
| Here: | 1.6% with mortgage |
| State: | 98.4% with mortgage |
Religion statistics for Llano County
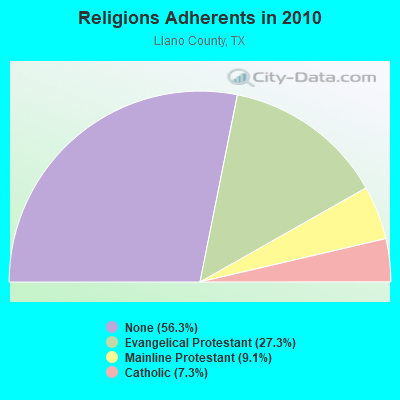
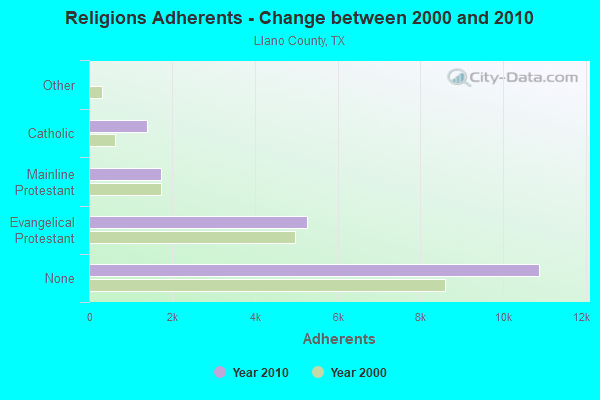
| Religion | Adherents | Congregations |
|---|---|---|
| Evangelical Protestant | 5,270 | 26 |
| Mainline Protestant | 1,748 | 11 |
| Catholic | 1,408 | 2 |
| Other | 3 | 1 |
| None | 10,872 | - |
Source: Clifford Grammich, Kirk Hadaway, Richard Houseal, Dale E.Jones, Alexei Krindatch, Richie Stanley and Richard H.Taylor. 2012. 2010 U.S.Religion Census: Religious Congregations & Membership Study. Association of Statisticians of American Religious Bodies. Jones, Dale E., et al. 2002. Congregations and Membership in the United States 2000. Nashville, TN: Glenmary Research Center.
Food Environment Statistics:
| Llano County: | 1.64 / 10,000 pop. |
| State: | 1.47 / 10,000 pop. |
| This county: | 2.73 / 10,000 pop. |
| Texas: | 1.11 / 10,000 pop. |
| Llano County: | 6.54 / 10,000 pop. |
| Texas: | 3.95 / 10,000 pop. |
| This county: | 8.72 / 10,000 pop. |
| State: | 6.13 / 10,000 pop. |
| Llano County: | 11.3% |
| Texas: | 8.9% |
| Llano County: | 24.6% |
| State: | 26.6% |
| Here: | 15.4% |
| State: | 15.7% |
Agriculture in Llano County:
Average size of farms: 771 acresAverage value of agricultural products sold per farm: $16,965
Average value of crops sold per acre for harvested cropland: $68.31
The value of livestock, poultry, and their products as a percentage of the total market value of agricultural products sold: 95.20%
Average total farm production expenses per farm: $18,465
Harvested cropland as a percentage of land in farms: 1.55%
Irrigated harvested cropland as a percentage of land in farms: 7.95%
Average market value of all machinery and equipment per farm: $19,570
The percentage of farms operated by a family or individual: 86.99%
Average age of principal farm operators: 59 years
Average number of cattle and calves per 100 acres of all land in farms: 7.32
Milk cows as a percentage of all cattle and calves: 0.03%
Land in orchards: 373 acres
Earthquake activity:
Llano County-area historical earthquake activity is significantly above Texas state average. It is 13% smaller than the overall U.S. average.On 6/16/1978 at 11:46:54, a magnitude 5.3 (4.4 MB, 4.6 UK, 5.3 ML, Class: Moderate, Intensity: VI - VII) earthquake occurred 206.6 miles away from Llano County center
On 4/14/1995 at 00:32:56, a magnitude 5.7 (5.6 MB, 5.7 MS, 5.7 MW, Depth: 11.1 mi) earthquake occurred 288.3 miles away from the county center
On 10/20/2011 at 12:24:41, a magnitude 4.8 (4.8 MW, Depth: 3.1 mi, Class: Light, Intensity: IV - V) earthquake occurred 130.5 miles away from the county center
On 4/9/1993 at 12:29:19, a magnitude 4.3 (4.1 MB, 4.3 LG, Depth: 3.1 mi) earthquake occurred 133.6 miles away from the county center
On 1/2/1992 at 11:45:35, a magnitude 5.0 (4.6 MB, 5.0 LG, Depth: 3.1 mi) earthquake occurred 290.7 miles away from Llano County center
On 5/17/2012 at 08:12:00, a magnitude 4.8 (4.8 MW, Depth: 3.1 mi) earthquake occurred 261.3 miles away from the county center
Magnitude types: regional Lg-wave magnitude (LG), body-wave magnitude (MB), local magnitude (ML), surface-wave magnitude (MS), moment magnitude (MW)
Most recent natural disasters:
- Texas Covid-19 Pandemic, Incident Period: January 20, 2020, FEMA Id: 4485, Natural disaster type: Other
- Texas Severe Storms And Flooding, Incident Period: September 10, 2018 - November 2, 2018, FEMA Id: 4416, Natural disaster type: Storm, Flood
- Texas Wildfires, Incident Period: March 14, 2008 to September 01, 2008, Emergency Declared EM-3284: March 14, 2008, FEMA Id: 3284, Natural disaster type: Fire
- Texas Severe Storms, Tornadoes, and Flooding, Incident Period: June 16, 2007 to August 03, 2007, Major Disaster (Presidential) Declared DR-1709: June 29, 2007, FEMA Id: 1709, Natural disaster type: Storm, Tornado, Flood
- Texas Hurricane Rita, Incident Period: September 23, 2005 to October 14, 2005, Major Disaster (Presidential) Declared DR-1606: September 24, 2005, FEMA Id: 1606, Natural disaster type: Hurricane
- Texas Hurricane Rita, Incident Period: September 20, 2005 to October 14, 2005, Emergency Declared EM-3261: September 21, 2005, FEMA Id: 3261, Natural disaster type: Hurricane
- Texas Hurricane Katrina, Incident Period: August 29, 2005 to October 01, 2005, Emergency Declared EM-3216: September 02, 2005, FEMA Id: 3216, Natural disaster type: Hurricane
- Texas Extreme Fire Hazards, Incident Period: August 01, 1999 to December 10, 1999, Emergency Declared EM-3142: September 01, 1999, FEMA Id: 3142, Natural disaster type: Fire
- Texas Severe Storms/Flooding, Incident Period: June 21, 1997 to July 15, 1997, Major Disaster (Presidential) Declared DR-1179: July 07, 1997, FEMA Id: 1179, Natural disaster type: Storm, Flood
- Texas Extreme Fire Hazard, Incident Period: August 30, 1993 to November 15, 1993, Emergency Declared EM-3113: September 10, 1993, FEMA Id: 3113, Natural disaster type: Fire
- 1 other natural disasters have been reported since 1953.
The number of natural disasters in Llano County (11) is smaller than the US average (15).
Major Disasters (Presidential) Declared: 4
Emergencies Declared: 5
Causes of natural disasters: Storms: 4, Fires: 3, Floods: 3, Hurricanes: 3, Tornado: 1, Other: 1 (Note: some incidents may be assigned to more than one category).
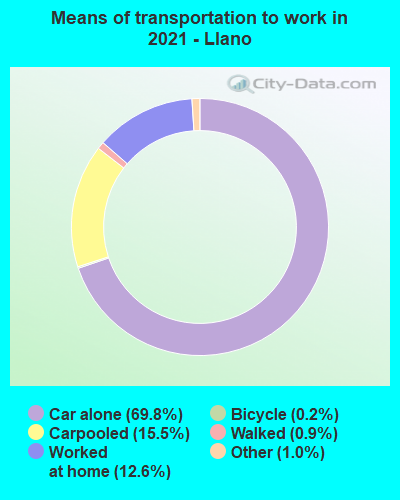
Means of transportation to work:
- Drove a car alone: 4,155 (64.6%)
- Carpooled: 885 (13.8%)
- Taxicab, motorcycle, or other means: 78 (1.2%)
- Bicycle: 7 (0.1%)
- Walked: 120 (1.9%)
- Worked at home: 1,308 (20.4%)
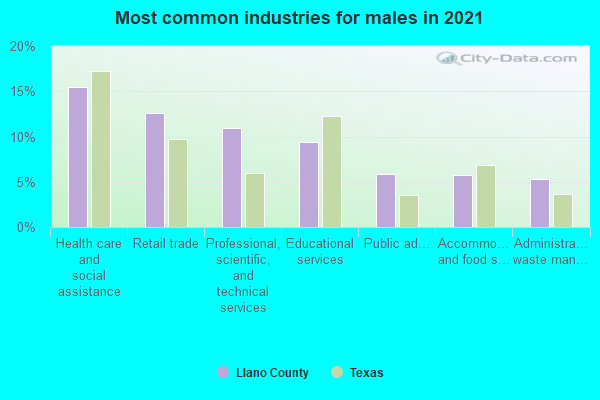
- Health care and social assistance (18%)
- Retail trade (13%)
- Educational services (10%)
- Professional, scientific, and technical services (9%)
- Accommodation and food services (7%)
- Real estate and rental and leasing (5%)
- Construction (5%)
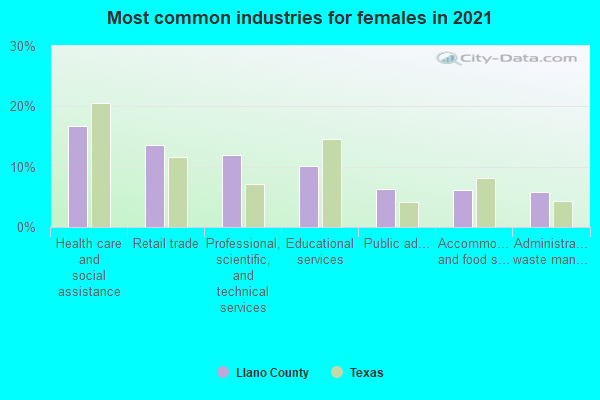
- Health care and social assistance (19%)
- Retail trade (14%)
- Educational services (10%)
- Professional, scientific, and technical services (9%)
- Accommodation and food services (7%)
- Real estate and rental and leasing (5%)
- Construction (5%)
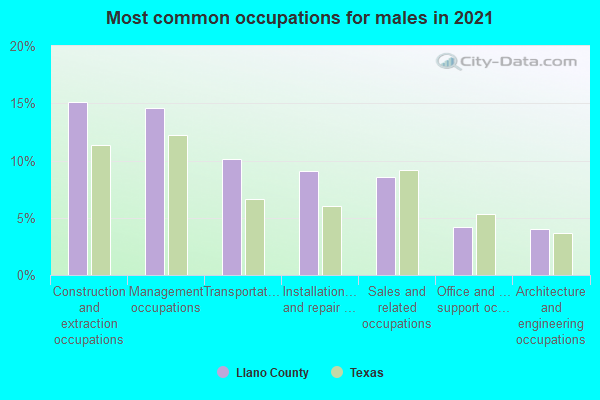
- Management occupations (17%)
- Construction and extraction occupations (14%)
- Sales and related occupations (12%)
- Transportation occupations (10%)
- Installation, maintenance, and repair occupations (6%)
- Office and administrative support occupations (6%)
- Material moving occupations (5%)
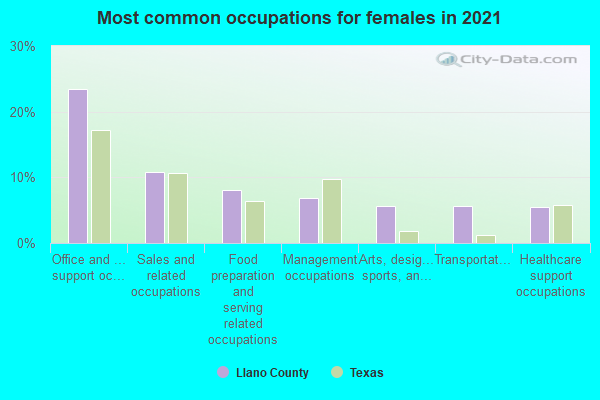
- Office and administrative support occupations (22%)
- Sales and related occupations (11%)
- Management occupations (8%)
- Food preparation and serving related occupations (7%)
- Educational instruction, and library occupations (7%)
- Arts, design, entertainment, sports, and media occupations (6%)
- Health technologists and technicians (6%)
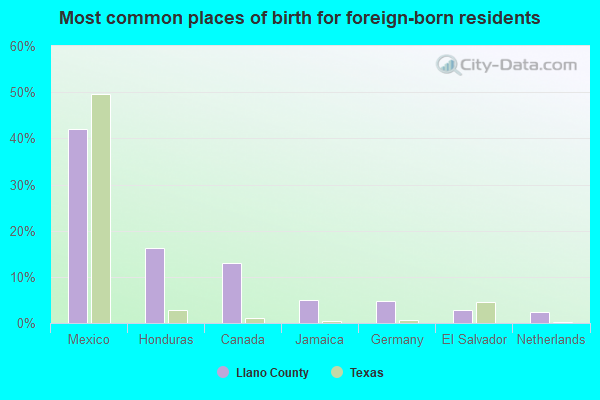
- Mexico (47%)
- Honduras (15%)
- Canada (9%)
- Germany (6%)
- El Salvador (4%)
- Jamaica (4%)
- United Kingdom, excluding England and Scotland (2%)
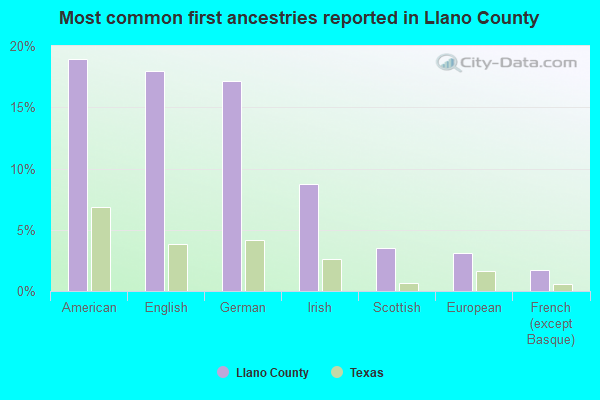
- German (19%)
- English (17%)
- American (17%)
- Irish (8%)
- Scottish (4%)
- European (3%)
- French (except Basque) (2%)
6 people in group homes intended for adults
People in group quarters in Llano County, Texas in 2000:
- 216 people in nursing homes
- 17 people in local jails and other confinement facilities (including police lockups)
- 15 people in homes for the mentally retarded
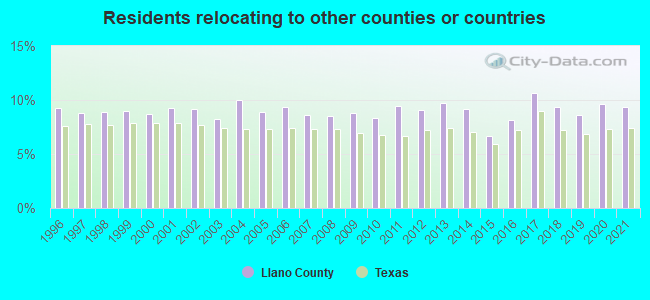
14.19% of this county's 2021 resident taxpayers lived in other counties in 2020 ($126,629 average adjusted gross income)
| Here: | 14.19% |
| Texas average: | 8.12% |
10 or fewer of this county's residents moved from foreign countries.
11.92% relocated from other counties in Texas ($105,180 average AGI)
2.27% relocated from other states ($21,449 average AGI)
Llano County: 2.27% Texas average: 2.83%

Top counties from which taxpayers relocated into this county between 2020 and 2021:
| from Burnet County, TX | |
| from Travis County, TX | |
| from Williamson County, TX | |
| from Bexar County, TX | |
| from Harris County, TX | |
| from Dallas County, TX | |
| from Gillespie County, TX |
9.33% of this county's 2020 resident taxpayers moved to other counties in 2021 ($86,145 average adjusted gross income)
| Here: | 9.33% |
| Texas average: | 7.40% |
10 or fewer of this county's residents moved to foreign countries.
7.81% relocated to other counties in Texas ($75,799 average AGI)
1.52% relocated to other states ($10,347 average AGI)
Llano County: 1.52% Texas average: 2.08%
Top counties to which taxpayers relocated from this county between 2020 and 2021:
| to Burnet County, TX | |
| to Travis County, TX | |
| to Williamson County, TX | |
| to Bexar County, TX |
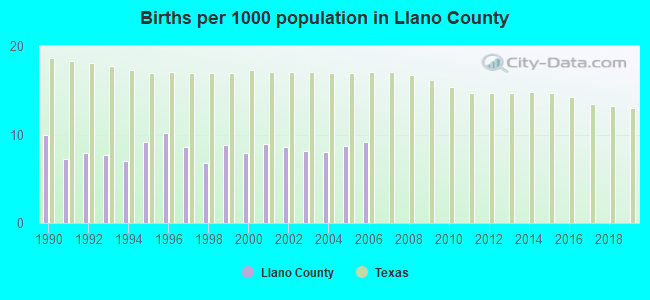
Births per 1000 population from 1990 to 1999: 8.3
Births per 1000 population from 2000 to 2006: 8.5
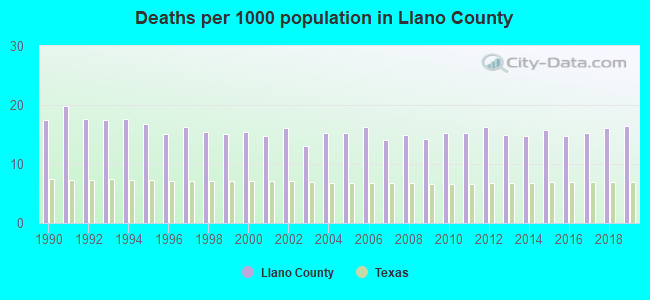
Deaths per 1000 population from 1990 to 1999: 16.9
Deaths per 1000 population from 2000 to 2009: 14.9
Deaths per 1000 population from 2010 to 2020: 15.6
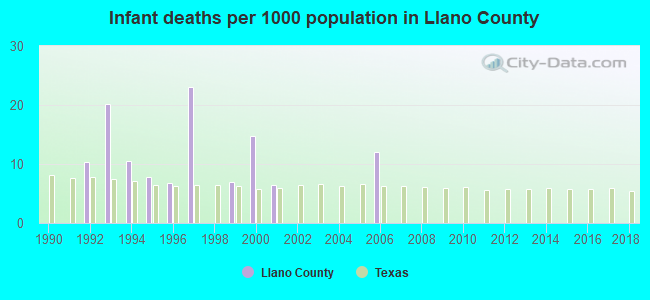
Infant deaths per 1000 live births from 1990 to 1999: 8.5
Infant deaths per 1000 live births from 2000 to 2006: 4.7
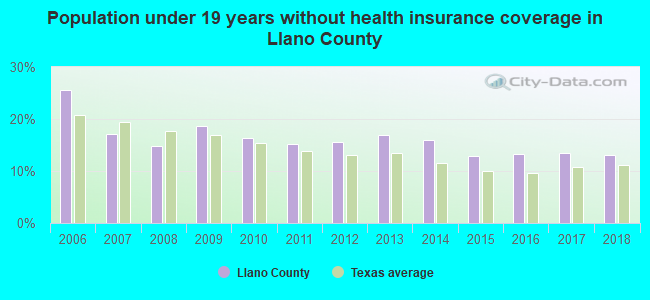
Persons under 19 years old without health insurance coverage in 2018: 13.1%

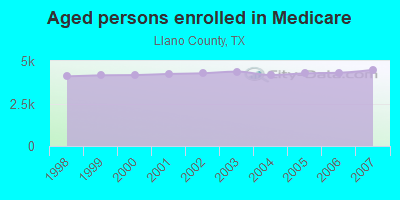
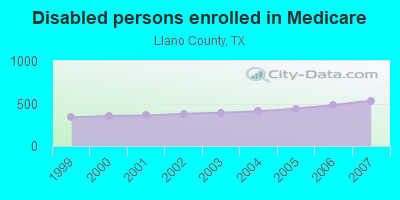
Persons enrolled in hospital insurance and/or supplemental medical insurance (Medicare) in July 1, 2007: 5,012 (4,478 aged, 534 disabled)
Children under 18 without health insurance coverage in 2007: 516 (16%)

Most common underlying causes of death in Llano County, Texas in 1999 - 2019:
- Bronchus or lung, unspecified - Malignant neoplasms (439)
- Acute myocardial infarction, unspecified (415)
- Chronic obstructive pulmonary disease, unspecified (332)
- Atherosclerotic heart disease (237)
- Unspecified dementia (233)
- Alzheimer disease, unspecified (191)
- Congestive heart failure (164)
- Pneumonia, unspecified (82)
- Stroke, not specified as haemorrhage or infarction (64)
- Atherosclerotic cardiovascular disease, so described (23)
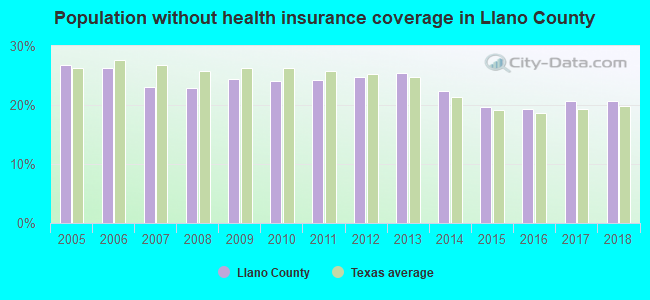
Population without health insurance coverage in 2000: 16%
Children under 18 without health insurance coverage in 2000: 16%
Short term general hospital admissions per 100,000 population in 2004: 9,640
Short term general hospital beds per 100,000 population in 2004: 165
Emergency room visits per 100,000 population in 2004: 42,220
General practice office based MDs per 100,000 population in 2005: 899
Medical specialist MDs per 100,000 population in 2005: 1,289
Dentists per 100,000 population in 1998: 16
Total births per 100,000 population, July 2005 - July 2006 : 30
Total deaths per 100,000 population, July 2005 - July 2006: 71
Limited-service eating places per 100,000 population in 2005 : 16
Suicides per 1,000,000 population from 2000 to 2006: 201.9. This is more than state average.
Household type by relationship:
Households: 22,218- Male householders: 5,043 (1,232 living alone), Female householders: 5,116 (1,766 living alone)
5,286 spouses (5,270 opposite-sex spouses), 542 unmarried partners, (457 opposite-sex unmarried partners), 4,376 children (3,702 natural, 541 adopted, 137 stepchildren), 579 grandchildren, 219 brothers or sisters, 370 parents, 0 foster children, 381 other relatives, 269 non-relatives
- In group quarters: 219
Size of family households: 4,604 2-persons, 922 3-persons, 730 4-persons, 409 5-persons, 145 6-persons, 37 7-or-more-persons.
Size of nonfamily households: 2,998 1-person, 361 2-persons, 11 3-persons.
1,678 married couples with children.
1,130 single-parent households (221 men, 909 women).
92.4% of residents of Llano speak English at home.
7.4% of residents speak Spanish at home (57% speak English very well, 24% speak English well, 12% speak English not well, 7% don't speak English at all).
0.8% of residents speak other Indo-European language at home (97% speak English very well, 3% speak English not well).
0.1% of residents speak Asian or Pacific Island language at home (52% speak English very well, 48% speak English well).
In fiscal year 2004:
Federal Government expenditure: $115,678,000 ($6,376 per capita)
Department of Defense expenditure: $7,382,000
Federal direct payments to individuals for retirement and disability: $75,049,000
Federal other direct payments to individuals: $28,231,000
Federal direct payments not to individuals: $167,000
Federal grants: $9,275,000
Federal procurement contracts: $566,000 ($0,000 Department of Defense)
Federal salaries and wages: $2,389,000 ($0,000 Department of Defense)
Federal Government direct loans: $67,000
Federal guaranteed/insured loans: $4,585,000
Federal Government insurance: $185,478,000
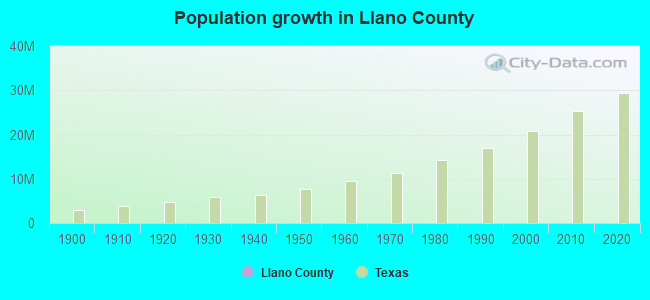
Population change from April 1, 2000 to July 1, 2005:
Births: 776| Here: | 43 per 1000 residents |
| State: | 85 per 1000 residents |
Deaths: 1,315
| Here: | 72 per 1000 residents |
| State: | 35 per 1000 residents |
Net international migration: +41
| Here: | +2 per 1000 residents |
| State: | +29 per 1000 residents |
Net internal migration: +1,719
| Here: | +94 per 1000 residents |
| State: | +10 per 1000 residents |
Total withdrawal of fresh water for public supply: 3.06 millions of gallons per day (5% from ground, 95% from surface)
| Here: | 5.8 |
| State: | 6.3 |
| Here: | 4.3 |
| State: | 4.0 |
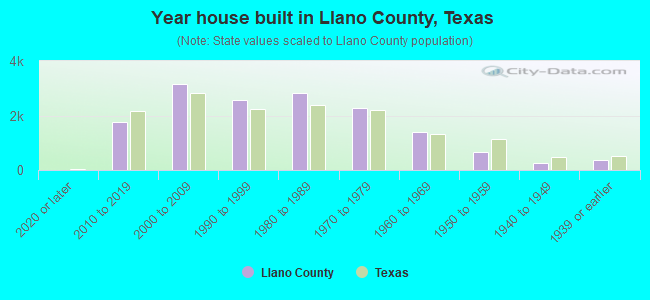
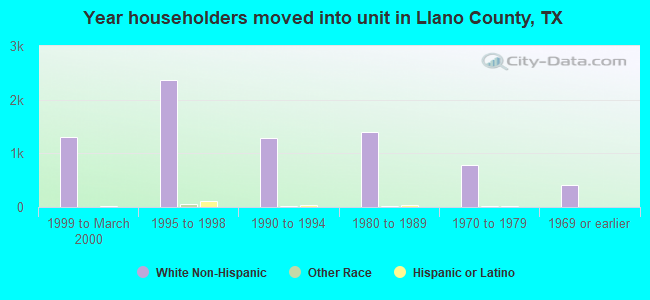
- Year house built in Llano County, Texas
- 622020 or later
- 1,9122010 to 2019
- 3,0682000 to 2009
- 2,6551990 to 1999
- 2,9871980 to 1989
- 2,1311970 to 1979
- 1,4821960 to 1969
- 5721950 to 1959
- 1981940 to 1949
- 2911939 or earlier
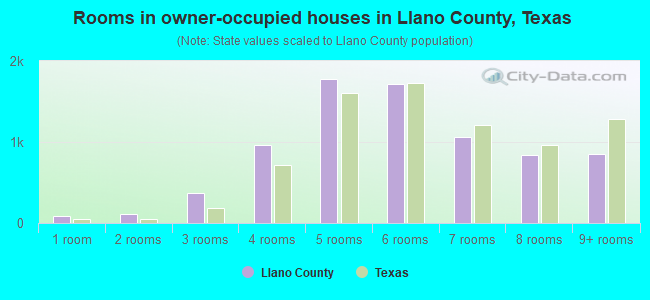
- Rooms in owner-occupied houses in Llano County, Texas
- 731 room
- 1392 rooms
- 3743 rooms
- 1,0154 rooms
- 1,8035 rooms
- 1,8926 rooms
- 1,1327 rooms
- 8648 rooms
- 7629+ rooms

- Rooms in renter-occupied apartments in Llano County, Texas
- 1081 room
- 892 rooms
- 2723 rooms
- 7134 rooms
- 5055 rooms
- 1996 rooms
- 1297 rooms
- 958 rooms
- 79+ rooms

- Bedrooms in owner-occupied houses in Llano County, Texas
- 82no bedroom
- 3181 bedroom
- 1,6212 bedrooms
- 4,5643 bedrooms
- 1,2104 bedrooms
- 1905+ bedrooms
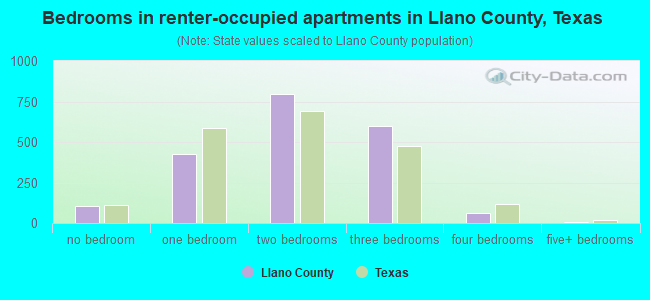
- Bedrooms in renter-occupied apartments in Llano County, Texas
- 107no bedroom
- 4051 bedroom
- 7692 bedrooms
- 7513 bedrooms
- 864 bedrooms
- 95+ bedrooms
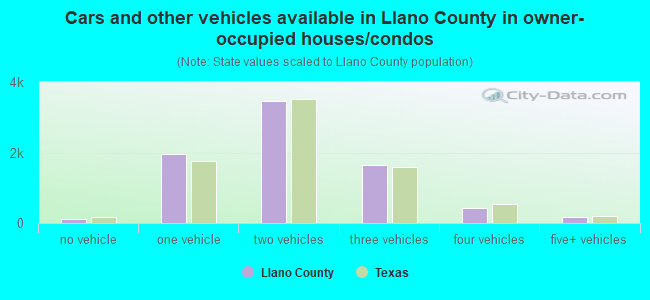
- Cars and other vehicles available in Llano County in owner-occupied houses/condos
- 161no vehicle
- 2,2561 vehicle
- 3,6792 vehicles
- 1,3733 vehicles
- 4184 vehicles
- 1505+ vehicles
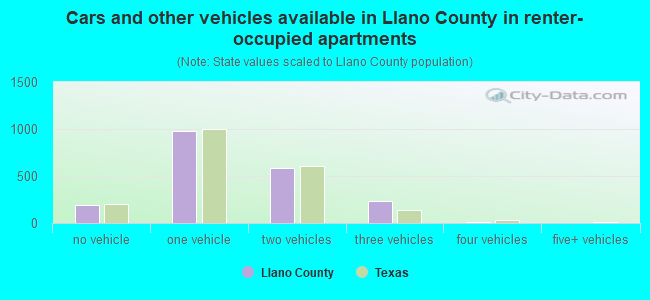
- Cars and other vehicles available in Llano County in renter-occupied apartments
- 189no vehicle
- 1,0991 vehicle
- 6282 vehicles
- 2263 vehicles
- 04 vehicles
- 05+ vehicles
88.0% of Llano County residents lived in the same house 1 years ago.
Out of people who lived in different houses, 20% lived in this county.
Out of people who lived in different counties, 92% lived in Texas.
| Llano County: | 88.0% |
| State average: | 85.7% |
Place of birth for U.S.-born residents:
- This state: 13,845
- Other state: 7,262
- Northeast: 766
- Midwest: 2,062
- South: 2,220
- West: 2,226

- 86.6%Electricity
- 6.2%Bottled, tank, or LP gas
- 4.8%Utility gas
- 1.6%Wood
- 0.4%Solar energy
- 0.2%Other fuel
- 0.2%No fuel used

- 90.6%Electricity
- 5.1%Utility gas
- 2.3%Bottled, tank, or LP gas
- 1.7%Wood
- 0.2%Other fuel
- 0.1%No fuel used
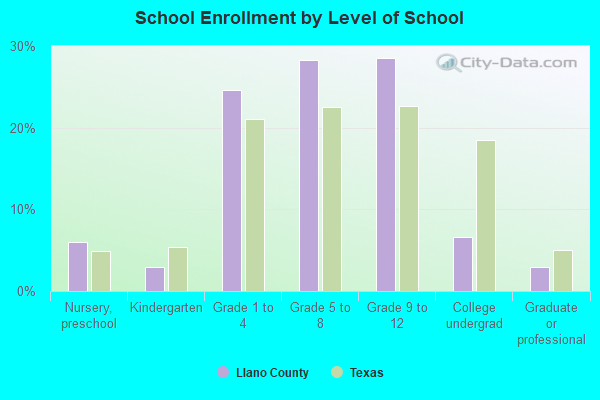
Private vs. public school enrollment:
| Here: | 11.2% |
| Texas: | 8.8% |
| Here: | 17.7% |
| Texas: | 8.0% |
| Here: | 11.2% |
| Texas: | 16.2% |
Llano County government finances - Expenditure in 2017:
- Charges - Other: $1,200,000
- Current Operations - Police Protection: $4,803,000
Central Staff Services: $3,806,000
Regular Highways: $2,486,000
Judicial and Legal Services: $2,277,000
Financial Administration: $1,434,000
General Public Buildings: $1,044,000
Libraries: $648,000
General - Other: $184,000
Natural Resources - Other: $144,000
Public Welfare, Vendor Payments for Medical Care: $31,000
- General - Interest on Debt: $72,000
- Long Term Debt - Beginning Outstanding - Unspecified Public Purpose: $2,340,000
Outstanding Unspecified Public Purpose: $1,665,000
Retired Unspecified Public Purpose: $675,000
- Miscellaneous - Interest Earnings: $0
- Other Capital Outlay - General Public Building: $504,000
Regular Highways: $184,000
Police Protection: $16,000
- State Intergovernmental - General Local Government Support: $111,000
Highways: $67,000
- Tax - Property: $11,931,000
Motor Vehicle License: $737,000
Other Selective Sales: $131,000
General Sales and Gross Receipts: $33,000
Llano County government finances - Revenue in 2017:
- Charges - Other: $1,200,000
- Current Operations - Police Protection: $4,803,000
Central Staff Services: $3,806,000
Regular Highways: $2,486,000
Judicial and Legal Services: $2,277,000
Financial Administration: $1,434,000
General Public Buildings: $1,044,000
Libraries: $648,000
General - Other: $184,000
Natural Resources - Other: $144,000
Public Welfare, Vendor Payments for Medical Care: $31,000
- General - Interest on Debt: $72,000
- Long Term Debt - Beginning Outstanding - Unspecified Public Purpose: $2,340,000
Outstanding Unspecified Public Purpose: $1,665,000
Retired Unspecified Public Purpose: $675,000
- Miscellaneous - Interest Earnings: $0
- Other Capital Outlay - General Public Building: $504,000
Regular Highways: $184,000
Police Protection: $16,000
- State Intergovernmental - General Local Government Support: $111,000
Highways: $67,000
- Tax - Property: $11,931,000
Motor Vehicle License: $737,000
Other Selective Sales: $131,000
General Sales and Gross Receipts: $33,000
Llano County government finances - Debt in 2017:
- Charges - Other: $1,200,000
- Current Operations - Police Protection: $4,803,000
Central Staff Services: $3,806,000
Regular Highways: $2,486,000
Judicial and Legal Services: $2,277,000
Financial Administration: $1,434,000
General Public Buildings: $1,044,000
Libraries: $648,000
General - Other: $184,000
Natural Resources - Other: $144,000
Public Welfare, Vendor Payments for Medical Care: $31,000
- General - Interest on Debt: $72,000
- Long Term Debt - Beginning Outstanding - Unspecified Public Purpose: $2,340,000
Outstanding Unspecified Public Purpose: $1,665,000
Retired Unspecified Public Purpose: $675,000
- Miscellaneous - Interest Earnings: $0
- Other Capital Outlay - General Public Building: $504,000
Regular Highways: $184,000
Police Protection: $16,000
- State Intergovernmental - General Local Government Support: $111,000
Highways: $67,000
- Tax - Property: $11,931,000
Motor Vehicle License: $737,000
Other Selective Sales: $131,000
General Sales and Gross Receipts: $33,000
Llano County government finances - Cash and Securities in 2017:
- Charges - Other: $1,200,000
- Current Operations - Police Protection: $4,803,000
Central Staff Services: $3,806,000
Regular Highways: $2,486,000
Judicial and Legal Services: $2,277,000
Financial Administration: $1,434,000
General Public Buildings: $1,044,000
Libraries: $648,000
General - Other: $184,000
Natural Resources - Other: $144,000
Public Welfare, Vendor Payments for Medical Care: $31,000
- General - Interest on Debt: $72,000
- Long Term Debt - Beginning Outstanding - Unspecified Public Purpose: $2,340,000
Outstanding Unspecified Public Purpose: $1,665,000
Retired Unspecified Public Purpose: $675,000
- Miscellaneous - Interest Earnings: $0
- Other Capital Outlay - General Public Building: $504,000
Regular Highways: $184,000
Police Protection: $16,000
- State Intergovernmental - General Local Government Support: $111,000
Highways: $67,000
- Tax - Property: $11,931,000
Motor Vehicle License: $737,000
Other Selective Sales: $131,000
General Sales and Gross Receipts: $33,000
Supplemental Security Income (SSI) in 2006:
- Total number of recipients: 325
- Number of aged recipients: 50
- Number of blind and disabled recipients: 275
- Number of recipients under 18: 42
- Number of recipients between 18 and 64: 199
- Number of recipients older than 64: 84
- Number of recipients also receiving OASDI: 155
- Amount of payments (thousands of dollars): 126
| Most common first names in Llano County, TX among deceased individuals | ||
| Name | Count | Lived (average) |
|---|---|---|
| James | 257 | 73.6 years |
| William | 253 | 76.4 years |
| John | 252 | 75.7 years |
| Mary | 232 | 80.3 years |
| Robert | 172 | 74.1 years |
| Charles | 127 | 75.4 years |
| George | 119 | 75.3 years |
| Dorothy | 79 | 78.4 years |
| Ruth | 73 | 82.2 years |
| Thomas | 71 | 74.7 years |
| Most common last names in Llano County, TX among deceased individuals | ||
| Last name | Count | Lived (average) |
|---|---|---|
| Smith | 180 | 78.3 years |
| Davis | 72 | 78.9 years |
| Moore | 67 | 80.7 years |
| Williams | 64 | 76.8 years |
| Jones | 59 | 77.0 years |
| Miller | 55 | 76.5 years |
| Lewis | 52 | 78.2 years |
| Johnson | 52 | 77.4 years |
| Jackson | 51 | 74.1 years |
| Walker | 49 | 74.3 years |
| Businesses in Llano County, TX | ||||
| Name | Count | Name | Count | |
|---|---|---|---|---|
| 7-Eleven | 1 | La-Z-Boy | 1 | |
| Ace Hardware | 1 | Lane Furniture | 1 | |
| Alco Stores | 1 | Pizza Hut | 1 | |
| Best Western | 1 | RadioShack | 2 | |
| Chevrolet | 1 | SONIC Drive-In | 2 | |
| Dairy Queen | 2 | Subway | 2 | |
| Days Inn | 1 | U-Haul | 1 | |
| FedEx | 2 | UPS | 2 | |
| H&R Block | 1 | |||
Llano County on our top lists:
- #74 on the list of "Top 101 counties with the highest number of deaths per 1000 residents 2007-2013"