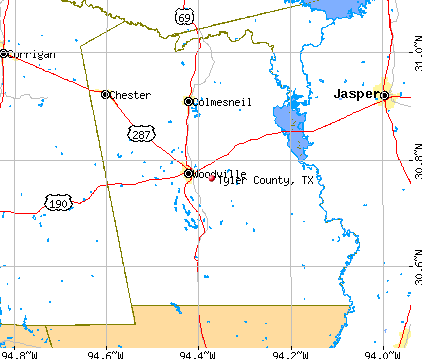
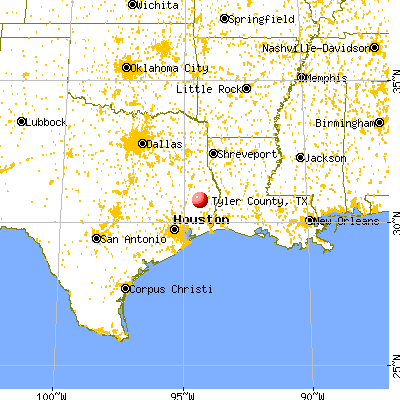
Tyler County, Texas (TX)
County owner-occupied free and clear houses and condos in 2010: 4,179
County owner-occupied houses and condos in 2000: 6,531
Renter-occupied apartments: 1,385 (it was 1,244 in 2000)
| % of renters here: | 16% |
| State: | 36% |
Land area: 923 sq. mi.
Water area: 12.8 sq. mi.
Population density: 22 people per square mile (low).
Industries providing employment: Educational, health and social services (18.0%), Retail trade (12.4%).
Type of workers:
- Private wage or salary: 74%
- Government: 18%
- Self-employed, not incorporated: 8%
- Unpaid family work: 0%
- OSM Map
- General Map
- Google Map
- MSN Map

- 15,58377.3%White Non-Hispanic Alone
- 2,14310.6%Black Non-Hispanic Alone
- 1,4797.3%Hispanic or Latino
- 7163.6%Two or more races
- 1450.7%Asian alone
- 720.4%Some other race alone
- 280.1%American Indian and Alaska Native alone

| Median resident age: | 43.1 years |
| Texas median age: | 35.6 years |
| Males: 11,121 | |
| Females: 9,377 |


| Tyler County: | 2.0 people |
| Texas: | 3 people |
Estimated median household income in 2022: $50,374 ($29,808 in 1999)
| This county: | $50,374 |
| Texas: | $72,284 |
Median contract rent in 2022 for apartments: $712 (lower quartile is $519, upper quartile is $850)
| This county: | $712 |
| State: | $1117 |
Estimated median house or condo value in 2022: $144,527 (it was $46,400 in 2000)
| Tyler: | $144,527 |
| Texas: | $275,400 |
Mean price in 2022:
Median monthly housing costs for homes and condos with a mortgage: $1,267Detached houses: $205,470
Here: $205,470 State: $369,058 Townhouses or other attached units: $127,433
Here: $127,433 State: $327,631 Mobile homes: $120,751
Here: $120,751 State: $124,413 Occupied boats, RVs, vans, etc.: $25,317
Here: $25,317 State: $73,921
Median monthly housing costs for units without a mortgage: $455
Institutionalized population: 2,015
Crime in 2021 (reported by the sheriff's office or county police, not the county total):
- Murders: 3
- Rapes: 2
- Robberies: 2
- Assaults: 17
- Burglaries: 69
- Thefts: 78
- Auto thefts: 38
Crime in 2020 (reported by the sheriff's office or county police, not the county total):
- Murders: 0
- Rapes: 3
- Robberies: 3
- Assaults: 28
- Burglaries: 80
- Thefts: 66
- Auto thefts: 25
Single-family new house construction building permits:
- 2022: 4 buildings, average cost: $75,000
- 2021: 9 buildings, average cost: $217,500
- 2020: 22 buildings, average cost: $209,100
- 2019: 6 buildings, average cost: $204,900
- 2018: 5 buildings, average cost: $50,000
- 2017: 6 buildings, average cost: $50,000
- 2016: 9 buildings, average cost: $86,700
- 2015: 9 buildings, average cost: $91,400
- 2014: 1 building, cost: $130,000
- 2013: 0 buildings
- 2012: 1 building, cost: $40,000
- 2011: 0 buildings
- 2010: 4 buildings, average cost: $58,800
- 2009: 4 buildings, average cost: $86,400
- 2008: 2 buildings, average cost: $29,000
- 2007: 2 buildings, average cost: $95,000
- 2006: 9 buildings, average cost: $71,600
- 2005: 3 buildings, average cost: $149,200
- 2004: 4 buildings, average cost: $87,300
- 2003: 1 building, cost: $240,000
- 2002: 1 building, cost: $65,000
- 2001: 1 building, cost: $60,000
- 2000: 1 building, cost: $30,000
- 1999: 3 buildings, average cost: $68,700
- 1998: 3 buildings, average cost: $134,500
- 1997: 4 buildings, average cost: $115,000


Median real estate property taxes paid for housing units with mortgages in 2022: $1,519 (1.0%)
Median real estate property taxes paid for housing units with no mortgage in 2022: $1,124 (0.8%)


| Tyler County: | 18.0% |
| Texas: | 14.0% |
Median age of residents in 2022: 43.1 years old
(Males: 40.4 years old, Females: 49.2 years old)
(Median age for: White residents: 48.1 years old, Black residents: 36.4 years old, American Indian residents: 53.2 years old, Asian residents: 43.4 years old, Hispanic or Latino residents: 28.2 years old, Other race residents: 24.4 years old)
Fair market rent in 2006 for a 1-bedroom apartment in Tyler County is $403 a month.
Fair market rent for a 2-bedroom apartment is $484 a month.
Fair market rent for a 3-bedroom apartment is $623 a month.
Cities in this county include: Spurger, Warren, Woodville, Colmesneil, Ivanhoe North, Chester.
Notable locations in this county outside city limits:
Notable locations in Tyler County: Lost Indian Camp (A), Smither Farm (B), Smither Prison Farm (C), Bath Lookout (D), Bethel Way Ranch (E), Dell Ranch (F), Dodge Lookout (G), Four Notch Lookout (H), Hayman Ranch (I), Lost Meadows Ranch (J), M-Four Ranch (K), Moores Grove Lookout (L), Randall Ranch (M), Stewart Ranch (N), Camp Alice (O), Stubblefield Recreation Site (P), Cagle Recreation Site (Q), Townley Spur (R), Bar O Ranch (S), East Sandy (T). Display/hide their locations on the map
Churches in Tyler County include: Shiloh Church (A), Paces Chapel (B), Union Hill Church (C), Unity Church (D), Harmony Grove Church (E), Pilgrim Ridge Church (F), Pine Prairie Church (G), Saint Marks Church (H), Saint Marys Church (I). Display/hide their locations on the map
Cemeteries: Martha Chapel Cemetery (1), Allen Cemetery (2), Brushy Cemetery (3), Cline Prairie Cemetery (4), Cleveland Cemetery (5), Gospel Hill Cemetery (6), McCowan Cemetery (7). Display/hide their locations on the map
Lakes and reservoirs: Lake Thomas (A), Belle and Ford Lake (B), Thomas Lake (C), Black Lake (D), Belle and Ford Lake (E), Walker Lake (F), Horseshoe Lake (G), Stewart Lake (H). Display/hide their locations on the map
Streams, rivers, and creeks: Brown Branch (A), Brushy Creek (B), Black Oak Branch (C), Boney Branch (D), Bear Branch (E), Bear Creek (F), Wright Creek (G), Suttun Creek (H), Wolf Branch (I). Display/hide their locations on the map
Park in Tyler County: Huntsville State Park (1). Display/hide its location on the map
Neighboring counties: Atkinson County, Georgia  , Hamilton County, Florida , Echols County, Georgia , Stone County, Mississippi , Jeff Davis County
  , Tift County, Georgia .
| Here: | 5.4% |
| Texas: | 3.5% |


Current college students: 491
People 25 years of age or older with a high school degree or higher: 82.6%
People 25 years of age or older with a bachelor's degree or higher: 13.1%
Number of foreign born residents: 518 (42.7% naturalized citizens)
| Tyler County: | 2.5% |
| Whole state: | 17.2% |

- Year of entry for the foreign-born population
- 1672010 or later
- 1102000 to 2009
- 1131990 to 1999
- 581980 to 1989
- 151970 to 1979
- 57Before 1970
Mean travel time to work (commute): minutes
Percentage of county residents living and working in this county: 99.7%
Housing units in structures:
- One, detached: 7,360
- One, attached: 157
- Two: 168
- 3 or 4: 16
- 5 to 9: 88
- 10 to 19: 113
- 20 to 49: 66
- 50 or more: 31
- Mobile homes: 1,698
- Boats, RVs, vans, etc.: 113
Housing units in Tyler County with a mortgage: 2,148 (129 second mortgage, 0 home equity loan, 122 both second mortgage and home equity loan)
Houses without a mortgage: 147
| Here: | 1.3% with mortgage |
| State: | 98.4% with mortgage |
Religion statistics for Tyler County
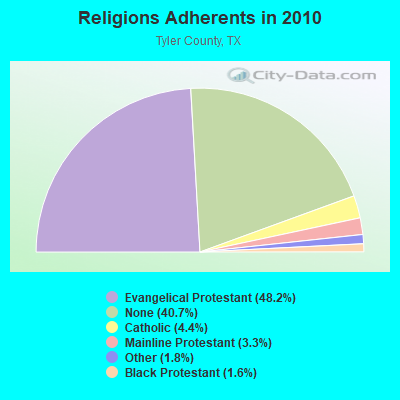
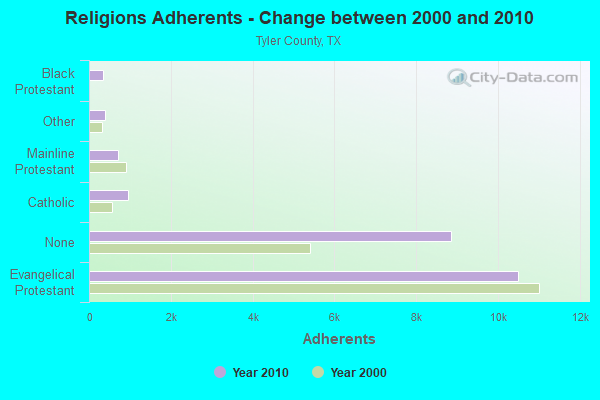
| Religion | Adherents | Congregations |
|---|---|---|
| Evangelical Protestant | 10,489 | 49 |
| Catholic | 950 | 1 |
| Mainline Protestant | 710 | 5 |
| Other | 397 | 2 |
| Black Protestant | 354 | 2 |
| None | 8,866 | - |
Source: Clifford Grammich, Kirk Hadaway, Richard Houseal, Dale E.Jones, Alexei Krindatch, Richie Stanley and Richard H.Taylor. 2012. 2010 U.S.Religion Census: Religious Congregations & Membership Study. Association of Statisticians of American Religious Bodies. Jones, Dale E., et al. 2002. Congregations and Membership in the United States 2000. Nashville, TN: Glenmary Research Center.
Food Environment Statistics:
| Tyler County: | 1.97 / 10,000 pop. |
| State: | 1.47 / 10,000 pop. |
| Tyler County: | 5.41 / 10,000 pop. |
| Texas: | 3.95 / 10,000 pop. |
| This county: | 3.93 / 10,000 pop. |
| State: | 6.13 / 10,000 pop. |
| Tyler County: | 10.0% |
| Texas: | 8.9% |
| Tyler County: | 26.1% |
| State: | 26.6% |
| Here: | 13.1% |
| State: | 15.7% |
Agriculture in Tyler County:
Average size of farms: 129 acresAverage value of agricultural products sold per farm: $7,645
Average value of crops sold per acre for harvested cropland: $127.64
The value of nursery, greenhouse, floriculture, and sod as a percentage of the total market value of agricultural products sold: 10.46%
The value of livestock, poultry, and their products as a percentage of the total market value of agricultural products sold: 66.05%
Average total farm production expenses per farm: $12,807
Harvested cropland as a percentage of land in farms: 15.71%
Average market value of all machinery and equipment per farm: $25,830
The percentage of farms operated by a family or individual: 96.42%
Average age of principal farm operators: 57 years
Average number of cattle and calves per 100 acres of all land in farms: 18.03
Milk cows as a percentage of all cattle and calves: 0.22%
Corn for grain: 55 harvested acres
Vegetables: 64 harvested acres
Land in orchards: 40 acres
Tornado activity:
Tyler County historical area-adjusted tornado activity is significantly below Texas state average. It is 7722485.5 times below overall U.S. average.Tornadoes in this county have caused one fatality and 20 injuries recorded between 1950 and 2004.
On 2/10/1981, a category 2 (max. wind speeds 113-157 mph) tornado killed one person and injured 8 people and caused between $50,000 and $500,000 in damages.
Earthquake activity:
Tyler County-area historical earthquake activity is significantly above Texas state average. It is 27% smaller than the overall U.S. average.On 5/17/2012 at 08:12:00, a magnitude 4.8 (4.8 MW, Depth: 3.1 mi, Class: Light, Intensity: IV - V) earthquake occurred 80.5 miles away from Tyler County center
On 9/2/2013 at 23:51:15, a magnitude 4.3 (4.3 MW, Depth: 2.9 mi) earthquake occurred 79.4 miles away from the county center
On 9/2/2013 at 21:52:38, a magnitude 4.2 (4.2 MW, Depth: 3.0 mi) earthquake occurred 83.7 miles away from the county center
On 1/25/2013 at 07:01:19, a magnitude 4.1 (4.1 MB, Depth: 3.1 mi) earthquake occurred 74.9 miles away from the county center
On 5/10/2012 at 15:15:38, a magnitude 3.9 (3.9 MW, Depth: 4.3 mi, Class: Light, Intensity: II - III) earthquake occurred 83.3 miles away from Tyler County center
On 10/20/2011 at 12:24:41, a magnitude 4.8 (4.8 MW, Depth: 3.1 mi) earthquake occurred 258.2 miles away from the county center
Magnitude types: body-wave magnitude (MB), moment magnitude (MW)
Most recent natural disasters:
- Texas Covid-19 Pandemic, Incident Period: January 20, 2020, FEMA Id: 4485, Natural disaster type: Other
- Texas Hurricane Harvey, Incident Period: August 23, 2017 - September 15, 2017, FEMA Id: 4332, Natural disaster type: Hurricane
- Texas Severe Storms and Flooding, Incident Period: May 22, 2016 to June 24, 2016, Major Disaster (Presidential) Declared DR-4272: June 11, 2016, FEMA Id: 4272, Natural disaster type: Storm, Flood
- Texas Severe Storms, Tornadoes, and Flooding, Incident Period: March 07, 2016 to March 29, 2016, Major Disaster (Presidential) Declared DR-4266: March 19, 2016, FEMA Id: 4266, Natural disaster type: Storm, Tornado, Flood
- Texas Severe Storms, Tornadoes, Straight-line Winds, and Flooding, Incident Period: May 04, 2015 to June 23, 2015, Major Disaster (Presidential) Declared DR-4223: May 29, 2015, FEMA Id: 4223, Natural disaster type: Storm, Tornado, Flood, Wind
- Texas Hurricane Ike, Incident Period: September 07, 2008 to October 02, 2008, Major Disaster (Presidential) Declared DR-1791: September 13, 2008, FEMA Id: 1791, Natural disaster type: Hurricane
- Texas Hurricane Ike, Incident Period: September 07, 2008 to September 26, 2008, Emergency Declared EM-3294: September 10, 2008, FEMA Id: 3294, Natural disaster type: Hurricane
- Texas Hurricane Gustav, Incident Period: August 27, 2008 to September 07, 2008, Emergency Declared EM-3290: August 29, 2008, FEMA Id: 3290, Natural disaster type: Hurricane
- Texas Wildfires, Incident Period: March 14, 2008 to September 01, 2008, Emergency Declared EM-3284: March 14, 2008, FEMA Id: 3284, Natural disaster type: Fire
- Texas Hurricane Rita, Incident Period: September 23, 2005 to October 14, 2005, Major Disaster (Presidential) Declared DR-1606: September 24, 2005, FEMA Id: 1606, Natural disaster type: Hurricane
- 12 other natural disasters have been reported since 1953.
The number of natural disasters in Tyler County (22) is greater than the US average (15).
Major Disasters (Presidential) Declared: 12
Emergencies Declared: 7
Causes of natural disasters: Floods: 9, Storms: 9, Hurricanes: 7, Fires: 4, Tornadoes: 4, Tropical Storm: 1, Wind: 1, Other: 1 (Note: some incidents may be assigned to more than one category).

Means of transportation to work:
- Drove a car alone: 3,473 (71.3%)
- Carpooled: 644 (13.2%)
- Taxicab, motorcycle, or other means: 315 (6.5%)
- Walked: 68 (1.4%)
- Worked at home: 325 (6.7%)


- Health care and social assistance (17%)
- Retail trade (14%)
- Educational services (10%)
- Finance and insurance (7%)
- Public administration (6%)
- Other services, except public administration (5%)
- Administrative and support and waste management services (4%)

- Health care and social assistance (20%)
- Retail trade (17%)
- Educational services (12%)
- Finance and insurance (8%)
- Public administration (7%)
- Other services, except public administration (6%)
- Administrative and support and waste management services (4%)

- Installation, maintenance, and repair occupations (14%)
- Transportation occupations (11%)
- Construction and extraction occupations (11%)
- Production occupations (9%)
- Sales and related occupations (8%)
- Management occupations (8%)
- Law enforcement workers including supervisors (6%)

- Office and administrative support occupations (21%)
- Management occupations (16%)
- Sales and related occupations (10%)
- Food preparation and serving related occupations (8%)
- Educational instruction, and library occupations (7%)
- Healthcare support occupations (6%)
- Health diagnosing and treating practitioners and other technical occupations (4%)

- Mexico (56%)
- Vietnam (10%)
- Panama (8%)
- Philippines (6%)
- El Salvador (4%)
- Canada (2%)
- China, excluding Hong Kong and Taiwan (2%)

- American (28%)
- German (12%)
- English (9%)
- French (except Basque) (4%)
- Irish (4%)
- Cajun (1%)
- Scottish (1%)


People in group quarters in Tyler County, Texas in 2010:
- 1,737 people in state prisons
- 433 people in workers' group living quarters and job corps centers
- 169 people in nursing facilities/skilled-nursing facilities
- 72 people in local jails and other municipal confinement facilities
- 37 people in residential treatment centers for juveniles (non-correctional)
People in group quarters in Tyler County, Texas in 2000:
- 1,313 people in state prisons
- 211 people in nursing homes
- 30 people in local jails and other confinement facilities (including police lockups)
- 30 people in residential treatment centers for emotionally disturbed children
10.63% of this county's 2021 resident taxpayers lived in other counties in 2020 ($50,249 average adjusted gross income)
| Here: | 10.63% |
| Texas average: | 8.12% |
10 or fewer of this county's residents moved from foreign countries.
9.32% relocated from other counties in Texas ($44,305 average AGI)
1.31% relocated from other states ($5,944 average AGI)
Tyler County: 1.31% Texas average: 2.83%

Top counties from which taxpayers relocated into this county between 2020 and 2021:
| from Hardin County, TX | |
| from Harris County, TX | |
| from Jefferson County, TX | |
| from Orange County, TX | |
| from Jasper County, TX | |
| from Polk County, TX | |
| from Montgomery County, TX |
7.86% of this county's 2020 resident taxpayers moved to other counties in 2021 ($36,214 average adjusted gross income)
| Here: | 7.86% |
| Texas average: | 7.40% |
10 or fewer of this county's residents moved to foreign countries.
7.35% relocated to other counties in Texas ($33,987 average AGI)
0.51% relocated to other states ($2,227 average AGI)
Tyler County: 0.51% Texas average: 2.08%

Top counties to which taxpayers relocated from this county between 2020 and 2021:
| to Hardin County, TX | |
| to Harris County, TX | |
| to Jefferson County, TX | |
| to Jasper County, TX | |
| to Angelina County, TX | |
| to Polk County, TX | |
| to Montgomery County, TX |
Births per 1000 population from 1990 to 1999: 11.6
Births per 1000 population from 2000 to 2006: 11.2

Deaths per 1000 population from 1990 to 1999: 12.6
Deaths per 1000 population from 2000 to 2009: 11.9
Deaths per 1000 population from 2010 to 2020: 12.9

Infant deaths per 1000 live births from 1990 to 1999: 10.5
Infant deaths per 1000 live births from 2000 to 2006: 10.0

Persons under 19 years old without health insurance coverage in 2018: 10.2%


Persons enrolled in hospital insurance and/or supplemental medical insurance (Medicare) in July 1, 2007: 4,119 (3,326 aged, 793 disabled)
Children under 18 without health insurance coverage in 2007: 585 (13%)


Most common underlying causes of death in Tyler County, Texas in 1999 - 2019:
- Acute myocardial infarction, unspecified (751)
- Bronchus or lung, unspecified - Malignant neoplasms (387)
- Chronic obstructive pulmonary disease, unspecified (312)
- Atherosclerotic heart disease (200)
- Unspecified dementia (124)
- Alzheimer disease, unspecified (77)
- Stroke, not specified as haemorrhage or infarction (76)
- Atherosclerotic cardiovascular disease, so described (65)
- Other forms of acute ischaemic heart disease (27)
Population without health insurance coverage in 2000: 17%
Children under 18 without health insurance coverage in 2000: 15%
Short term general hospital admissions per 100,000 population in 2004: 5,710
Short term general hospital beds per 100,000 population in 2004: 120
Emergency room visits per 100,000 population in 2004: 51,802
General practice office based MDs per 100,000 population in 2005: 1,188
Medical specialist MDs per 100,000 population in 2005: 1,363
Dentists per 100,000 population in 1998: 5
Total births per 100,000 population, July 2005 - July 2006 : 24
Total deaths per 100,000 population, July 2005 - July 2006: 29
Suicides per 1,000,000 population from 2000 to 2006: 160.6. This is more than state average.
Household type by relationship:
Households: 20,498- Male householders: 3,580 (910 living alone), Female householders: 3,618 (1,082 living alone)
3,748 spouses (3,700 opposite-sex spouses), 377 unmarried partners, (365 opposite-sex unmarried partners), 4,493 children (4,082 natural, 224 adopted, 188 stepchildren), 903 grandchildren, 190 brothers or sisters, 302 parents, 16 foster children, 552 other relatives, 549 non-relatives
- In group quarters: 2,130
Size of family households: 2,322 2-persons, 1,281 3-persons, 587 4-persons, 378 5-persons, 179 6-persons, 116 7-or-more-persons.
Size of nonfamily households: 1,993 1-person, 355 2-persons, 12 3-persons.
1,973 married couples with children.
960 single-parent households (340 men, 620 women).
93.4% of residents of Tyler speak English at home.
5.4% of residents speak Spanish at home (58% speak English very well, 25% speak English well, 8% speak English not well, 9% don't speak English at all).
0.9% of residents speak other Indo-European language at home (70% speak English very well, 21% speak English well, 9% speak English not well).
0.4% of residents speak Asian or Pacific Island language at home (45% speak English very well, 30% speak English well, 25% don't speak English at all).
In fiscal year 2004:
Federal Government expenditure: $119,421,000 ($5,740 per capita)
Department of Defense expenditure: $4,197,000
Federal direct payments to individuals for retirement and disability: $59,441,000
Federal other direct payments to individuals: $34,855,000
Federal direct payments not to individuals: $181,000
Federal grants: $20,203,000
Federal procurement contracts: $2,128,000 ($1,540,000 Department of Defense)
Federal salaries and wages: $2,613,000 ($196,000 Department of Defense)
Federal Government direct loans: $0,000
Federal guaranteed/insured loans: $1,905,000
Federal Government insurance: $9,912,000
Population change from April 1, 2000 to July 1, 2005:
Births: 1,190| Here: | 58 per 1000 residents |
| State: | 85 per 1000 residents |
Deaths: 1,328
| Here: | 64 per 1000 residents |
| State: | 35 per 1000 residents |
Net international migration: +84
| Here: | +4 per 1000 residents |
| State: | +29 per 1000 residents |
Net internal migration: -146
| Here: | |
| State: |

Total withdrawal of fresh water for public supply: 2.18 millions of gallons per day (all from ground)
| Here: | 5.3 |
| State: | 6.3 |
| Here: | 4.7 |
| State: | 4.0 |

- Year house built in Tyler County, Texas
- 812020 or later
- 9212010 to 2019
- 1,1422000 to 2009
- 1,5081990 to 1999
- 1,7781980 to 1989
- 1,7491970 to 1979
- 9431960 to 1969
- 6461950 to 1959
- 2281940 to 1949
- 3961939 or earlier

- Rooms in owner-occupied houses in Tyler County, Texas
- 541 room
- 472 rooms
- 4143 rooms
- 1,2244 rooms
- 1,5605 rooms
- 1,1106 rooms
- 5997 rooms
- 4098 rooms
- 4349+ rooms

- Rooms in renter-occupied apartments in Tyler County, Texas
- 241 room
- 862 rooms
- 1543 rooms
- 2904 rooms
- 4575 rooms
- 2596 rooms
- 647 rooms
- 38 rooms
- 189+ rooms

- Bedrooms in owner-occupied houses in Tyler County, Texas
- 60no bedroom
- 2581 bedroom
- 1,3522 bedrooms
- 3,1873 bedrooms
- 7484 bedrooms
- 1815+ bedrooms

- Bedrooms in renter-occupied apartments in Tyler County, Texas
- 24no bedroom
- 1921 bedroom
- 3812 bedrooms
- 6963 bedrooms
- 674 bedrooms
- 75+ bedrooms

- Cars and other vehicles available in Tyler County in owner-occupied houses/condos
- 269no vehicle
- 1,4821 vehicle
- 2,2762 vehicles
- 1,2903 vehicles
- 3634 vehicles
- 1425+ vehicles

- Cars and other vehicles available in Tyler County in renter-occupied apartments
- 255no vehicle
- 7111 vehicle
- 3702 vehicles
- 383 vehicles
- 04 vehicles
- 235+ vehicles
83.2% of Tyler County residents lived in the same house 1 years ago.
Out of people who lived in different houses, 23% lived in this county.
Out of people who lived in different counties, 84% lived in Texas.
| Tyler County: | 83.2% |
| State average: | 85.7% |
Place of birth for U.S.-born residents:
- This state: 15,250
- Other state: 4,548
- Northeast: 507
- Midwest: 665
- South: 2,182
- West: 1,191


- 74.9%Electricity
- 11.3%Bottled, tank, or LP gas
- 11.1%Utility gas
- 2.5%Wood

- 80.1%Electricity
- 18.6%Utility gas
- 0.9%Bottled, tank, or LP gas
- 0.4%Wood
Private vs. public school enrollment:
| Here: | 2.4% |
| Texas: | 8.8% |
| Here: | 14.5% |
| Texas: | 8.0% |
| Here: | 7.8% |
| Texas: | 16.2% |


Tyler County government finances - Expenditure in 2017:
- Charges - Other: $1,572,000
Regular Highways: $62,000
- Current Operations - Regular Highways: $3,065,000
Police Protection: $2,913,000
General - Other: $2,735,000
Housing and Community Development: $2,268,000
Judicial and Legal Services: $1,506,000
Central Staff Services: $977,000
Financial Administration: $619,000
General Public Buildings: $524,000
Public Welfare - Other: $219,000
Natural Resources - Other: $98,000
Health - Other: $78,000
Correctional Institutions: $44,000
Air Transportation: $13,000
Water Utilities: $2,000
- General - Interest on Debt: $5,000
- Long Term Debt - Beginning Outstanding - Unspecified Public Purpose: $129,000
Retired Unspecified Public Purpose: $92,000
Outstanding Unspecified Public Purpose: $37,000
- Miscellaneous - General Revenue - Other: $62,000
Interest Earnings: $34,000
Sale of Property: $16,000
- Other Capital Outlay - General - Other: $570,000
Regular Highways: $532,000
Correctional Institutions: $18,000
Police Protection: $8,000
Central Staff Services: $2,000
Health - Other: $2,000
- Other Funds - Cash and Securities: $10,147,000
- State Intergovernmental - Housing and Community Development: $2,172,000
Other: $842,000
General Local Government Support: $288,000
Highways: $62,000
Water Utilities: $3,000
- Tax - Property: $10,725,000
Motor Vehicle License: $684,000
- Total Salaries and Wages: $9,052,000
Tyler County government finances - Revenue in 2017:
- Charges - Other: $1,572,000
Regular Highways: $62,000
- Current Operations - Regular Highways: $3,065,000
Police Protection: $2,913,000
General - Other: $2,735,000
Housing and Community Development: $2,268,000
Judicial and Legal Services: $1,506,000
Central Staff Services: $977,000
Financial Administration: $619,000
General Public Buildings: $524,000
Public Welfare - Other: $219,000
Natural Resources - Other: $98,000
Health - Other: $78,000
Correctional Institutions: $44,000
Air Transportation: $13,000
Water Utilities: $2,000
- General - Interest on Debt: $5,000
- Long Term Debt - Beginning Outstanding - Unspecified Public Purpose: $129,000
Retired Unspecified Public Purpose: $92,000
Outstanding Unspecified Public Purpose: $37,000
- Miscellaneous - General Revenue - Other: $62,000
Interest Earnings: $34,000
Sale of Property: $16,000
- Other Capital Outlay - General - Other: $570,000
Regular Highways: $532,000
Correctional Institutions: $18,000
Police Protection: $8,000
Central Staff Services: $2,000
Health - Other: $2,000
- Other Funds - Cash and Securities: $10,147,000
- State Intergovernmental - Housing and Community Development: $2,172,000
Other: $842,000
General Local Government Support: $288,000
Highways: $62,000
Water Utilities: $3,000
- Tax - Property: $10,725,000
Motor Vehicle License: $684,000
- Total Salaries and Wages: $9,052,000
Tyler County government finances - Debt in 2017:
- Charges - Other: $1,572,000
Regular Highways: $62,000
- Current Operations - Regular Highways: $3,065,000
Police Protection: $2,913,000
General - Other: $2,735,000
Housing and Community Development: $2,268,000
Judicial and Legal Services: $1,506,000
Central Staff Services: $977,000
Financial Administration: $619,000
General Public Buildings: $524,000
Public Welfare - Other: $219,000
Natural Resources - Other: $98,000
Health - Other: $78,000
Correctional Institutions: $44,000
Air Transportation: $13,000
Water Utilities: $2,000
- General - Interest on Debt: $5,000
- Long Term Debt - Beginning Outstanding - Unspecified Public Purpose: $129,000
Retired Unspecified Public Purpose: $92,000
Outstanding Unspecified Public Purpose: $37,000
- Miscellaneous - General Revenue - Other: $62,000
Interest Earnings: $34,000
Sale of Property: $16,000
- Other Capital Outlay - General - Other: $570,000
Regular Highways: $532,000
Correctional Institutions: $18,000
Police Protection: $8,000
Central Staff Services: $2,000
Health - Other: $2,000
- Other Funds - Cash and Securities: $10,147,000
- State Intergovernmental - Housing and Community Development: $2,172,000
Other: $842,000
General Local Government Support: $288,000
Highways: $62,000
Water Utilities: $3,000
- Tax - Property: $10,725,000
Motor Vehicle License: $684,000
- Total Salaries and Wages: $9,052,000
Tyler County government finances - Cash and Securities in 2017:
- Charges - Other: $1,572,000
Regular Highways: $62,000
- Current Operations - Regular Highways: $3,065,000
Police Protection: $2,913,000
General - Other: $2,735,000
Housing and Community Development: $2,268,000
Judicial and Legal Services: $1,506,000
Central Staff Services: $977,000
Financial Administration: $619,000
General Public Buildings: $524,000
Public Welfare - Other: $219,000
Natural Resources - Other: $98,000
Health - Other: $78,000
Correctional Institutions: $44,000
Air Transportation: $13,000
Water Utilities: $2,000
- General - Interest on Debt: $5,000
- Long Term Debt - Beginning Outstanding - Unspecified Public Purpose: $129,000
Retired Unspecified Public Purpose: $92,000
Outstanding Unspecified Public Purpose: $37,000
- Miscellaneous - General Revenue - Other: $62,000
Interest Earnings: $34,000
Sale of Property: $16,000
- Other Capital Outlay - General - Other: $570,000
Regular Highways: $532,000
Correctional Institutions: $18,000
Police Protection: $8,000
Central Staff Services: $2,000
Health - Other: $2,000
- Other Funds - Cash and Securities: $10,147,000
- State Intergovernmental - Housing and Community Development: $2,172,000
Other: $842,000
General Local Government Support: $288,000
Highways: $62,000
Water Utilities: $3,000
- Tax - Property: $10,725,000
Motor Vehicle License: $684,000
- Total Salaries and Wages: $9,052,000
Supplemental Security Income (SSI) in 2006:
- Total number of recipients: 619
- Number of aged recipients: 68
- Number of blind and disabled recipients: 551
- Number of recipients under 18: 102
- Number of recipients between 18 and 64: 386
- Number of recipients older than 64: 131
- Number of recipients also receiving OASDI: 235
- Amount of payments (thousands of dollars): 258
| Most common first names in Tyler County, TX among deceased individuals | ||
| Name | Count | Lived (average) |
|---|---|---|
| James | 133 | 71.8 years |
| John | 129 | 76.7 years |
| William | 106 | 76.3 years |
| Mary | 93 | 79.2 years |
| Robert | 83 | 72.8 years |
| George | 52 | 72.4 years |
| Willie | 49 | 76.6 years |
| Charles | 49 | 73.9 years |
| Thomas | 38 | 76.2 years |
| Henry | 35 | 75.8 years |
| Most common last names in Tyler County, TX among deceased individuals | ||
| Last name | Count | Lived (average) |
|---|---|---|
| Smith | 67 | 74.7 years |
| Davis | 63 | 79.9 years |
| Johnson | 44 | 75.9 years |
| Williams | 44 | 76.2 years |
| Jones | 37 | 73.6 years |
| Brown | 36 | 72.6 years |
| Fortenberry | 32 | 79.1 years |
| Walker | 30 | 79.8 years |
| Dean | 29 | 78.3 years |
| Powell | 25 | 77.4 years |
Businesses in Tyler County, TX
- True Value: 1