Beavercreek: Fire Incidents, Ohio (OH)
Where are fire incidents reported in Beavercreek, OH
Something went wrong! Please refresh the page.
| Fire incidents reported | |
|---|---|
| Sreet name | Count |
| FAIRFIELD RD | 180 |
| 675 HWY | 126 |
| 675, INTERSTATE HWY | 88 |
| FAIRFIELD COMMONS | 74 |
| DAYTON XENIA RD | 72 |
| CENTRE DR | 70 |
| GRANGE HALL RD | 68 |
| KEMP RD | 66 |
| INDIAN RIPPLE RD | 64 |
| 35 RT | 50 |
| COLONEL GLENN HWY | 44 |
| BEAVER VALLEY RD | 30 |
| PATTERSON RD | 28 |
| DAYTON-XENIA RD | 26 |
| TREBEIN RD | 24 |
| PENTAGON BLVD | 22 |
| TOWNE DR | 22 |
| 35, STATE RT | 20 |
| COMMONS BLVD | 20 |
| NEW GERMANY TREBEIN RD | 20 |
| SHAKERTOWN RD | 20 |
| STONECASTLE DR | 20 |
| COUNTY LINE RD | 18 |
| LAKEVIEW DR | 16 |
| WALDEN WAY | 16 |
| CENTRAL DR | 14 |
| FACTORY RD | 14 |
| PLUM ST | 14 |
| WALNUT ST | 14 |
| CRONE RD | 12 |
| Other | 83 |
2002 - 2018 National Fire Incident Reporting System (NFIRS) incidents
- Incident types reported to NFIRS in Beavercreek, OH
- 6,20456.8%Rescue & EMS
- 1,38412.7%Hazardous Condition
- 1,35512.4%Fire
- 7446.8%Service Call
- 6616.1%Good Intent Call
- 5354.9%False Alarm
- 200.2%Overpressure Rupture
- 130.1%Severe Weather
- Fire incident types reported to NFIRS in Beavercreek, OH
- 60244.4%Outside Fires
- 42231.1%Structure Fires
- 30922.8%Mobile Property/Vehicle Fires
- 221.6%Other
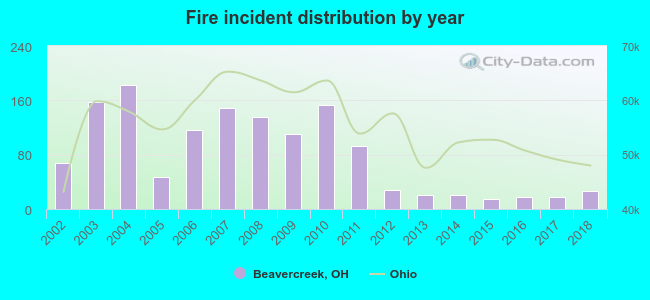 Based on the data from the years 2002 - 2018 the average number of fire incidents per year is 80. The highest number of fire incidents - 183 took place in 2004, and the least - 14 in 2015. The data has a decreasing trend.
The average number of yearly fire incidents per 10k residents in Beavercreek, OH compared to nearest cities:
(Note: Based on data for the last 3 years, including only cities with population 5,000 and above)
| Beavercreek: | 4.4 |
| Riverside: | 20.2 |
| Kettering: | 14.8 |
| Oakwood: | 46.2 |
| Fairborn: | 22.3 |
| Bellbrook: | 10.0 |
| Xenia: | 40.1 |
| Dayton: | 44.3 |
| Centerville: | 14.6 |
 The median response time based on all reported fire incidents is 6 minutes. This is similar to the state median value.
The median response time in Beavercreek, OH compared to nearest cities:
(Note: Based on data for all years, including only cities with at least 500 fire incidents)
| Beavercreek: | 6 minutes |
| Riverside: | 6 minutes |
| Kettering: | 6 minutes |
| Oakwood: | 5 minutes |
| Fairborn: | 6 minutes |
| Xenia: | 6 minutes |
| Dayton: | 5 minutes |
| Centerville: | 7 minutes |
| Huber Heights: | 6 minutes |
 Based on the data from the years 2002 - 2018 the average number of fire-related casualties per year is 3. The highest number of injuries - 10 took place in 2004, and the lowest - 0 in 2005. The data has an increasing trend.
The average number of injuries per 1,000 fires is 42. This indicator was the highest - 192 in 2018, and the lowest 0 in 2005. The trend for casualties per 1,000 fire incidents is rising. Compared to the state value the number of casualties per 1,000 incidents is much higher.
Based on the data from the years 2002 - 2018 the average number of fire-related casualties per year is 3. The highest number of injuries - 10 took place in 2004, and the lowest - 0 in 2005. The data has an increasing trend.
The average number of injuries per 1,000 fires is 42. This indicator was the highest - 192 in 2018, and the lowest 0 in 2005. The trend for casualties per 1,000 fire incidents is rising. Compared to the state value the number of casualties per 1,000 incidents is much higher.Casualties per 1,000 incidents in Beavercreek, OH compared to nearest cities:
(Note: Based on data for all years, including only cities with at least 500 fire incidents)
| Beavercreek: | 36.2 |
| Riverside: | 19.3 |
| Kettering: | 25.7 |
| Oakwood: | 2.1 |
| Fairborn: | 27.6 |
| Xenia: | 24.3 |
| Dayton: | 20.5 |
| Centerville: | 33.9 |
| Huber Heights: | 35.6 |
 26.6% incidents where reported in the morning and 73.4% in the evening. The most fires (17.2%) took place on Saturday, and the least (11.7%) on Wednesday.
 According to the 1,355 reports from years 2002 - 2018 most fires (11.6%) took place during August, and the least (5.3%) in January.
 Out of all 10,925 cases reported during the years 2002 - 2018, the most belonged to the categories: Rescue & EMS (56.8%), Hazardous Condition (12.7%), and Fire (12.4%).
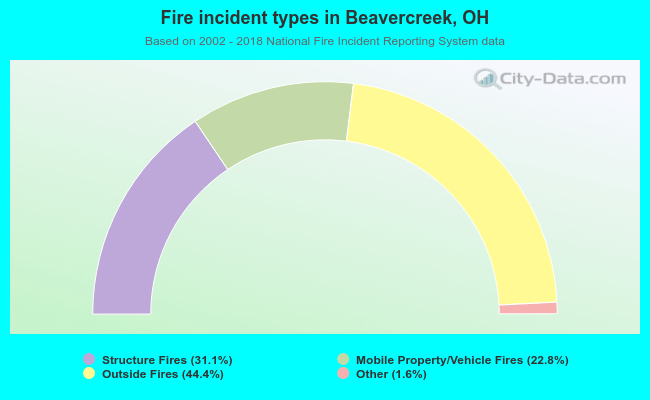 When looking into fire subcategories, the most incidents belonged to: Outside Fires (44.4%), and Structure Fires (31.1%).