Bellbrook: Fire Incidents, Ohio (OH)
Where are fire incidents reported in Bellbrook, OH
Something went wrong! Please refresh the page.
|
| |||||||||||||||||||||||||||||||||||||||||||||||||||||||||||||||||||||||||||||||||||||||||||||||||||||||||||||
2002 - 2018 National Fire Incident Reporting System (NFIRS) incidents
- Incident types reported to NFIRS in Bellbrook, OH
- 1,27340.8%Rescue & EMS
- 86027.6%Hazardous Condition
- 40412.9%Fire
- 2317.4%Good Intent Call
- 1966.3%Service Call
- 1484.7%False Alarm
- 40.1%Overpressure Rupture
- 40.1%Severe Weather
- Fire incident types reported to NFIRS in Bellbrook, OH
- 19347.8%Outside Fires
- 17342.8%Structure Fires
- 338.2%Mobile Property/Vehicle Fires
- 51.2%Other
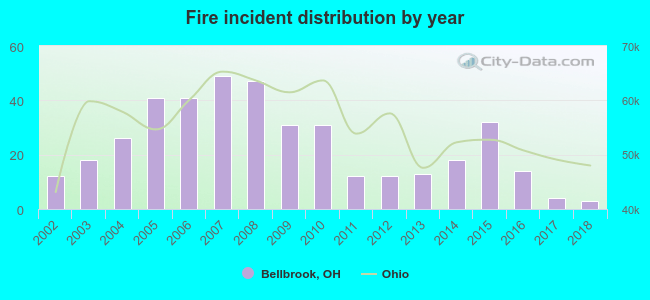 Based on the data from the years 2002 - 2018 the average number of fire incidents per year is 24. The highest number of fire incidents - 49 took place in 2007, and the least - 3 in 2018. The data has a decreasing trend.
The average number of yearly fire incidents per 10k residents in Bellbrook, OH compared to nearest cities:
(Note: Based on data for the last 3 years, including only cities with population 5,000 and above)
| Bellbrook: | 10.0 |
| Centerville: | 14.6 |
| Kettering: | 14.8 |
| Beavercreek: | 4.4 |
| Oakwood: | 46.2 |
| Moraine: | 108.9 |
| Xenia: | 40.1 |
| West Carrollton City: | 1.2 |
| Springboro: | 20.9 |

 According to the data from the years 2002 - 2018 the average number of fire-related casualties per year is 0. The highest number of reported injuries - 2 took place in 2008, and the lowest - 0 in 2002. The data has a constant trend.
 29.2% incidents where reported in the morning and 70.8% in the evening. The most fires (17.1%) took place on Sunday, and the least (10.9%) on Wednesday.
 Based on the 404 reports from years 2002 - 2018 most fires (10.1%) took place during November, and the least (4.5%) in June.
 Out of all 3,121 cases reported during the years 2002 - 2018, the most belonged to the categories: Rescue & EMS (40.8%), Hazardous Condition (27.6%), and Fire (12.9%).
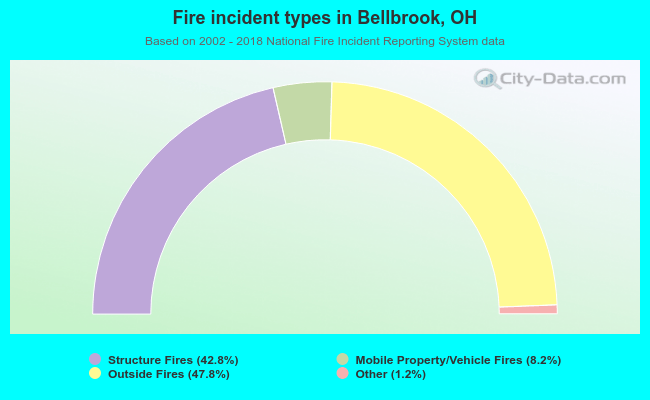 When looking into fire subcategories, the most reports belonged to: Outside Fires (47.8%), and Structure Fires (42.8%).