Belleville: Fire Incidents, New Jersey (NJ)
Where are fire incidents reported in Belleville, NJ
Something went wrong! Please refresh the page.
| Fire incidents reported | |
|---|---|
| Sreet name | Count |
| WASHINGTON AVE | 290 |
| JORALEMON ST | 142 |
| UNION AVE | 128 |
| BELLEVILLE AVE | 114 |
| FRANKLIN AVE | 112 |
| MAIN ST | 110 |
| MILL ST | 104 |
| CORTLANDT ST | 70 |
| BELMONT AVE | 62 |
| FRANKLIN ST | 62 |
| DEWITT AVE | 52 |
| PASSAIC AVE | 52 |
| BRANCH BROOK DR | 44 |
| CLARA MAASS DR | 44 |
| HECKEL ST | 44 |
| WASHINGTON | 40 |
| DIVISION AVE | 34 |
| ROUTE 21 HWY | 32 |
| STEPHENS ST | 32 |
| GREYLOCK PKY | 30 |
| HARRISON ST | 30 |
| HORNBLOWER AVE | 30 |
| WILLIAM ST | 30 |
| BEECH ST | 24 |
| FAIRWAY AVE | 24 |
| FRANKLIN | 24 |
| LITTLE ST | 24 |
| WALLACE ST | 24 |
| BELMOHR ST | 22 |
| BRIGHTON AVE | 22 |
2003 - 2018 National Fire Incident Reporting System (NFIRS) incidents
- Incident types reported to NFIRS in Belleville, NJ
- 13,94258.5%Rescue & EMS
- 3,29513.8%Hazardous Condition
- 2,44210.3%Service Call
- 1,6657.0%Fire
- 1,2345.2%False Alarm
- 1,1664.9%Good Intent Call
- 460.2%Overpressure Rupture
- Fire incident types reported to NFIRS in Belleville, NJ
- 90654.4%Structure Fires
- 48128.9%Outside Fires
- 26015.6%Mobile Property/Vehicle Fires
- 181.1%Other
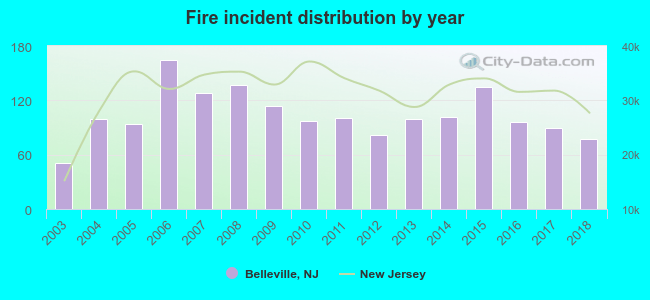 According to the data from the years 2003 - 2018 the average number of fire incidents per year is 104. The highest number of fires - 164 took place in 2006, and the least - 51 in 2003. The data has an increasing trend.
The average number of yearly fire incidents per 10k residents in Belleville, NJ compared to nearest cities:
(Note: Based on data for the last 3 years, including only cities with population 5,000 and above)
| Belleville: | 25.0 |
| North Arlington: | 24.8 |
| Bloomfield: | 31.3 |
| Nutley: | 44.0 |
| Lyndhurst: | 39.0 |
| Glen Ridge: | 15.6 |
| Kearny: | 23.8 |
| East Orange: | 48.4 |
| Harrison: | 30.8 |
 The median response time based on all reported fire incidents is 3 minutes. This is lower compared to the New Jersey median value.
The median response time in Belleville, NJ compared to nearest cities:
(Note: Based on data for all years, including only cities with at least 500 fire incidents)
| Belleville: | 3 minutes |
| Bloomfield: | 2 minutes |
| Nutley: | 2 minutes |
| Lyndhurst: | 3 minutes |
| Kearny: | 4 minutes |
| East Orange: | 4 minutes |
| Harrison: | 2 minutes |
| Montclair: | 3 minutes |
| Rutherford: | 5 minutes |
 According to the reports from the years 2003 - 2018 the average number of fire-related yearly casualties is 1. The highest number of injuries - 4 took place in 2006, and the lowest - 0 in 2003. The data has an increasing trend.
The average number of injuries per 1,000 fire incidents is 10. This indicator was the highest - 30 in 2013, and the lowest 0 in 2003. The trend for injuries per 1,000 fires is growing. Compared to the state value the number of injuries per 1,000 fires is about the same.
According to the reports from the years 2003 - 2018 the average number of fire-related yearly casualties is 1. The highest number of injuries - 4 took place in 2006, and the lowest - 0 in 2003. The data has an increasing trend.
The average number of injuries per 1,000 fire incidents is 10. This indicator was the highest - 30 in 2013, and the lowest 0 in 2003. The trend for injuries per 1,000 fires is growing. Compared to the state value the number of injuries per 1,000 fires is about the same.Casualties per 1,000 incidents in Belleville, NJ compared to nearest cities:
(Note: Based on data for all years, including only cities with at least 500 fire incidents)
| Belleville: | 10.2 |
| Bloomfield: | 9.9 |
| Nutley: | 10.7 |
| Lyndhurst: | 6.0 |
| Kearny: | 16.0 |
| East Orange: | 10.9 |
| Harrison: | 8.3 |
| Montclair: | 14.0 |
| Rutherford: | 6.0 |
 30.3% incidents where reported in the morning and 69.7% in the evening. The most fires (16.3%) took place on Friday, and the least (11.7%) on Thursday.
 According to the 1,665 fire incidents from years 2003 - 2018 most fires (10.5%) took place during January, and the least (6.7%) in September.
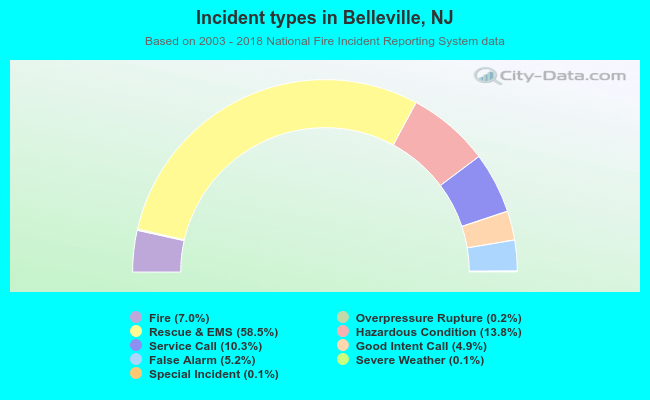 Out of all 23,824 cases reported during the years 2003 - 2018, the most belonged to the categories: Rescue & EMS (58.5%), Hazardous Condition (13.8%), and Service Call (10.3%).
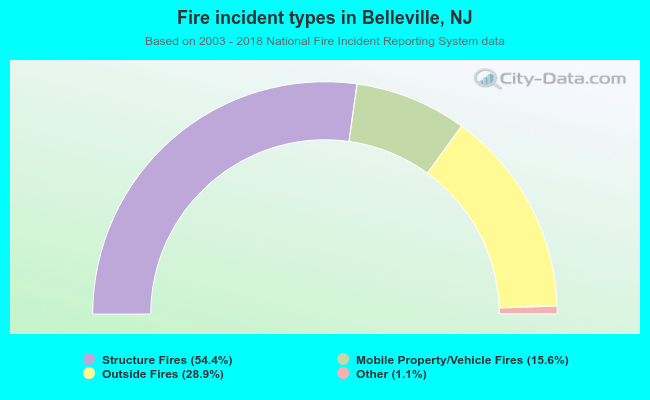 When looking into fire subcategories, the most reports belonged to: Structure Fires (54.4%), and Outside Fires (28.9%).