Lyndhurst: Fire Incidents, New Jersey (NJ)
Where are fire incidents reported in Lyndhurst, NJ
Something went wrong! Please refresh the page.
| Fire incidents reported | |
|---|---|
| Sreet name | Count |
| RIDGE RD | 280 |
| VALLEY BROOK AVE | 224 |
| STUYVESANT AVE | 178 |
| PAGE AVE | 114 |
| RIVERSIDE AVE | 102 |
| NEW YORK AVE | 90 |
| WALL ST | 64 |
| KINGSLAND AVE | 44 |
| FERN AVE | 40 |
| LAKE AVE | 40 |
| FOREST AVE | 36 |
| POST AVE | 34 |
| PARK AVE | 32 |
| POLITO AVE | 32 |
| CHASE AVE | 30 |
| COPELAND AVE | 28 |
| SECOND AVE | 28 |
| LEWANDOWSKI ST | 26 |
| NEW JERSEY TURNPIKE | 24 |
| ORIENT WAY | 24 |
| TRAVERS PL | 24 |
| VALLYBROOK AVE | 24 |
| CHUBB AVE | 22 |
| DELAFIELD AVE | 22 |
| ORIENTAL PL | 22 |
| GRANT AVE | 20 |
| JEROME AVE | 20 |
| NEW YORK AVE | 20 |
| LIVINGSTON AVE | 18 |
| NEWARK AVE AVE | 16 |
2004 - 2018 National Fire Incident Reporting System (NFIRS) incidents
- Incident types reported to NFIRS in Lyndhurst, NJ
- 1,16134.8%Fire
- 94828.4%Hazardous Condition
- 81024.3%False Alarm
- 2347.0%Service Call
- 842.5%Good Intent Call
- 742.2%Rescue & EMS
- 170.5%Overpressure Rupture
- 100.3%Special Incident
- Fire incident types reported to NFIRS in Lyndhurst, NJ
- 68559.0%Structure Fires
- 30626.4%Outside Fires
- 11610.0%Mobile Property/Vehicle Fires
- 544.7%Other
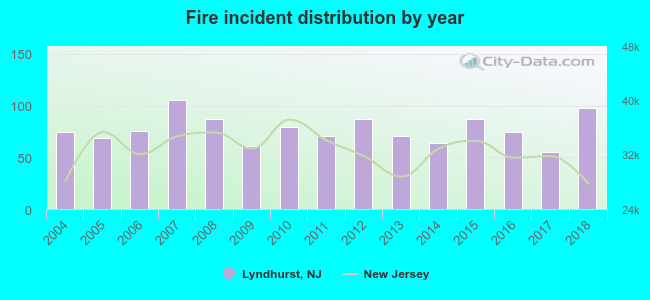 According to the data from the years 2004 - 2018 the average number of fires per year is 77. The highest number of reported fire incidents - 105 took place in 2007, and the least - 55 in 2017. The data has a rising trend.
The average number of yearly fire incidents per 10k residents in Lyndhurst, NJ compared to nearest cities:
(Note: Based on data for the last 3 years, including only cities with population 5,000 and above)
| Lyndhurst: | 39.0 |
| North Arlington: | 24.8 |
| Rutherford: | 45.3 |
| East Rutherford: | 192.9 |
| Nutley: | 44.0 |
| Belleville: | 25.0 |
| Carlstadt: | 56.0 |
| Wallington: | 24.1 |
| Kearny: | 23.8 |
 The median response time based on all reported fire incidents is 3 minutes. This is lower compared to the New Jersey median value.
The median response time in Lyndhurst, NJ compared to nearest cities:
(Note: Based on data for all years, including only cities with at least 500 fire incidents)
| Lyndhurst: | 3 minutes |
| Rutherford: | 5 minutes |
| East Rutherford: | 2 minutes |
| Nutley: | 2 minutes |
| Belleville: | 3 minutes |
| Kearny: | 4 minutes |
| Secaucus: | 4 minutes |
| Passaic: | 4 minutes |
| Bloomfield: | 2 minutes |
 According to the reports from the years 2004 - 2018 the average number of fire-related yearly casualties is 0. The highest number of casualties - 3 took place in 2015, and the lowest - 0 in 2004. The data has a constant trend.
The average number of casualties per 1,000 fire incidents is 6. This indicator was the highest - 34 in 2015, and the lowest 0 in 2004. The trend for injuries per 1,000 incidents is rising. Compared to the New Jersey value the number of injuries per 1,000 fires is lower.
According to the reports from the years 2004 - 2018 the average number of fire-related yearly casualties is 0. The highest number of casualties - 3 took place in 2015, and the lowest - 0 in 2004. The data has a constant trend.
The average number of casualties per 1,000 fire incidents is 6. This indicator was the highest - 34 in 2015, and the lowest 0 in 2004. The trend for injuries per 1,000 incidents is rising. Compared to the New Jersey value the number of injuries per 1,000 fires is lower.Casualties per 1,000 incidents in Lyndhurst, NJ compared to nearest cities:
(Note: Based on data for all years, including only cities with at least 500 fire incidents)
| Lyndhurst: | 6.0 |
| Rutherford: | 6.0 |
| East Rutherford: | 6.9 |
| Nutley: | 10.7 |
| Belleville: | 10.2 |
| Kearny: | 16.0 |
| Secaucus: | 5.0 |
| Passaic: | 3.3 |
| Bloomfield: | 9.9 |
 31.0% incidents where reported in the morning and 69.0% in the evening. The most fires (15.8%) took place on Monday, and the least (13.3%) on Friday.
 According to the 1,161 fire incident reports from years 2004 - 2018 most fires (10.7%) took place during April, and the least (5.9%) in October.
 Out of all 3,340 cases reported during the years 2004 - 2018, the most belonged to the categories: Fire (34.8%), Hazardous Condition (28.4%), and False Alarm (24.3%).
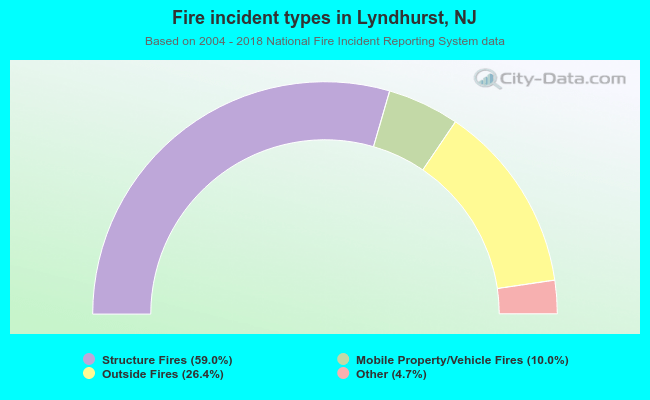 When looking into fire subcategories, the most reports belonged to: Structure Fires (59.0%), and Outside Fires (26.4%).