Cuyahoga Falls: Fire Incidents, Ohio (OH)
Where are fire incidents reported in Cuyahoga Falls, OH
Something went wrong! Please refresh the page.
| Fire incidents reported | |
|---|---|
| Sreet name | Count |
| STATE RD | 310 |
| 2ND ST | 200 |
| FRONT ST | 166 |
| WINTER PW | 164 |
| BAILEY RD | 156 |
| HOWE AV | 148 |
| CATHEDRAL LN | 132 |
| GRAHAM RD | 116 |
| PRANGE DR | 114 |
| AMERICANA DR | 100 |
| PORTAGE TR | 94 |
| ACKERMAN EX | 82 |
| MUNROE FALLS AV | 76 |
| 4TH ST | 70 |
| BATH RD | 64 |
| STEELS CORNERS RD | 64 |
| 23RD ST | 62 |
| WYOGA LAKE RD | 62 |
| TALLMADGE RD | 54 |
| BROAD BD | 52 |
| 9TH ST | 50 |
| 6TH ST | 48 |
| MAIN ST | 48 |
| HARDMAN DR | 46 |
| 3RD ST | 42 |
| NORTHAMPTON RD | 42 |
| HIGH ST | 40 |
| 8TH ST | 34 |
| OAKWOOD DR | 32 |
| BROADWAY | 30 |
2002 - 2018 National Fire Incident Reporting System (NFIRS) incidents
- Incident types reported to NFIRS in Cuyahoga Falls, OH
- 28,41164.6%Rescue & EMS
- 4,78710.9%Service Call
- 2,7516.3%False Alarm
- 2,6806.1%Hazardous Condition
- 2,5625.8%Fire
- 2,3935.4%Good Intent Call
- 2800.6%Special Incident
- 870.2%Overpressure Rupture
- 530.1%Severe Weather
- Fire incident types reported to NFIRS in Cuyahoga Falls, OH
- 1,39654.5%Structure Fires
- 77230.1%Outside Fires
- 38114.9%Mobile Property/Vehicle Fires
- 130.5%Other
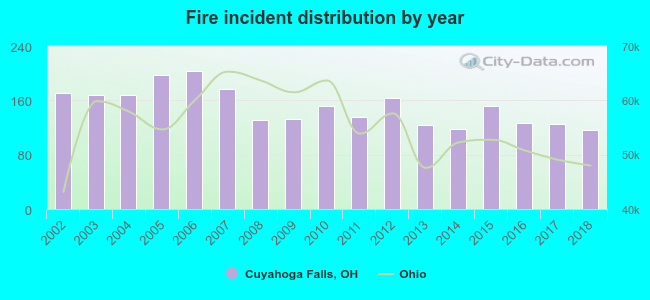 According to the data from the years 2002 - 2018 the average number of fires per year is 151. The highest number of reported fire incidents - 203 took place in 2006, and the least - 117 in 2018. The data has a dropping trend.
The average number of yearly fire incidents per 10k residents in Cuyahoga Falls, OH compared to nearest cities:
(Note: Based on data for the last 3 years, including only cities with population 5,000 and above)
| Cuyahoga Falls: | 24.9 |
| Munroe Falls: | 12.6 |
| Stow: | 18.6 |
| Tallmadge: | 28.1 |
| Akron: | 43.8 |
| Fairlawn: | 48.5 |
| Kent: | 26.5 |
| Hudson: | 12.2 |
| Streetsboro: | 35.3 |
 The median response time based on all reported fire incidents is 4 minutes. This is lower compared to the state median value.
The median response time in Cuyahoga Falls, OH compared to nearest cities:
(Note: Based on data for all years, including only cities with at least 500 fire incidents)
| Cuyahoga Falls: | 4 minutes |
| Stow: | 5 minutes |
| Tallmadge: | 5 minutes |
| Akron: | 5 minutes |
| Fairlawn: | 4 minutes |
| Kent: | 6 minutes |
| Hudson: | 6 minutes |
| Mogadore: | 6 minutes |
| Brimfield: | 6 minutes |
 According to the data from the years 2002 - 2018 the average number of fire-related yearly deaths is 0. The highest number of deaths - 2 took place in 2006, and the lowest - 0 in 2002. The data has a constant trend.
The average number of deaths per 1,000 fires is 3. This indicator was the highest - 10 in 2006, and the lowest 0 in 2002. The trend for fatalities per 1,000 fires is constant. Compared to the Ohio value the number of fatalities per 1,000 fires is higher.
According to the data from the years 2002 - 2018 the average number of fire-related yearly deaths is 0. The highest number of deaths - 2 took place in 2006, and the lowest - 0 in 2002. The data has a constant trend.
The average number of deaths per 1,000 fires is 3. This indicator was the highest - 10 in 2006, and the lowest 0 in 2002. The trend for fatalities per 1,000 fires is constant. Compared to the Ohio value the number of fatalities per 1,000 fires is higher.
 According to the reports from the years 2002 - 2018 the average number of fire-related casualties per year is 6. The highest number of reported injuries - 20 took place in 2006, and the lowest - 1 in 2009. The data has a declining trend.
The average number of injuries per 1,000 fire incidents is 38. This indicator was the highest - 99 in 2006, and the lowest 8 in 2009. The trend for injuries per 1,000 incidents is dropping. Compared to the state value the number of casualties per 1,000 fires is much higher.
According to the reports from the years 2002 - 2018 the average number of fire-related casualties per year is 6. The highest number of reported injuries - 20 took place in 2006, and the lowest - 1 in 2009. The data has a declining trend.
The average number of injuries per 1,000 fire incidents is 38. This indicator was the highest - 99 in 2006, and the lowest 8 in 2009. The trend for injuries per 1,000 incidents is dropping. Compared to the state value the number of casualties per 1,000 fires is much higher.
 29.2% incidents where reported in the morning and 70.8% in the evening. The most fires (16.6%) took place on Sunday, and the least (12.8%) on Tuesday.
 Based on the 2,562 incident reports from years 2002 - 2018 most fires (11.3%) took place during May, and the least (6.2%) in February.
 Out of all 44,004 cases reported during the years 2002 - 2018, the most belonged to the categories: Rescue & EMS (64.6%), Service Call (10.9%), and False Alarm (6.3%).
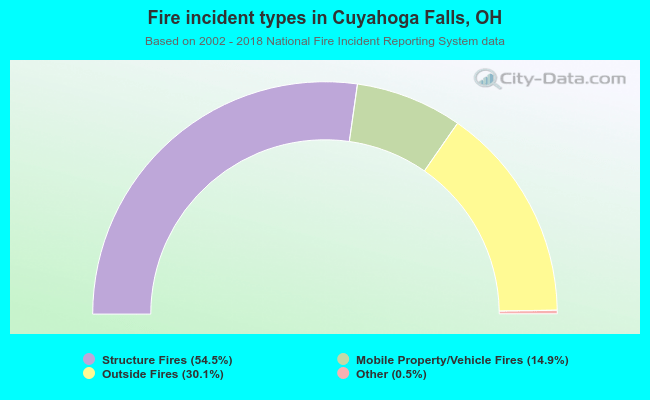 When looking into fire subcategories, the most incidents belonged to: Structure Fires (54.5%), and Outside Fires (30.1%).