Ravenna: Fire Incidents, Ohio (OH)
Where are fire incidents reported in Ravenna, OH
Something went wrong! Please refresh the page.
| Fire incidents reported | |
|---|---|
| Sreet name | Count |
| STATE ROUTE 59 | 216 |
| CLEVELAND | 134 |
| MAIN ST | 106 |
| W MAIN ST | 102 |
| CLEVELAND RD | 82 |
| WALL | 82 |
| STATE ROUTE 14 | 80 |
| CHESTNUT ST | 78 |
| N CHESTNUT ST | 74 |
| E MAIN ST | 70 |
| S PROSPECT ST | 70 |
| ST RT 5 | 66 |
| STATE ROUTE 88 | 66 |
| HENDERSON | 60 |
| NEWTON FALLS RD | 52 |
| SUMMIT | 52 |
| PECK | 50 |
| INFIRMARY | 48 |
| PROSPECT | 46 |
| CLEVELAND RD | 42 |
| LOVERS LANE | 42 |
| NEWTON FALLS | 40 |
| ST RT 59 | 40 |
| STATE ROUTE 5 | 40 |
| BRADY LAKE | 38 |
| WALNUT ST | 36 |
| ST RT 303 | 34 |
| FAIRFIELD | 32 |
| HILL | 32 |
| NEW MILFORD | 30 |
| Other | 1,318 |
2002 - 2018 National Fire Incident Reporting System (NFIRS) incidents
- Incident types reported to NFIRS in Ravenna, OH
- 17,23364.4%Rescue & EMS
- 3,25812.2%Fire
- 2,6199.8%Hazardous Condition
- 1,3275.0%Service Call
- 1,0874.1%False Alarm
- 8973.4%Good Intent Call
- 1640.6%Severe Weather
- 1220.5%Special Incident
- 480.2%Overpressure Rupture
- Fire incident types reported to NFIRS in Ravenna, OH
- 1,82656.0%Structure Fires
- 1,02131.3%Outside Fires
- 34410.6%Mobile Property/Vehicle Fires
- 672.1%Other
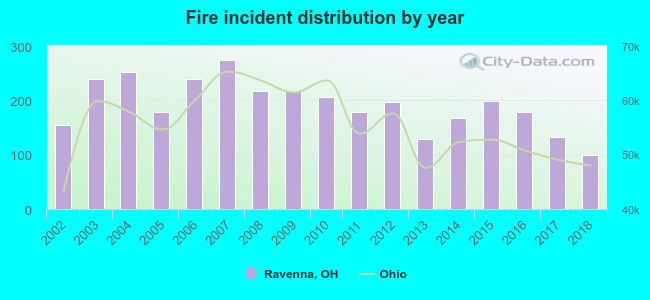 Based on the data from the years 2002 - 2018 the average number of fires per year is 192. The highest number of reported fires - 274 took place in 2007, and the least - 99 in 2018. The data has a dropping trend.
The average number of yearly fire incidents per 10k residents in Ravenna, OH compared to nearest cities:
(Note: Based on data for the last 3 years, including only cities with population 5,000 and above)
| Ravenna: | 117.4 |
| Kent: | 26.5 |
| Streetsboro: | 35.3 |
| Stow: | 18.6 |
| Munroe Falls: | 12.6 |
| Tallmadge: | 28.1 |
| Hudson: | 12.2 |
| Aurora: | 19.9 |
| Cuyahoga Falls: | 24.9 |
 The median response time based on all reported fire incidents is 7 minutes. This is about the same as the Ohio median value.
The median response time in Ravenna, OH compared to nearest cities:
(Note: Based on data for all years, including only cities with at least 500 fire incidents)
| Ravenna: | 7 minutes |
| Kent: | 6 minutes |
| Brimfield: | 6 minutes |
| Streetsboro: | 6 minutes |
| Mantua: | 9 minutes |
| Stow: | 5 minutes |
| Atwater: | 11 minutes |
| Tallmadge: | 5 minutes |
| Mogadore: | 6 minutes |
 Based on the data from the years 2002 - 2018 the average number of fire-related yearly deaths is 0. The highest number of deaths - 2 took place in 2010, and the lowest - 0 in 2002. The data has a constant trend.
The average number of deaths per 1,000 fire incidents is 1. This indicator was the highest - 10 in 2010, and the lowest 0 in 2002. The trend for deaths per 1,000 fire incidents is constant. Compared to the Ohio value the number of fatalities per 1,000 fires is lower.
Based on the data from the years 2002 - 2018 the average number of fire-related yearly deaths is 0. The highest number of deaths - 2 took place in 2010, and the lowest - 0 in 2002. The data has a constant trend.
The average number of deaths per 1,000 fire incidents is 1. This indicator was the highest - 10 in 2010, and the lowest 0 in 2002. The trend for deaths per 1,000 fire incidents is constant. Compared to the Ohio value the number of fatalities per 1,000 fires is lower.Deaths per 1,000 incidents in Ravenna, OH compared to nearest cities:
(Note: Based on data for all years, including only cities with at least 2,500 fire incidents)
| Ravenna: | 1.2 |
| Cuyahoga Falls: | 2.7 |
| Akron: | 2.8 |
| Alliance: | 1.9 |
| Warren: | 5.2 |
 According to the data from the years 2002 - 2018 the average number of fire-related yearly casualties is 3. The highest number of casualties - 6 took place in 2003, and the lowest - 1 in 2009. The data has a decreasing trend.
The average number of casualties per 1,000 fire incidents is 13. This indicator was the highest - 25 in 2003, and the lowest 5 in 2009. The trend for injuries per 1,000 fire incidents is decreasing. Compared to the Ohio value the number of injuries per 1,000 fire incidents is about the same.
According to the data from the years 2002 - 2018 the average number of fire-related yearly casualties is 3. The highest number of casualties - 6 took place in 2003, and the lowest - 1 in 2009. The data has a decreasing trend.
The average number of casualties per 1,000 fire incidents is 13. This indicator was the highest - 25 in 2003, and the lowest 5 in 2009. The trend for injuries per 1,000 fire incidents is decreasing. Compared to the Ohio value the number of injuries per 1,000 fire incidents is about the same.
 34.3% incidents where reported in the morning and 65.7% in the evening. The most fires (15.6%) took place on Tuesday, and the least (13.3%) on Wednesday.
 According to the 3,258 fire incidents from years 2002 - 2018 most fires (12.1%) took place during April, and the least (5.9%) in February.
 Out of all 26,755 cases reported during the years 2002 - 2018, the most belonged to the categories: Rescue & EMS (64.4%), Fire (12.2%), and Hazardous Condition (9.8%).
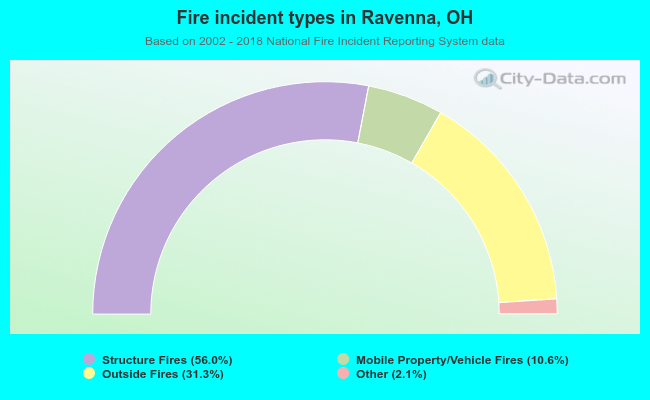 When looking into fire subcategories, the most reports belonged to: Structure Fires (56.0%), and Outside Fires (31.3%).