Housing density: 2,830 houses/condos per square mile
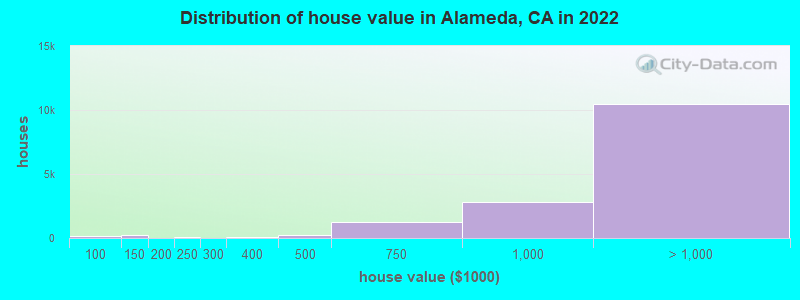
Median price asked for vacant for-sale houses and condos in 2022: $544,971.
Median contract rent in 2022: over $2,000 (lower quartile is $1,424, upper quartile is over $2,000)
Median rent asked for vacant for-rent units in 2022: $1,736
Median gross rent in Alameda, CA in 2022: over $2,000
Housing units in Alameda with a mortgage: 9,029 (1,027 second mortgage, 0 home equity loan, 985 both second mortgage and home equity loan) Houses without a mortgage: 139
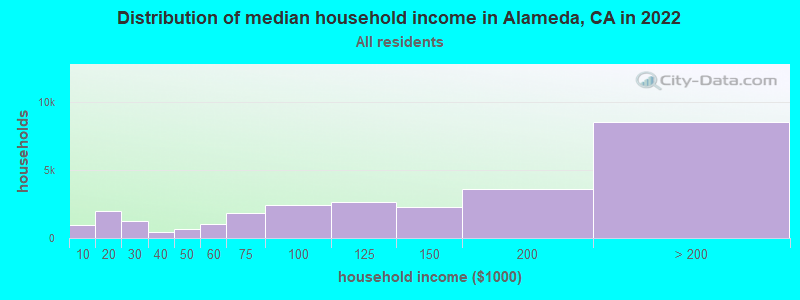
Median household income for houses/condos with a mortgage: $195,755
Median household income for apartments without a mortgage: $138,433
11,712 married couples with children.
2,862 single-parent households (492 men, 2,370 women).
66.3% of residents of Alameda speak English at home.
5.6% of residents speak Spanish at home (73% speak English very well, 16% speak English well, 9% speak English not well, 2% don't speak English at all).
6.7% of residents speak other Indo-European language at home (82% speak English very well, 13% speak English well, 4% speak English not well, 1% don't speak English at all).
20.4% of residents speak Asian or Pacific Island language at home (59% speak English very well, 21% speak English well, 14% speak English not well, 6% don't speak English at all).
1.2% of residents speak other language at home (56% speak English very well, 29% speak English well, 14% speak English not well).
Foreign born population: 21,561 (28.4%)
(70.2% of them are naturalized citizens)
Percentage of workers working in this county: 77.9% Number of people working at home: 12,558 (31.3% of all workers)
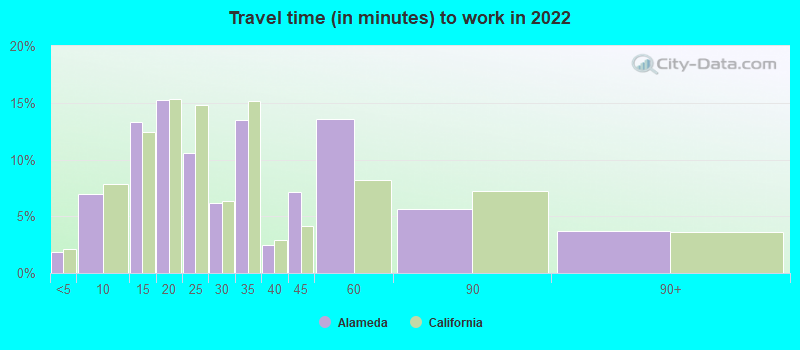
Travel time to work (commute)
Less than 5 minutes: 102
5 to 9 minutes: 1,985
10 to 14 minutes: 2,805
15 to 19 minutes: 2,500
20 to 24 minutes: 4,180
25 to 29 minutes: 955
30 to 34 minutes: 3,322
35 to 39 minutes: 977
40 to 44 minutes: 1,091
45 to 59 minutes: 2,834
60 to 89 minutes: 3,366
90 or more minutes: 706
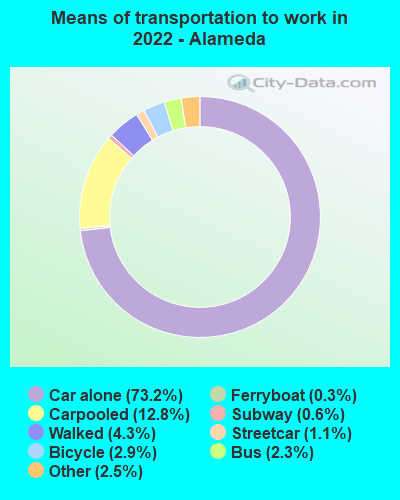
Means of transportation to work:
Drove a car alone: 18,958 (50.3%)
Carpooled: 3,463 (9.2%)
Bus: 492 (1.3%)
Subway or elevated rail: 219 (0.6%)
Long-distance train or commuter rail: 131 (0.3%)
Light rail, streetcar or trolley: 10 (0.0%)
Ferryboat: 159 (0.4%)
Taxi: 691 (1.8%)
Bicycle: 817 (2.2%)
Walked: 1,109 (2.9%)
Worked at home: 12,558 (33.3%)
Unemployment by race in 2022
Unemployment rate for White non-Hispanic residents
5.0%Males
0.9%Females
Unemployment rate for Black residents
9.5%Males
6.3%Females
Unemployment rate for American Indian and Alaska Native residents
14.6%Females
Unemployment rate for Asian residents
10.5%Males
1.0%Females
Unemployment rate for other race residents
4.9%Males
1.2%Females
Unemployment rate for two or more race residents
2.9%Males
3.2%Females
Unemployment rate for Hispanic or Latino residents
8.5%Males
6.0%Females
Year of entry for the foreign-born population in Alameda, California
4,8682010 or later
3,2942000 to 2009
3,9691990 to 1999
5,7101980 to 1989
2,9141970 to 1979
3,266Before 1970
First ancestries reported:
European: 1,797 (4.5%)
English: 1,565 (3.9%)
Irish: 1,243 (3.1%)
American: 1,100 (2.7%)
German: 886 (2.2%)
Italian: 861 (2.1%)
Afghan: 832 (2.1%)
Norwegian: 451 (1.1%)
French: 335 (0.8%)
Ethiopian: 318 (0.8%)
Swedish: 313 (0.8%)
African: 260 (0.6%)
Scottish: 235 (0.6%)
Polish: 229 (0.6%)
Iranian: 206 (0.5%)
Russian: 184 (0.5%)
Dutch: 142 (0.4%)
Scotch-Irish: 137 (0.3%)
Scandinavian: 137 (0.3%)
British: 123 (0.3%)
Eastern European: 121 (0.3%)
French Canadian: 100 (0.2%)
Greek: 82 (0.2%)
Turkish: 82 (0.2%)
Portuguese: 78 (0.2%)
Northern European: 72 (0.2%)
Serbian: 54 (0.1%)
Bulgarian: 48 (0.1%)
Hungarian: 48 (0.1%)
Danish: 47 (0.1%)
Romanian: 46 (0.1%)
Lithuanian: 45 (0.1%)
Ukrainian: 45 (0.1%)
Egyptian: 40 (0.10%)
Swiss: 38 (0.09%)
Lebanese: 36 (0.09%)
Yugoslavian: 35 (0.09%)
Canadian: 33 (0.08%)
Armenian: 30 (0.07%)
South African: 29 (0.07%)
Slovak: 28 (0.07%)
Czech: 28 (0.07%)
Croatian: 25 (0.06%)
Trinidadian and Tobagonian: 24 (0.06%)
Brazilian: 22 (0.05%)
Barbadian: 22 (0.05%)
Finnish: 21 (0.05%)
Estonian: 20 (0.05%)
Icelander: 16 (0.04%)
Belgian: 16 (0.04%)
Czechoslovakian: 13 (0.03%)
Palestinian: 12 (0.03%)
Cape Verdean: 12 (0.03%)
Slavic: 10 (0.02%)
Nigerian: 8 (0.02%)
Basque: 7 (0.02%)
Welsh: 7 (0.02%)
New Zealander: 4 (0.01%)
Most common places of birth for foreign-born residents (%):
China, excluding Hong Kong and Taiwan
Alameda:
18.1% (3,510)
California:
6.6% (684,672)
Philippines
Alameda:
14.7% (2,838)
California:
7.8% (818,297)
Vietnam
Alameda:
6.9% (1,345)
California:
4.9% (512,335)
Hong Kong
Alameda:
6.6% (1,280)
California:
1.0% (105,215)
India
Alameda:
5.3% (1,026)
California:
5.2% (539,184)
Korea
Alameda:
4.9% (941)
California:
3.0% (315,248)
Mexico
Alameda:
4.5% (862)
California:
37.2% (3,881,193)
Afghanistan
Alameda:
4.2% (807)
California:
0.5% (53,260)
Nepal
Alameda:
2.9% (567)
California:
0.2% (16,541)
Other Eastern Asia
Alameda:
1.8% (357)
California:
0.0% (5,043)
Place of birth for U.S.-born residents:
This state: 38,164
Other state: 14,575
Northeast: 5,281
Midwest: 3,230
South: 3,119
West: 2,945
86.7% of Alameda residents lived in the same house 1 years ago. Out of people who lived in different houses, 36.8% lived in this county. Out of people who lived in different counties, 70.6% lived in California.
Alameda:
86.7%
State average:
88.9%
Education attainment for males 25 years and older:
No schooling: 386
Nursery to 4th grade: 55
5th and 6th grade: 0
7th and 8th grade: 542
9th grade: 0
10th grade: 0
11th grade: 142
12th grade, no diploma: 1,220
High school graduate (or equivalency): 3,420
Less than 1 year of college: 876
Some college more than 1 year, no degree: 2,568
Associate degree: 1,096
Bachelor's degree: 9,868
Master's degree: 3,582
Professional school degree: 1,773
Doctorate degree: 782
Education attainment for females 25 years and older:
No schooling: 1,200
Nursery to 4th grade: 261
5th and 6th grade: 498
7th and 8th grade: 494
9th grade: 0
10th grade: 364
11th grade: 192
12th grade, no diploma: 836
High school graduate (or equivalency): 1,956
Less than 1 year of college: 1,214
Some college more than 1 year, no degree: 3,712
Associate degree: 2,408
Bachelor's degree: 8,419
Master's degree: 5,402
Professional school degree: 1,089
Doctorate degree: 922
Housing units in structures:
One, detached: 12,684
One, attached: 3,262
Two: 2,246
3 or 4: 2,969
5 to 9: 1,438
10 to 19: 1,418
20 to 49: 2,332
50 or more: 3,817
Mobile homes: 147
Boats, RVs, vans, etc.: 240
Housing units lacking complete plumbing facilities in 2022: 0.7%
Housing units lacking complete kitchen facilities in 2022: 0.3%
House/condo owner moved in on average 14 years ago