Housing density: 2,472 houses/condos per square mile
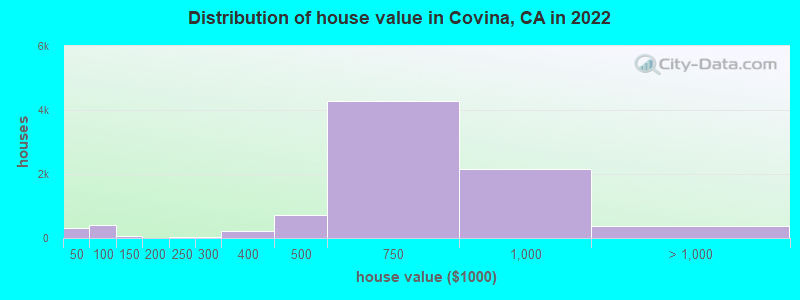
Median price asked for vacant for-sale houses and condos in 2022: $477,051.
Median contract rent in 2022: $1,672 (lower quartile is $1,343, upper quartile is $1,991)
Median rent asked for vacant for-rent units in 2022: $2,254
Median gross rent in Covina, CA in 2022: $1,777
Housing units in Covina with a mortgage: 6,399 (516 second mortgage, 10 home equity loan, 425 both second mortgage and home equity loan) Houses without a mortgage: 162
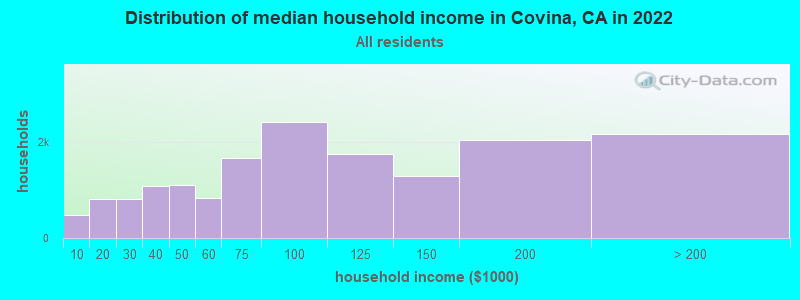
Median household income for houses/condos with a mortgage: $131,644
Median household income for apartments without a mortgage: $87,407
5,614 married couples with children.
2,584 single-parent households (633 men, 1,951 women).
51.0% of residents of Covina speak English at home.
36.4% of residents speak Spanish at home (73% speak English very well, 13% speak English well, 10% speak English not well, 4% don't speak English at all).
0.6% of residents speak other Indo-European language at home (83% speak English very well, 13% speak English well, 4% speak English not well).
10.8% of residents speak Asian or Pacific Island language at home (58% speak English very well, 23% speak English well, 15% speak English not well, 5% don't speak English at all).
1.0% of residents speak other language at home (53% speak English very well, 41% speak English well, 2% speak English not well, 4% don't speak English at all).
Foreign born population: 12,125 (24.4%)
(69.3% of them are naturalized citizens)
Percentage of workers working in this county: 87.9% Number of people working at home: 3,864 (14.6% of all workers)
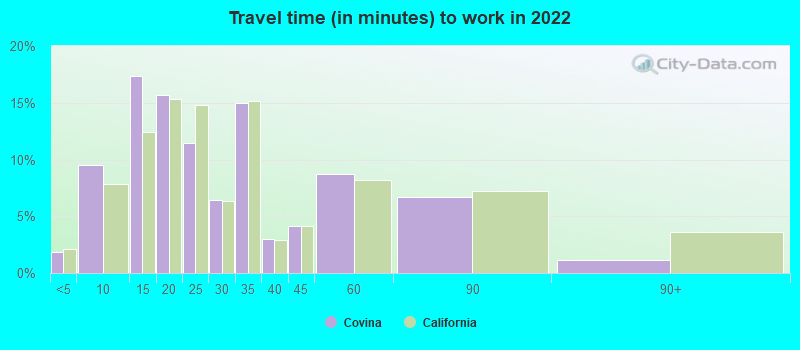
Travel time to work (commute)
Less than 5 minutes: 379
5 to 9 minutes: 1,565
10 to 14 minutes: 2,505
15 to 19 minutes: 2,509
20 to 24 minutes: 3,275
25 to 29 minutes: 1,198
30 to 34 minutes: 3,431
35 to 39 minutes: 491
40 to 44 minutes: 1,569
45 to 59 minutes: 2,256
60 to 89 minutes: 2,405
90 or more minutes: 782
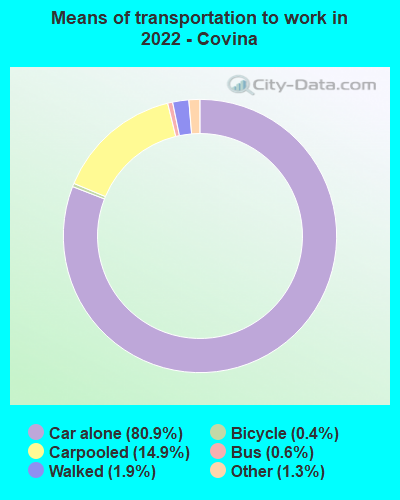
Means of transportation to work:
Drove a car alone: 16,112 (67.1%)
Carpooled: 3,290 (13.7%)
Bus: 101 (0.4%)
Long-distance train or commuter rail: 5 (0.0%)
Taxi: 278 (1.2%)
Bicycle: 78 (0.3%)
Walked: 412 (1.7%)
Worked at home: 3,864 (16.1%)
Unemployment by race in 2022
Unemployment rate for White non-Hispanic residents
6.4%Males
8.4%Females
Unemployment rate for Black residents
10.6%Males
3.9%Females
Unemployment rate for American Indian and Alaska Native residents
3.7%Females
Unemployment rate for Asian residents
0.8%Males
1.0%Females
Unemployment rate for other race residents
4.5%Males
6.9%Females
Unemployment rate for two or more race residents
4.8%Males
4.4%Females
Unemployment rate for Hispanic or Latino residents
4.0%Males
6.2%Females
Year of entry for the foreign-born population in Covina, California
1,9362010 or later
2,2602000 to 2009
2,2551990 to 1999
2,9161980 to 1989
1,8711970 to 1979
1,992Before 1970
First ancestries reported:
English: 735 (2.4%)
German: 443 (1.4%)
Italian: 350 (1.1%)
American: 326 (1.1%)
Irish: 291 (0.9%)
European: 199 (0.6%)
Lebanese: 167 (0.5%)
Egyptian: 92 (0.3%)
Arab: 86 (0.3%)
Russian: 67 (0.2%)
Polish: 62 (0.2%)
French: 56 (0.2%)
Scotch-Irish: 54 (0.2%)
African: 53 (0.2%)
Scottish: 52 (0.2%)
Nigerian: 52 (0.2%)
British West Indian: 50 (0.2%)
Kenyan: 41 (0.1%)
Danish: 40 (0.1%)
Dutch: 39 (0.1%)
Scandinavian: 38 (0.1%)
Basque: 37 (0.1%)
Norwegian: 37 (0.1%)
Ukrainian: 37 (0.1%)
Turkish: 34 (0.1%)
French Canadian: 32 (0.1%)
Ethiopian: 30 (0.10%)
Portuguese: 28 (0.09%)
Eastern European: 27 (0.09%)
Croatian: 26 (0.08%)
Armenian: 25 (0.08%)
Brazilian: 22 (0.07%)
British: 16 (0.05%)
Syrian: 15 (0.05%)
Pennsylvania German: 13 (0.04%)
Iranian: 11 (0.04%)
Greek: 11 (0.04%)
Welsh: 11 (0.04%)
Palestinian: 9 (0.03%)
Swedish: 9 (0.03%)
Haitian: 8 (0.03%)
Jamaican: 6 (0.02%)
Slovak: 5 (0.02%)
Canadian: 2 (0.01%)
Most common places of birth for foreign-born residents (%):
Mexico
Covina:
39.2% (4,755)
California:
37.2% (3,881,193)
Philippines
Covina:
12.5% (1,521)
California:
7.8% (818,297)
China, excluding Hong Kong and Taiwan
Covina:
10.4% (1,257)
California:
6.6% (684,672)
El Salvador
Covina:
6.2% (747)
California:
4.2% (440,287)
Vietnam
Covina:
3.4% (415)
California:
4.9% (512,335)
Guatemala
Covina:
3.2% (384)
California:
2.8% (290,436)
Hong Kong
Covina:
2.8% (340)
California:
1.0% (105,215)
Nicaragua
Covina:
2.0% (246)
California:
0.6% (58,161)
Burma (Myanmar)
Covina:
1.8% (219)
California:
0.3% (28,176)
Taiwan
Covina:
1.6% (199)
California:
1.7% (176,274)
Place of birth for U.S.-born residents:
This state: 32,945
Other state: 4,147
Northeast: 786
Midwest: 1,341
South: 1,116
West: 859
91.5% of Covina residents lived in the same house 1 years ago. Out of people who lived in different houses, 44.4% lived in this county. Out of people who lived in different counties, 74.9% lived in California.
Covina:
91.5%
State average:
88.9%
Education attainment for males 25 years and older:
No schooling: 435
Nursery to 4th grade: 239
5th and 6th grade: 293
7th and 8th grade: 179
9th grade: 141
10th grade: 78
11th grade: 259
12th grade, no diploma: 766
High school graduate (or equivalency): 5,179
Less than 1 year of college: 1,297
Some college more than 1 year, no degree: 2,736
Associate degree: 1,544
Bachelor's degree: 3,296
Master's degree: 708
Professional school degree: 207
Doctorate degree: 185
Education attainment for females 25 years and older:
No schooling: 411
Nursery to 4th grade: 69
5th and 6th grade: 304
7th and 8th grade: 235
9th grade: 155
10th grade: 164
11th grade: 221
12th grade, no diploma: 474
High school graduate (or equivalency): 4,377
Less than 1 year of college: 1,403
Some college more than 1 year, no degree: 2,926
Associate degree: 1,609
Bachelor's degree: 3,179
Master's degree: 1,535
Professional school degree: 264
Doctorate degree: 64
Housing units in structures:
One, detached: 9,245
One, attached: 1,567
Two: 373
3 or 4: 1,141
5 to 9: 1,158
10 to 19: 780
20 to 49: 1,161
50 or more: 1,138
Mobile homes: 615
Boats, RVs, vans, etc.: 42
Median worth of mobile homes: $85,347
Housing units lacking complete plumbing facilities in 2022: 1.6%
Housing units lacking complete kitchen facilities in 2022: 3.4%
House/condo owner moved in on average 14 years ago