Housing density: 1,118 houses/condos per square mile
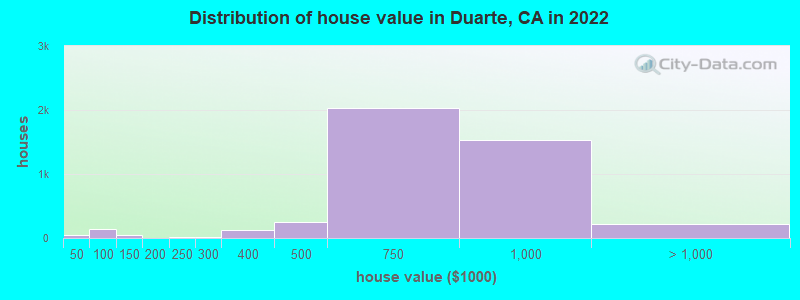
Median price asked for vacant for-sale houses and condos in 2022: $1,621,750.
Median contract rent in 2022: $1,729 (lower quartile is $1,142, upper quartile is over $2,000)
Median rent asked for vacant for-rent units in 2022: $2,366
Median gross rent in Duarte, CA in 2022: $1,876
Housing units in Duarte with a mortgage: 3,073 (299 second mortgage, 10 home equity loan, 210 both second mortgage and home equity loan) Houses without a mortgage: 20
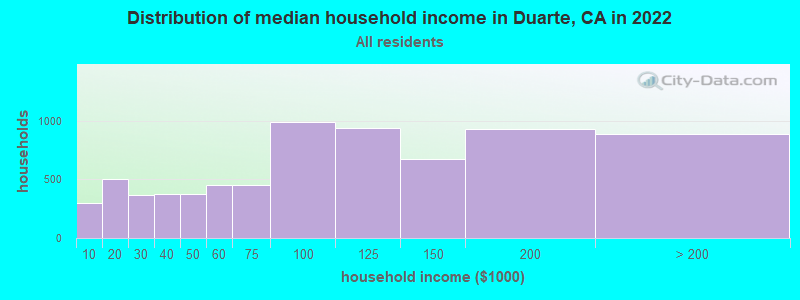
Median household income for houses/condos with a mortgage: $114,541
Median household income for apartments without a mortgage: $118,192
Size of family households: 1,946 2-persons, 1,421 3-persons, 865 4-persons, 515 5-persons, 216 6-persons, 326 7-or-more-persons.
Size of nonfamily households: 1,724 1-person, 207 2-persons, 7 3-persons.
1,942 married couples with children.
635 single-parent households (254 men, 381 women).
43.5% of residents of Duarte speak English at home.
36.8% of residents speak Spanish at home (66% speak English very well, 20% speak English well, 10% speak English not well, 4% don't speak English at all).
4.5% of residents speak other Indo-European language at home (70% speak English very well, 28% speak English well, 1% speak English not well, 1% don't speak English at all).
12.9% of residents speak Asian or Pacific Island language at home (46% speak English very well, 32% speak English well, 16% speak English not well, 6% don't speak English at all).
2.7% of residents speak other language at home (52% speak English very well, 27% speak English well, 10% speak English not well, 11% don't speak English at all).
Foreign born population: 7,055 (33.3%)
(62.3% of them are naturalized citizens)
Percentage of workers working in this county: 92.6% Number of people working at home: 1,489 (14.6% of all workers)
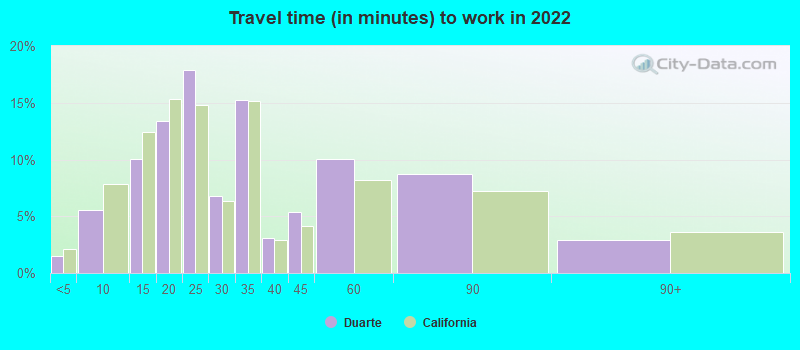
Travel time to work (commute)
Less than 5 minutes: 214
5 to 9 minutes: 632
10 to 14 minutes: 1,062
15 to 19 minutes: 855
20 to 24 minutes: 1,014
25 to 29 minutes: 494
30 to 34 minutes: 1,846
35 to 39 minutes: 364
40 to 44 minutes: 464
45 to 59 minutes: 685
60 to 89 minutes: 743
90 or more minutes: 274
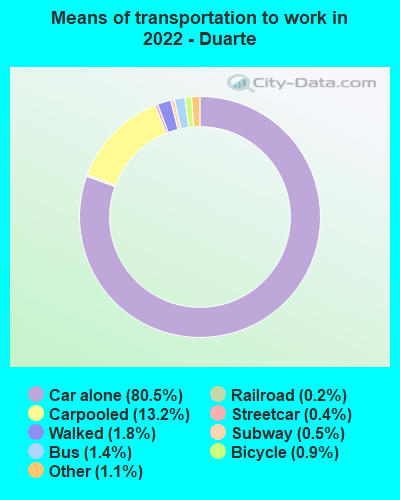
Means of transportation to work:
Drove a car alone: 8,796 (69.4%)
Carpooled: 1,594 (12.6%)
Bus: 139 (1.1%)
Subway or elevated rail: 32 (0.3%)
Long-distance train or commuter rail: 34 (0.3%)
Light rail, streetcar or trolley: 11 (0.1%)
Taxi: 136 (1.1%)
Bicycle: 97 (0.8%)
Walked: 216 (1.7%)
Worked at home: 1,489 (11.7%)
Unemployment by race in 2022
Unemployment rate for White non-Hispanic residents
1.1%Males
1.1%Females
Unemployment rate for Black residents
6.3%Females
Unemployment rate for American Indian and Alaska Native residents
17.5%Females
Unemployment rate for Asian residents
2.4%Males
10.6%Females
Unemployment rate for other race residents
9.7%Males
6.3%Females
Unemployment rate for two or more race residents
2.1%Males
2.3%Females
Unemployment rate for Hispanic or Latino residents
5.4%Males
5.3%Females
Year of entry for the foreign-born population in Duarte, California
1,1422010 or later
1,0502000 to 2009
1,2151990 to 1999
2,1441980 to 1989
1,9311970 to 1979
1,140Before 1970
First ancestries reported:
Armenian: 419 (3.1%)
German: 312 (2.3%)
American: 219 (1.6%)
English: 194 (1.4%)
African: 184 (1.3%)
Irish: 183 (1.3%)
Italian: 162 (1.2%)
Egyptian: 129 (0.9%)
Swedish: 67 (0.5%)
Scottish: 64 (0.5%)
European: 41 (0.3%)
French: 29 (0.2%)
Croatian: 26 (0.2%)
Lebanese: 23 (0.2%)
Hungarian: 23 (0.2%)
French Canadian: 19 (0.1%)
Russian: 15 (0.1%)
Scotch-Irish: 15 (0.1%)
British: 14 (0.1%)
Iranian: 14 (0.1%)
Polish: 13 (0.10%)
Romanian: 11 (0.08%)
Ukrainian: 11 (0.08%)
Norwegian: 10 (0.07%)
Ethiopian: 10 (0.07%)
Swiss: 10 (0.07%)
Austrian: 9 (0.07%)
Welsh: 8 (0.06%)
Canadian: 7 (0.05%)
Dutch: 5 (0.04%)
Brazilian: 3 (0.02%)
Most common places of birth for foreign-born residents (%):
Mexico
Duarte:
30.4% (2,148)
California:
37.2% (3,881,193)
China, excluding Hong Kong and Taiwan
Duarte:
12.1% (851)
California:
6.6% (684,672)
Philippines
Duarte:
10.9% (767)
California:
7.8% (818,297)
El Salvador
Duarte:
8.6% (608)
California:
4.2% (440,287)
Guatemala
Duarte:
3.5% (247)
California:
2.8% (290,436)
India
Duarte:
3.1% (218)
California:
5.2% (539,184)
Japan
Duarte:
2.2% (154)
California:
1.0% (103,575)
Korea
Duarte:
2.1% (145)
California:
3.0% (315,248)
Lebanon
Duarte:
2.0% (144)
California:
0.3% (31,757)
Honduras
Duarte:
2.0% (143)
California:
0.6% (66,590)
Egypt
Duarte:
2.0% (139)
California:
0.4% (42,718)
Hong Kong
Duarte:
1.9% (134)
California:
1.0% (105,215)
Taiwan
Duarte:
1.7% (123)
California:
1.7% (176,274)
Peru
Duarte:
1.7% (118)
California:
0.7% (74,025)
Place of birth for U.S.-born residents:
This state: 11,460
Other state: 2,538
Northeast: 420
Midwest: 1,054
South: 717
West: 327
92.5% of Duarte residents lived in the same house 1 years ago. Out of people who lived in different houses, 42.3% lived in this county. Out of people who lived in different counties, 74.8% lived in California.
Duarte:
92.5%
State average:
88.9%
Education attainment for males 25 years and older:
No schooling: 247
Nursery to 4th grade: 62
5th and 6th grade: 219
7th and 8th grade: 163
9th grade: 89
10th grade: 101
11th grade: 141
12th grade, no diploma: 306
High school graduate (or equivalency): 2,190
Less than 1 year of college: 457
Some college more than 1 year, no degree: 975
Associate degree: 426
Bachelor's degree: 1,587
Master's degree: 530
Professional school degree: 126
Doctorate degree: 196
Education attainment for females 25 years and older:
No schooling: 306
Nursery to 4th grade: 89
5th and 6th grade: 225
7th and 8th grade: 130
9th grade: 155
10th grade: 63
11th grade: 121
12th grade, no diploma: 117
High school graduate (or equivalency): 1,725
Less than 1 year of college: 381
Some college more than 1 year, no degree: 1,167
Associate degree: 785
Bachelor's degree: 2,046
Master's degree: 759
Professional school degree: 123
Doctorate degree: 183
Housing units in structures:
One, detached: 4,911
One, attached: 778
Two: 92
3 or 4: 317
5 to 9: 198
10 to 19: 243
20 to 49: 253
50 or more: 582
Mobile homes: 91
Median worth of mobile homes: $119,433
Housing units lacking complete plumbing facilities in 2022: 2.0%
Housing units lacking complete kitchen facilities in 2022: 3.9%
House/condo owner moved in on average 18 years ago