Fairhope, AL (Alabama) Houses and Residents
| Fairhope: | $449,228 |
| Alabama: | $200,900 |
Mean price in 2022:
Detached houses: $432,596
Here: $432,596 State: $273,076 Townhouses or other attached units: $259,581
Here: $259,581 State: $222,857 In 3-to-4-unit structures: $68,519
Here: $68,519 State: $194,388 In 5-or-more-unit structures: $610,424
Here: $610,424 State: $307,073 Mobile homes: $68,654
Here: $68,654 State: $77,780
Total population: 18,089 (Urban population: 11,704 (all inside urban clusters), Rural population: 508 (all nonfarm))
Houses: 10,527 (9,286 occupied: 7,767 owner occupied, 1,793 renter occupied)
| % of renters here: | 19% |
| State: | 30% |
Housing density: 957 houses/condos per square mile
Median price asked for vacant for-sale houses and condos in 2022: $302,566.
Median contract rent in 2022: $1,314 (lower quartile is $748, upper quartile is $1,866)
Median rent asked for vacant for-rent units in 2022: $788
Median gross rent in Fairhope, AL in 2022: $1,503
Housing units in Fairhope with a mortgage: 4,746 (535 second mortgage, 47 home equity loan, 369 both second mortgage and home equity loan)
Houses without a mortgage: 145
Median household income for houses/condos with a mortgage: $101,198
Median household income for apartments without a mortgage: $88,051
Median monthly housing costs: $1,341
Compare current foreclosures in Fairhope, AL:
| Photo | Address | Area | Beds / Baths | Price | Details |
|---|---|---|---|---|---|

|
#1
Caye Falls St
Fairhope, AL 36532
|
1,955 sq. feet
|
2 baths 3 beds |
show details | |

|
#2
Mockingbird Ln
Fairhope, AL 36532
|
1,739 sq. feet
|
1 baths 3 beds |
show details | |

|
#3
Cedar Ln
Fairhope, AL 36532
|
1,590 sq. feet
|
1 baths 3 beds |
show details | |

|
#4
Spring Lake Dr
Fairhope, AL 36532
|
1,604 sq. feet
|
2 baths 3 beds |
show details | |

|
#5
Browning Ln
Fairhope, AL 36532
|
1,512 sq. feet
|
2 baths 3 beds |
show details | |

|
#6
State Highway 104
Fairhope, AL 36532
|
2,379 sq. feet
|
1 baths 4 beds |
show details | |

|
#7
Ivy Cir
Fairhope, AL 36532
|
3,207 sq. feet
|
1 baths 3 beds |
show details | |

|
#8
Patlynn Dr
Fairhope, AL 36532
|
2,142 sq. feet
|
1 baths 3 beds |
show details | |

|
#9
Silverwood Dr
Fairhope, AL 36532
|
1,492 sq. feet
|
1 baths 3 beds |
show details | |

|
#10
Blueberry Ln Unit 2
Fairhope, AL 36532
|
992 sq. feet
|
2 baths 2 beds |
show details |
| Photo | Address | Area | Beds / Baths | Price | Details |
|---|---|---|---|---|---|

|
#11
Wildwood Ct
Fairhope, AL 36532
|
5,912 sq. feet
|
1 baths 4 beds |
show details | |

|
#12
Pope Ct
Fairhope, AL 36532
|
1,509 sq. feet
|
1 baths 2 beds |
show details | |

|
#13
Crystal Wells Ct S
Fairhope, AL 36532
|
1,334 sq. feet
|
2 baths 3 beds |
show details | |

|
#14
Greeno Rd
Fairhope, AL 36532
|
800 sq. feet
|
1 baths 1 beds |
show details | |

|
#15
Frego Ln
Fairhope, AL 36532
|
2,173 sq. feet
|
- baths 3 beds |
show details | |

|
#16
Keller Rd
Fairhope, AL 36532
|
1,527 sq. feet
|
- baths 3 beds |
show details | |

|
#17
Azalea St
Fairhope, AL 36532
|
1,368 sq. feet
|
- baths 2 beds |
show details | |

|
#18
Greeno Ln
Fairhope, AL 36532
|
1,852 sq. feet
|
- baths 3 beds |
show details | |

|
#19
Petz Ave
Fairhope, AL 36532
|
1,788 sq. feet
|
2 baths - beds |
show details | |

|
#20
Hawthorne Cir
Fairhope, AL 36532
|
1,771 sq. feet
|
- baths 3 beds |
show details |
| Photo | Address | Area | Beds / Baths | Price | Details |
|---|---|---|---|---|---|

|
#21
Thompson Hall Rd
Fairhope, AL 36532
|
1,760 sq. feet
|
1 baths - beds |
show details | |

|
#22
Eastwood Ave
Fairhope, AL 36532
|
1,640 sq. feet
|
2 baths - beds |
show details | |

|
#23
Heard Rd
Fairhope, AL 36532
|
816 sq. feet
|
- baths 3 beds |
show details | |

|
#24
Downtown Founders Ln
Fairhope, AL 36532
|
- sq. feet
|
- baths - beds |
show details | |

|
#25
County Road 3
Fairhope, AL 36532
|
- sq. feet
|
- baths - beds |
show details | |

|
#26
S Church St Apt C
Fairhope, AL 36532
|
- sq. feet
|
- baths - beds |
show details | |

|
#27
Fly Creek Ave, Unit 3317
Fairhope, AL 36532
|
- sq. feet
|
- baths - beds |
show details | |

|
#28
Bellangee Ave
Fairhope, AL 36532
|
- sq. feet
|
- baths - beds |
show details | |

|
#29
Mcintosh Bluff Rd
Fairhope, AL 36532
|
- sq. feet
|
- baths - beds |
show details | |

|
#30
Gayfer Ave Apt 1014
Fairhope, AL 36532
|
- sq. feet
|
- baths - beds |
show details |
| Photo | Address | Area | Beds / Baths | Price | Details |
|---|---|---|---|---|---|

|
#31
Meadow Rd Lot 16
Fairhope, AL 36532
|
- sq. feet
|
- baths - beds |
show details | |

|
#32
Spring Run Dr Apt 109
Fairhope, AL 36532
|
- sq. feet
|
- baths - beds |
show details | |

|
#33
South Dr
Fairhope, AL 36532
|
- sq. feet
|
- baths - beds |
show details | |

|
#34
Spring Run Dr Apt 143
Fairhope, AL 36532
|
- sq. feet
|
- baths - beds |
show details | |

|
#35
Danne Ln
Fairhope, AL 36532
|
- sq. feet
|
- baths - beds |
show details | |

|
#36
Bishop Rd # 221
Fairhope, AL 36532
|
- sq. feet
|
- baths - beds |
show details | |

|
#37
Gum Swamp Rd
Fairhope, AL 36532
|
- sq. feet
|
- baths - beds |
show details | |

|
#38
Winterhaven Ct
Fairhope, AL 36532
|
- sq. feet
|
- baths - beds |
show details | |

|
#39
Winterhaven Ct
Fairhope, AL 36532
|
- sq. feet
|
- baths - beds |
show details | |

|
#40
Turquoise Dr
Fairhope, AL 36532
|
- sq. feet
|
- baths - beds |
show details |
| Photo | Address | Area | Beds / Baths | Price | Details |
|---|---|---|---|---|---|

|
#41
Twin Echo Ct
Fairhope, AL 36532
|
- sq. feet
|
- baths - beds |
show details | |

|
#42
Cadena Creek Ave
Fairhope, AL 36532
|
- sq. feet
|
- baths - beds |
show details | |

|
#43
Road 32
Fairhope, AL 36532
|
- sq. feet
|
- baths - beds |
show details | |

|
#44
Tealeaf Willow Ln
Fairhope, AL 36532
|
- sq. feet
|
- baths - beds |
show details | |

|
#45
Echo Ln
Fairhope, AL 36532
|
- sq. feet
|
- baths - beds |
show details | |

|
#46
Section St
Fairhope, AL 36532
|
- sq. feet
|
- baths - beds |
show details | |

|
#47
Amador Ave
Fairhope, AL 36532
|
- sq. feet
|
- baths - beds |
show details | |

|
#48
Packer Ln
Fairhope, AL 36532
|
1,216 sq. feet
|
- baths - beds |
show details | |

|
#49
Bishop Rd # 210
Fairhope, AL 36532
|
- sq. feet
|
- baths - beds |
show details | |

|
Check over 1 million property listings on Foreclosure.com!
|
browse all offers | |||

Latest news about housing in Fairhope, AL collected exclusively by city-data.com from local newspapers, TV, and radio stations


Median year apartment built: 1984
Household type by relationship:
Households: 23,865- Male householders: 4,710 (884 living alone), Female householders: 4,560 (1,694 living alone)
5,714 spouses (5,690 opposite-sex spouses), 254 unmarried partners, (215 opposite-sex unmarried partners), 6,547 children (6,112 natural, 272 adopted, 162 stepchildren), 606 grandchildren, 162 brothers or sisters, 420 parents, 0 foster children, 234 other relatives, 411 non-relatives
- In group quarters: 241
Size of family households: 3,127 2-persons, 1,741 3-persons, 1,269 4-persons, 593 5-persons, 74 6-persons, 111 7-or-more-persons.
Size of nonfamily households: 2,390 1-person, 270 2-persons, 30 3-persons.
3,910 married couples with children.
639 single-parent households (0 men, 639 women).
96.4% of residents of Fairhope speak English at home.
2.2% of residents speak Spanish at home (41% speak English very well, 35% speak English well, 16% speak English not well, 7% don't speak English at all).
1.5% of residents speak other Indo-European language at home (89% speak English very well, 11% speak English well).
0.2% of residents speak other language at home (100% speak English very well).
Foreign born population: 715 (3.0%)
(60.6% of them are naturalized citizens)
| Here: | 6.8 |
| State: | 6.5 |
| Here: | 4.8 |
| State: | 4.7 |

- Bedrooms in owner-occupied houses and condos in Fairhope, Alabama
- 12no bedroom
- 171 bedroom
- 8272 bedrooms
- 3,7043 bedrooms
- 2,4524 bedrooms
- 7565+ bedrooms

- Bedrooms in renter-occupied apartments in Fairhope, Alabama
- 27no bedroom
- 4231 bedroom
- 4532 bedrooms
- 7083 bedrooms
- 1824 bedrooms
- 05+ bedrooms

- Cars and other vehicles available in Fairhope in owner-occupied houses/condos
- 247no vehicle
- 1,9771 vehicle
- 3,8552 vehicles
- 1,1663 vehicles
- 3374 vehicles
- 1855+ vehicles

- Cars and other vehicles available in Fairhope in renter-occupied apartments
- 122no vehicle
- 9401 vehicle
- 5332 vehicles
- 1983 vehicles
- 04 vehicles
- 05+ vehicles

- Rooms in owner-occupied houses in Fairhope, Alabama
- 121 room
- 172 rooms
- 513 rooms
- 4514 rooms
- 8825 rooms
- 1,9086 rooms
- 1,5817 rooms
- 9058 rooms
- 1,9619+ rooms

- Rooms in renter-occupied apartments in Fairhope, Alabama
- 271 room
- 412 rooms
- 3143 rooms
- 3614 rooms
- 3555 rooms
- 2556 rooms
- 1757 rooms
- 2118 rooms
- 539+ rooms


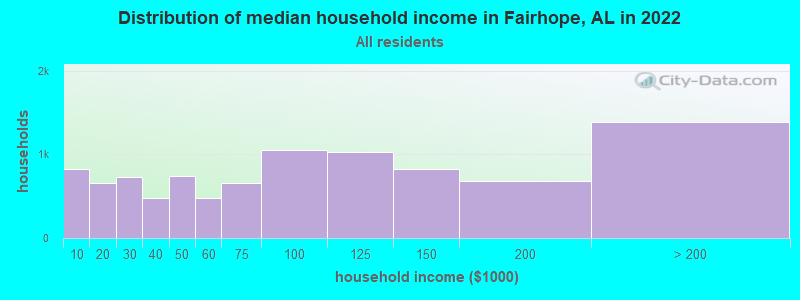
Fairhope, AL household income distribution

- 830Less than $10,000
- 660$10,000 to $19,999
- 730$20,000 to $29,999
- 482$30,000 to $39,999
- 739$40,000 to $49,999
- 483$50,000 to $59,999
- 663$60,000 to $74,999
- 1,054$75,000 to $99,999
- 1,027$100,000 to $124,999
- 825$125,000 to $149,999
- 688$150,000 to $199,999
- 1,388$200,000 or more
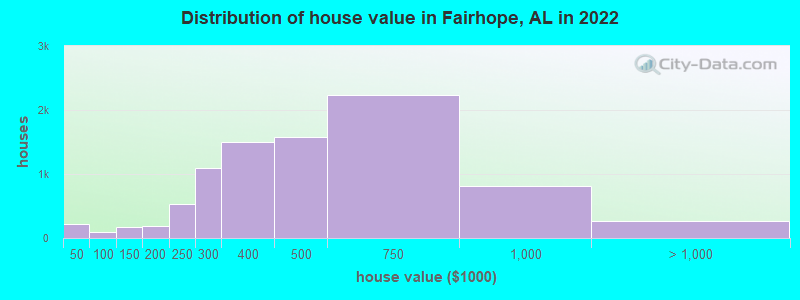
Home value of owner - occupied houses in 2022 in Fairhope, AL
-
- 28Less than $10,000
- 82$10,000 to $14,999
- 16$20,000 to $24,999
- 53$30,000 to $34,999
- 34$40,000 to $49,999
- 18$50,000 to $59,999
- 13$60,000 to $69,999
- 8$80,000 to $89,999
- 10$90,000 to $99,999
- 77$100,000 to $124,999
- 88$125,000 to $149,999
- 76$150,000 to $174,999
- 108$175,000 to $199,999
- 523$200,000 to $249,999
- 1,097$250,000 to $299,999
- 1,494$300,000 to $399,999
- 1,577$400,000 to $499,999
- 2,236$500,000 to $749,999
- 808$750,000 to $999,999
- 164$1,000,000 to $1,499,999
- 23$1,500,000 to $1,999,999
- 74$2,000,000 or more
Rent paid by renters in 2022 in Fairhope, AL
-
- 49$150 to $199
- 16$200 to $249
- 90$250 to $299
- 94$300 to $349
- 62$400 to $449
- 44$500 to $549
- 57$550 to $599
- 51$650 to $699
- 25$700 to $749
- 49$800 to $899
- 7$900 to $999
- 145$1,000 to $1,249
- 366$1,250 to $1,499
- 564$1,500 to $1,999
- 171$2,000 to $2,499
- 7$2,500 to $2,999
- 26$3,500 or more
- 117No cash rent


Percentage of workers working in this county: 81.3%
Number of people working at home: 1,578 (17.4% of all workers)
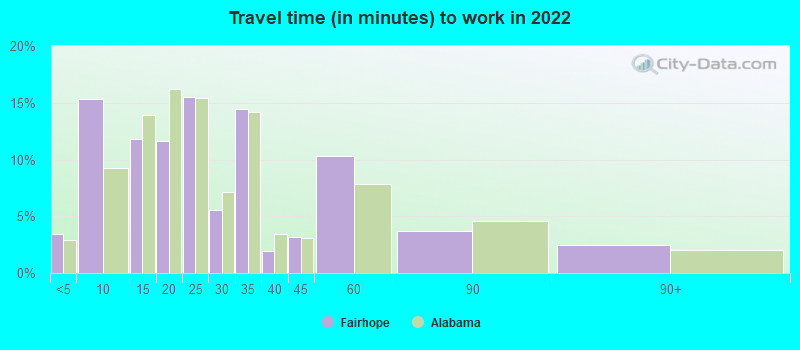
Travel time to work (commute)
- Less than 5 minutes: 267
- 5 to 9 minutes: 1,358
- 10 to 14 minutes: 678
- 15 to 19 minutes: 929
- 20 to 24 minutes: 691
- 25 to 29 minutes: 522
- 30 to 34 minutes: 1,079
- 35 to 39 minutes: 436
- 40 to 44 minutes: 247
- 45 to 59 minutes: 879
- 60 to 89 minutes: 377
- 90 or more minutes: 83
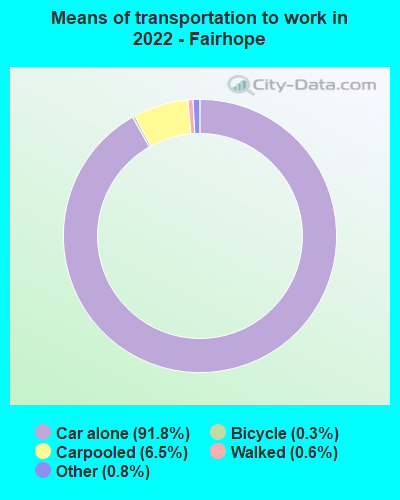
Means of transportation to work:
- Drove a car alone: 9,035 (79.8%)
- Carpooled: 646 (5.7%)
- Taxi: 106 (0.9%)
- Bicycle: 21 (0.2%)
- Walked: 64 (0.6%)
- Worked at home: 1,578 (13.9%)

- Unemployment by race in 2022
- Unemployment rate for White non-Hispanic residents
- 2.9%Males
- 5.0%Females
- Unemployment rate for Black residents
- 5.6%Females
- Unemployment rate for other race residents
- 32.1%Males
- Unemployment rate for Hispanic or Latino residents
- 16.7%Males

- Year of entry for the foreign-born population in Fairhope, Alabama
- 1822010 or later
- 1742000 to 2009
- 841990 to 1999
- 251980 to 1989
- 01970 to 1979
- 207Before 1970

First ancestries reported:
- English: 2,704 (25.9%)
- American: 2,337 (22.4%)
- Irish: 1,129 (10.8%)
- German: 926 (8.9%)
- Italian: 607 (5.8%)
- Scotch-Irish: 259 (2.5%)
- European: 258 (2.5%)
- Scottish: 237 (2.3%)
- French: 172 (1.7%)
- Finnish: 135 (1.3%)
- Greek: 60 (0.6%)
- Croatian: 53 (0.5%)
- Norwegian: 52 (0.5%)
- Lebanese: 45 (0.4%)
- Canadian: 44 (0.4%)
- Scandinavian: 40 (0.4%)
- Northern European: 39 (0.4%)
- British: 38 (0.4%)
- Eastern European: 38 (0.4%)
- Ukrainian: 34 (0.3%)
- Slovak: 30 (0.3%)
- French Canadian: 24 (0.2%)
- Romanian: 24 (0.2%)
- Russian: 24 (0.2%)
- Belgian: 21 (0.2%)
- Swedish: 15 (0.1%)
- Polish: 13 (0.1%)
- Jamaican: 13 (0.1%)
- Lithuanian: 12 (0.1%)
- Dutch: 3 (0.03%)
Most common places of birth for foreign-born residents (%):
| Fairhope: | 23.9% (152) |
| Alabama: | 3.9% (6,831) |
| Fairhope: | 21.3% (135) |
| Alabama: | 8.6% (15,159) |
| Fairhope: | 10.2% (65) |
| Alabama: | 5.5% (9,672) |
| Fairhope: | 5.5% (35) |
| Alabama: | 0.1% (248) |
| Fairhope: | 5.2% (33) |
| Alabama: | 1.2% (2,134) |
| Fairhope: | 4.6% (29) |
| Alabama: | 0.0% (48) |
| Fairhope: | 3.8% (24) |
| Alabama: | 0.1% (203) |
| Fairhope: | 3.5% (22) |
| Alabama: | 4.6% (8,075) |
| Fairhope: | 3.3% (21) |
| Alabama: | 0.1% (203) |
| Fairhope: | 3.1% (20) |
| Alabama: | 1.1% (1,877) |
| Fairhope: | 2.4% (15) |
| Alabama: | 0.4% (653) |
| Fairhope: | 2.2% (14) |
| Alabama: | 0.2% (301) |
| Fairhope: | 2.2% (14) |
| Alabama: | 0.3% (619) |
| Fairhope: | 1.9% (12) |
| Alabama: | 2.3% (4,000) |
Place of birth for U.S.-born residents:
- This state: 10,542
- Other state: 12,044
- Northeast: 1,547
- Midwest: 2,032
- South: 7,658
- West: 808
88.5% of Fairhope residents lived in the same house 1 years ago.
Out of people who lived in different houses, 34.9% lived in this county.
Out of people who lived in different counties, 28.2% lived in Alabama.
| Fairhope: | 88.5% |
| State average: | 87.6% |
Education attainment for males 25 years and older:
- No schooling: 10
- Nursery to 4th grade: 186
- 5th and 6th grade: 0
- 7th and 8th grade: 9
- 9th grade: 0
- 10th grade: 27
- 11th grade: 0
- 12th grade, no diploma: 115
- High school graduate (or equivalency): 997
- Less than 1 year of college: 388
- Some college more than 1 year, no degree: 841
- Associate degree: 896
- Bachelor's degree: 2,548
- Master's degree: 1,362
- Professional school degree: 660
- Doctorate degree: 257

Education attainment for females 25 years and older:
- No schooling: 55
- Nursery to 4th grade: 0
- 5th and 6th grade: 32
- 7th and 8th grade: 20
- 9th grade: 4
- 10th grade: 44
- 11th grade: 43
- 12th grade, no diploma: 81
- High school graduate (or equivalency): 1,269
- Less than 1 year of college: 593
- Some college more than 1 year, no degree: 1,390
- Associate degree: 1,077
- Bachelor's degree: 2,358
- Master's degree: 1,613
- Professional school degree: 457
- Doctorate degree: 156


Housing units in structures:
- One, detached: 8,798
- One, attached: 194
- Two: 43
- 3 or 4: 455
- 5 to 9: 132
- 10 to 19: 373
- 20 to 49: 137
- 50 or more: 176
- Mobile homes: 215
Housing units lacking complete kitchen facilities in 2022: 1.6%
House/condo owner moved in on average 8 years ago
Renter moved in on average 1 years ago

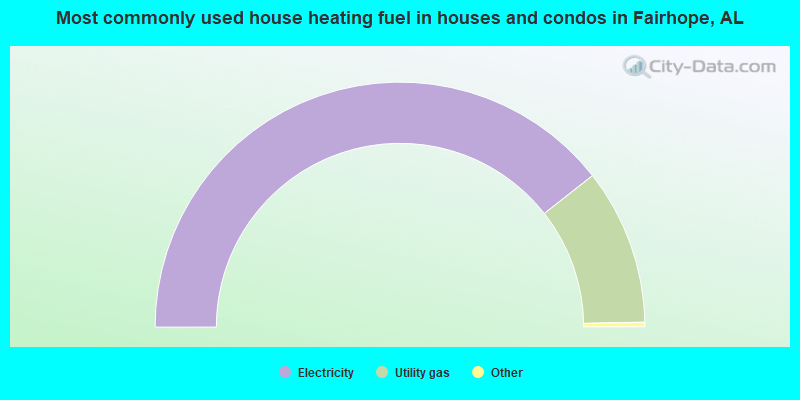
- 78.8%Electricity
- 20.6%Utility gas
- 0.4%Bottled, tank, or LP gas
- 0.2%No fuel used
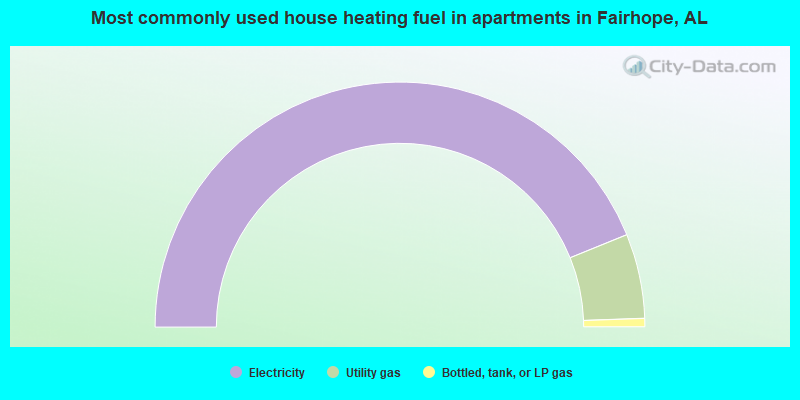
- 87.7%Electricity
- 11.2%Utility gas
- 1.1%Bottled, tank, or LP gas
Private vs. public school enrollment:
| Here: | 29.7% |
| Alabama: | 14.7% |
| Here: | 42.9% |
| Alabama: | 16.3% |
| Here: | 14.2% |
| Alabama: | 14.6% |


