Petaluma, CA (California) Houses and Residents
| Petaluma: | $830,022 |
| California: | $715,900 |
Mean price in 2022:
Detached houses: $977,748
Here: $977,748 State: $988,808 Townhouses or other attached units: $706,009
Here: $706,009 State: $838,546 In 2-unit structures: $633,189
Here: $633,189 State: $1,138,100 In 3-to-4-unit structures: $617,637
Here: $617,637 State: $824,253 In 5-or-more-unit structures: $815,349
Here: $815,349 State: $730,996 Mobile homes: $175,796
Here: $175,796 State: $184,506
Total population: 59,953 (Urban population: 54,469, Rural population: 69 (all nonfarm))
Houses: 24,499 (23,834 occupied: 15,159 owner occupied, 8,950 renter occupied)
| % of renters here: | 37% |
| State: | 44% |
Housing density: 1,775 houses/condos per square mile
Median price asked for vacant for-sale houses and condos in 2022: $1,023,264.
Median contract rent in 2022: over $2,000 (lower quartile is $1,380, upper quartile is over $2,000)
Median rent asked for vacant for-rent units in 2022: $2,252
Median gross rent in Petaluma, CA in 2022: over $2,000
Housing units in Petaluma with a mortgage: 10,127 (1,402 second mortgage, 42 home equity loan, 1,188 both second mortgage and home equity loan)
Houses without a mortgage: 134
Median household income for houses/condos with a mortgage: $152,659
Median household income for apartments without a mortgage: $84,351
Median monthly housing costs: $2,218
Compare current foreclosures in Petaluma, CA:
| Photo | Address | Area | Beds / Baths | Price | Details |
|---|---|---|---|---|---|

|
#1
Petaluma Blvd S Apt 28
Petaluma, CA 94952
|
565 sq. feet
|
1 baths 1 beds |
$350,000
|
show details |

|
#2
Bentley Ct
Petaluma, CA 94952
|
- sq. feet
|
5 baths 5 beds |
$2,236,000
|
show details |

|
#3
Jewett Rd
Petaluma, CA 94952
|
1,600 sq. feet
|
2 baths 4 beds |
show details | |

|
#4
Rovina Ln
Petaluma, CA 94952
|
2,305 sq. feet
|
3 baths 3 beds |
show details | |

|
#5
Alta Dr
Petaluma, CA 94954
|
1,430 sq. feet
|
2 baths 4 beds |
show details | |

|
#6
Maria Dr
Petaluma, CA 94954
|
1,376 sq. feet
|
2 baths 3 beds |
show details | |

|
#7
Rio Nido Way
Petaluma, CA 94954
|
2,113 sq. feet
|
3 baths 4 beds |
show details | |

|
#8
Edith St
Petaluma, CA 94952
|
889 sq. feet
|
2 baths 2 beds |
show details | |

|
#9
Phillips Ave
Petaluma, CA 94952
|
1,885 sq. feet
|
3 baths 3 beds |
show details | |

|
#10
San Marino Dr
Petaluma, CA 94954
|
1,366 sq. feet
|
2 baths 3 beds |
show details |
| Photo | Address | Area | Beds / Baths | Price | Details |
|---|---|---|---|---|---|

|
#11
Garfield Dr
Petaluma, CA 94954
|
1,882 sq. feet
|
2 baths 4 beds |
show details | |

|
#12
Culpepper Dr
Petaluma, CA 94954
|
1,860 sq. feet
|
2 baths 4 beds |
show details | |

|
#13
8th St
Petaluma, CA 94952
|
1,369 sq. feet
|
1 baths 3 beds |
show details | |

|
#14
Middlefield Dr
Petaluma, CA 94952
|
2,618 sq. feet
|
2 baths 3 beds |
show details | |

|
#15
Agatha Ct
Petaluma, CA 94952
|
2,432 sq. feet
|
3 baths 4 beds |
show details | |

|
#16
Williams Dr
Petaluma, CA 94954
|
1,997 sq. feet
|
3 baths 5 beds |
show details | |

|
#17
Arlington Dr
Petaluma, CA 94952
|
1,648 sq. feet
|
2 baths 3 beds |
show details | |

|
#18
Del Sol Way
Petaluma, CA 94954
|
1,409 sq. feet
|
2 baths 3 beds |
show details | |

|
#19
Glen Eagle Dr
Petaluma, CA 94952
|
6,762 sq. feet
|
3 baths 3 beds |
show details | |

|
#20
Andover Way
Petaluma, CA 94954
|
2,538 sq. feet
|
4 baths 5 beds |
show details |
| Photo | Address | Area | Beds / Baths | Price | Details |
|---|---|---|---|---|---|

|
#21
Del Oro Cir
Petaluma, CA 94954
|
1,388 sq. feet
|
2 baths 3 beds |
show details | |

|
#22
Newcastle Ct
Petaluma, CA 94954
|
1,872 sq. feet
|
3 baths 4 beds |
show details | |

|
#23
Nottingham Ct
Petaluma, CA 94954
|
2,815 sq. feet
|
4 baths 4 beds |
show details | |

|
#24
Lavender Ter
Petaluma, CA 94952
|
2,618 sq. feet
|
3 baths 5 beds |
show details | |

|
#25
Dynamic St
Petaluma, CA 94954
|
- sq. feet
|
- baths - beds |
show details | |

|
#26
Baywood Dr Apt 89
Petaluma, CA 94954
|
- sq. feet
|
- baths - beds |
show details | |

|
#27
Bassett St
Petaluma, CA 94952
|
- sq. feet
|
- baths - beds |
show details | |

|
#28
Magnolia Ave Apt 36
Petaluma, CA 94952
|
- sq. feet
|
- baths - beds |
show details | |

|
#29
Woodside Cir
Petaluma, CA 94954
|
- sq. feet
|
- baths - beds |
show details | |

|
#30
Bernice Ct
Petaluma, CA 94952
|
- sq. feet
|
- baths - beds |
show details |
| Photo | Address | Area | Beds / Baths | Price | Details |
|---|---|---|---|---|---|

|
#31
Commerce St Ste D
Petaluma, CA 94954
|
- sq. feet
|
- baths - beds |
show details | |

|
#32
Edith St
Petaluma, CA 94952
|
- sq. feet
|
- baths - beds |
show details | |

|
Check over 1 million property listings on Foreclosure.com!
|
browse all offers | |||

Latest news about housing in Petaluma, CA collected exclusively by city-data.com from local newspapers, TV, and radio stations


Median year apartment built: 1985
Household type by relationship:
Households: 58,975- Male householders: 10,880 (2,159 living alone), Female householders: 12,327 (4,075 living alone)
12,215 spouses (11,926 opposite-sex spouses), 1,728 unmarried partners, (1,560 opposite-sex unmarried partners), 16,009 children (15,110 natural, 471 adopted, 426 stepchildren), 473 grandchildren, 397 brothers or sisters, 653 parents, 0 foster children, 985 other relatives, 2,594 non-relatives
- In group quarters: 710
Size of family households: 6,368 2-persons, 4,530 3-persons, 2,924 4-persons, 1,018 5-persons, 294 6-persons, 86 7-or-more-persons.
Size of nonfamily households: 6,862 1-person, 1,760 2-persons, 90 3-persons, 142 4-persons, 37 5-persons.
8,095 married couples with children.
2,495 single-parent households (1,003 men, 1,492 women).
79.8% of residents of Petaluma speak English at home.
14.5% of residents speak Spanish at home (60% speak English very well, 20% speak English well, 12% speak English not well, 8% don't speak English at all).
2.9% of residents speak other Indo-European language at home (67% speak English very well, 26% speak English well, 8% speak English not well).
2.2% of residents speak Asian or Pacific Island language at home (41% speak English very well, 34% speak English well, 21% speak English not well, 4% don't speak English at all).
0.5% of residents speak other language at home (89% speak English very well, 8% speak English well, 3% speak English not well).
Foreign born population: 8,397 (14.2%)
(55.1% of them are naturalized citizens)
| Here: | 6.0 |
| State: | 6.0 |
| Here: | 4.1 |
| State: | 3.9 |

- Bedrooms in owner-occupied houses and condos in Petaluma, California
- 8no bedroom
- 3061 bedroom
- 1,9692 bedrooms
- 7,0733 bedrooms
- 4,8384 bedrooms
- 9655+ bedrooms

- Bedrooms in renter-occupied apartments in Petaluma, California
- 397no bedroom
- 2,1111 bedroom
- 3,2712 bedrooms
- 2,0183 bedrooms
- 1,0804 bedrooms
- 745+ bedrooms

- Cars and other vehicles available in Petaluma in owner-occupied houses/condos
- 324no vehicle
- 3,0971 vehicle
- 6,9012 vehicles
- 2,9933 vehicles
- 1,1024 vehicles
- 7435+ vehicles

- Cars and other vehicles available in Petaluma in renter-occupied apartments
- 918no vehicle
- 3,5591 vehicle
- 2,9622 vehicles
- 9063 vehicles
- 3904 vehicles
- 2165+ vehicles

- Rooms in owner-occupied houses in Petaluma, California
- 81 room
- 1012 rooms
- 2713 rooms
- 1,0374 rooms
- 3,9875 rooms
- 3,1816 rooms
- 2,9837 rooms
- 1,8498 rooms
- 1,7429+ rooms

- Rooms in renter-occupied apartments in Petaluma, California
- 3001 room
- 1,0142 rooms
- 1,5483 rooms
- 2,1794 rooms
- 1,6055 rooms
- 1,1436 rooms
- 6787 rooms
- 1978 rooms
- 2879+ rooms


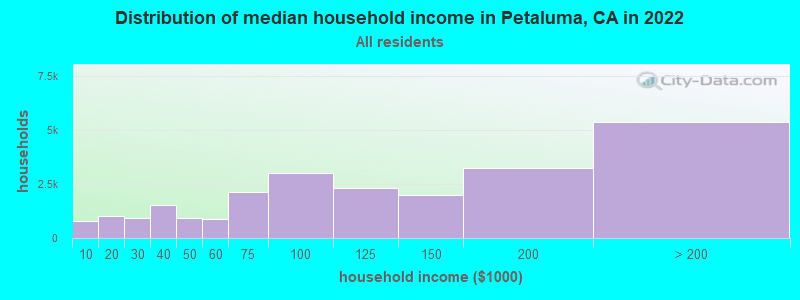
Petaluma, CA household income distribution

- 766Less than $10,000
- 1,036$10,000 to $19,999
- 924$20,000 to $29,999
- 1,550$30,000 to $39,999
- 942$40,000 to $49,999
- 899$50,000 to $59,999
- 2,127$60,000 to $74,999
- 2,999$75,000 to $99,999
- 2,323$100,000 to $124,999
- 1,997$125,000 to $149,999
- 3,230$150,000 to $199,999
- 5,381$200,000 or more
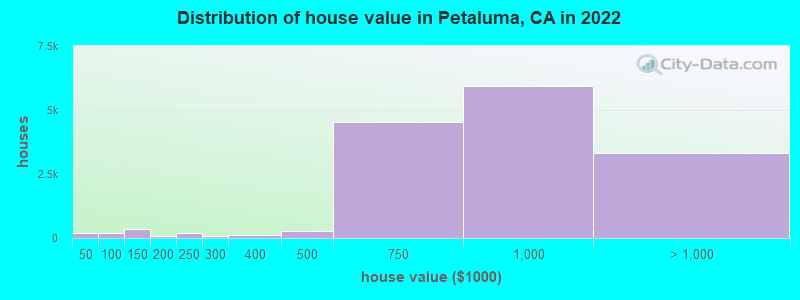
Home value of owner - occupied houses in 2022 in Petaluma, CA
-
- 64Less than $10,000
- 61$10,000 to $14,999
- 6$20,000 to $24,999
- 19$25,000 to $29,999
- 29$35,000 to $39,999
- 15$40,000 to $49,999
- 40$50,000 to $59,999
- 13$60,000 to $69,999
- 27$70,000 to $79,999
- 98$80,000 to $89,999
- 18$90,000 to $99,999
- 170$100,000 to $124,999
- 197$125,000 to $149,999
- 15$150,000 to $174,999
- 72$175,000 to $199,999
- 192$200,000 to $249,999
- 89$250,000 to $299,999
- 132$300,000 to $399,999
- 260$400,000 to $499,999
- 4,546$500,000 to $749,999
- 5,922$750,000 to $999,999
- 2,446$1,000,000 to $1,499,999
- 599$1,500,000 to $1,999,999
- 266$2,000,000 or more
Rent paid by renters in 2022 in Petaluma, CA
-
- 50$200 to $249
- 328$250 to $299
- 35$300 to $349
- 69$350 to $399
- 25$450 to $499
- 14$500 to $549
- 65$550 to $599
- 78$600 to $649
- 31$650 to $699
- 45$700 to $749
- 81$750 to $799
- 424$800 to $899
- 384$900 to $999
- 644$1,000 to $1,249
- 414$1,250 to $1,499
- 1,372$1,500 to $1,999
- 1,510$2,000 to $2,499
- 1,482$2,500 to $2,999
- 1,502$3,000 to $3,499
- 368$3,500 or more
- 202No cash rent


Percentage of workers working in this county: 71.5%
Number of people working at home: 5,207 (17.4% of all workers)
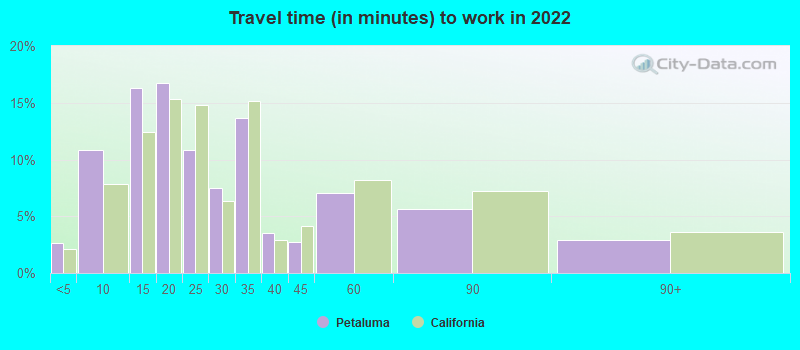
Travel time to work (commute)
- Less than 5 minutes: 561
- 5 to 9 minutes: 2,429
- 10 to 14 minutes: 3,457
- 15 to 19 minutes: 2,836
- 20 to 24 minutes: 1,982
- 25 to 29 minutes: 1,372
- 30 to 34 minutes: 3,860
- 35 to 39 minutes: 969
- 40 to 44 minutes: 1,288
- 45 to 59 minutes: 2,903
- 60 to 89 minutes: 2,532
- 90 or more minutes: 741
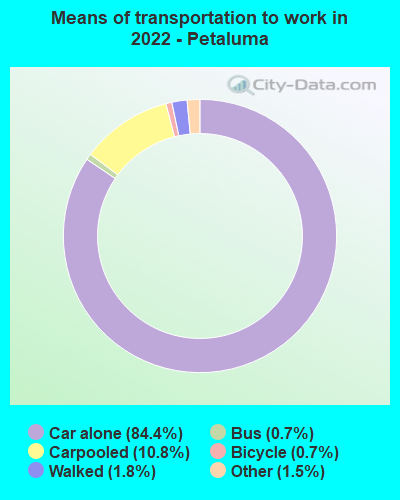
Means of transportation to work:
- Drove a car alone: 23,010 (72.0%)
- Carpooled: 2,443 (7.6%)
- Bus: 149 (0.5%)
- Subway or elevated rail: 33 (0.1%)
- Taxi: 337 (1.1%)
- Bicycle: 233 (0.7%)
- Walked: 551 (1.7%)
- Worked at home: 5,207 (16.3%)

- Unemployment by race in 2022
- Unemployment rate for White non-Hispanic residents
- 5.5%Males
- 1.7%Females
- Unemployment rate for Black residents
- 6.3%Males
- Unemployment rate for Asian residents
- 5.5%Males
- 0.4%Females
- Unemployment rate for other race residents
- 1.2%Males
- 0.8%Females
- Unemployment rate for two or more race residents
- 10.4%Males
- 4.4%Females
- Unemployment rate for Hispanic or Latino residents
- 3.7%Males
- 1.8%Females

- Year of entry for the foreign-born population in Petaluma, California
- 1,6592010 or later
- 2,3142000 to 2009
- 1,4601990 to 1999
- 2,1611980 to 1989
- 1,1301970 to 1979
- 1,613Before 1970

First ancestries reported:
- Italian: 2,443 (9.6%)
- German: 2,133 (8.4%)
- Irish: 2,123 (8.3%)
- English: 1,408 (5.5%)
- European: 1,377 (5.4%)
- American: 683 (2.7%)
- French: 389 (1.5%)
- Iranian: 305 (1.2%)
- Scottish: 281 (1.1%)
- Portuguese: 248 (1.0%)
- Eastern European: 245 (1.0%)
- British: 206 (0.8%)
- Norwegian: 191 (0.8%)
- Nigerian: 182 (0.7%)
- Russian: 165 (0.6%)
- Northern European: 150 (0.6%)
- Swedish: 143 (0.6%)
- Polish: 130 (0.5%)
- Finnish: 128 (0.5%)
- Danish: 128 (0.5%)
- Swiss: 125 (0.5%)
- Dutch: 120 (0.5%)
- Greek: 103 (0.4%)
- Scotch-Irish: 96 (0.4%)
- Czech: 95 (0.4%)
- Maltese: 83 (0.3%)
- Austrian: 71 (0.3%)
- Ethiopian: 61 (0.2%)
- Palestinian: 56 (0.2%)
- French Canadian: 52 (0.2%)
- Celtic: 51 (0.2%)
- Canadian: 47 (0.2%)
- Scandinavian: 43 (0.2%)
- Ukrainian: 41 (0.2%)
- Hungarian: 29 (0.1%)
- Turkish: 27 (0.1%)
- Welsh: 23 (0.09%)
- Brazilian: 21 (0.08%)
- Bulgarian: 19 (0.07%)
- South African: 19 (0.07%)
- Arab: 18 (0.07%)
- African: 18 (0.07%)
- Belgian: 17 (0.07%)
- Yugoslavian: 17 (0.07%)
- Belizean: 11 (0.04%)
- Serbian: 11 (0.04%)
- Egyptian: 9 (0.04%)
- Lithuanian: 9 (0.04%)
- Croatian: 9 (0.04%)
- Slovak: 9 (0.04%)
- Macedonian: 7 (0.03%)
- Israeli: 6 (0.02%)
- Basque: 6 (0.02%)
- Armenian: 6 (0.02%)
- Lebanese: 4 (0.02%)
Most common places of birth for foreign-born residents (%):
| Petaluma: | 37.2% (3,140) |
| California: | 37.2% (3,881,193) |
| Petaluma: | 4.4% (371) |
| California: | 7.8% (818,297) |
| Petaluma: | 4.3% (362) |
| California: | 6.6% (684,672) |
| Petaluma: | 3.9% (330) |
| California: | 4.2% (440,287) |
| Petaluma: | 3.2% (273) |
| California: | 2.8% (290,436) |
| Petaluma: | 3.0% (254) |
| California: | 1.2% (127,477) |
| Petaluma: | 2.7% (231) |
| California: | 0.7% (73,304) |
| Petaluma: | 2.4% (203) |
| California: | 2.0% (206,004) |
| Petaluma: | 2.3% (198) |
| California: | 5.2% (539,184) |
| Petaluma: | 2.1% (180) |
| California: | 4.9% (512,335) |
| Petaluma: | 2.0% (167) |
| California: | 0.6% (60,582) |
| Petaluma: | 1.9% (163) |
| California: | 0.3% (33,960) |
| Petaluma: | 1.6% (132) |
| California: | 0.3% (31,439) |
| Petaluma: | 1.6% (131) |
| California: | 0.3% (35,557) |
Place of birth for U.S.-born residents:
- This state: 37,333
- Other state: 12,588
- Northeast: 3,446
- Midwest: 3,422
- South: 2,746
- West: 2,963
91.0% of Petaluma residents lived in the same house 1 years ago.
Out of people who lived in different houses, 30.1% lived in this county.
Out of people who lived in different counties, 60.1% lived in California.
| Petaluma: | 91.0% |
| State average: | 88.9% |
Education attainment for males 25 years and older:
- No schooling: 255
- Nursery to 4th grade: 189
- 5th and 6th grade: 347
- 7th and 8th grade: 70
- 9th grade: 129
- 10th grade: 120
- 11th grade: 84
- 12th grade, no diploma: 510
- High school graduate (or equivalency): 4,206
- Less than 1 year of college: 1,456
- Some college more than 1 year, no degree: 3,897
- Associate degree: 1,687
- Bachelor's degree: 5,168
- Master's degree: 2,016
- Professional school degree: 750
- Doctorate degree: 304

Education attainment for females 25 years and older:
- No schooling: 210
- Nursery to 4th grade: 94
- 5th and 6th grade: 323
- 7th and 8th grade: 78
- 9th grade: 246
- 10th grade: 243
- 11th grade: 129
- 12th grade, no diploma: 294
- High school graduate (or equivalency): 3,010
- Less than 1 year of college: 1,560
- Some college more than 1 year, no degree: 3,506
- Associate degree: 2,330
- Bachelor's degree: 6,699
- Master's degree: 3,061
- Professional school degree: 754
- Doctorate degree: 336


Housing units in structures:
- One, detached: 16,885
- One, attached: 1,804
- Two: 506
- 3 or 4: 703
- 5 to 9: 859
- 10 to 19: 320
- 20 to 49: 667
- 50 or more: 1,951
- Mobile homes: 800
Median worth of mobile homes: $161,403
Housing units lacking complete kitchen facilities in 2022: 0.4%
House/condo owner moved in on average 17 years ago
Renter moved in on average 3 years ago

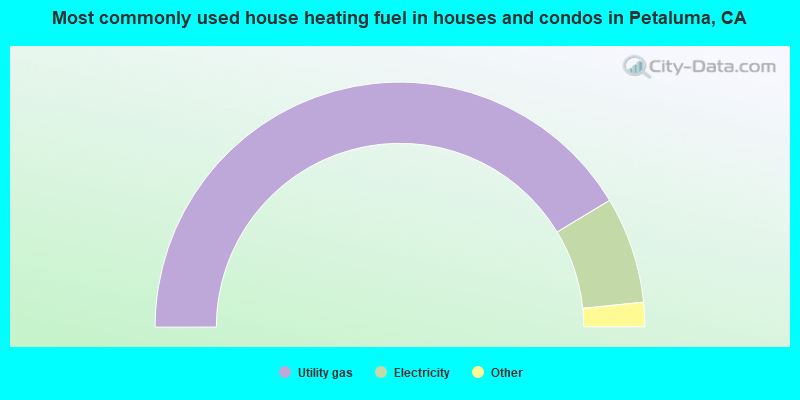
- 82.7%Utility gas
- 14.1%Electricity
- 1.4%Solar energy
- 1.1%Bottled, tank, or LP gas
- 0.4%Wood
- 0.3%No fuel used
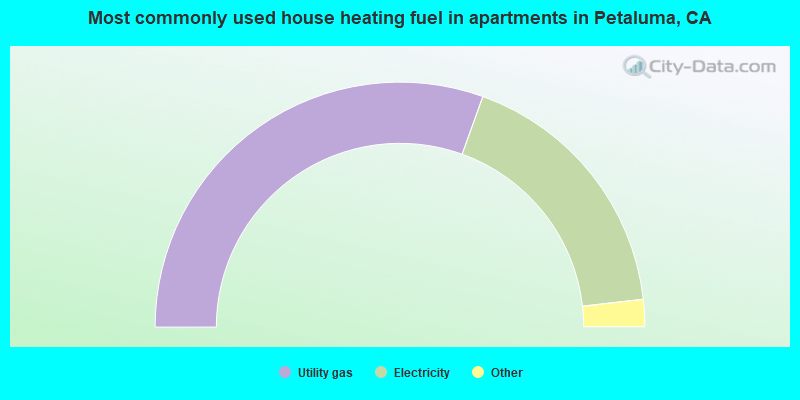
- 61.0%Utility gas
- 35.4%Electricity
- 2.1%Bottled, tank, or LP gas
- 0.9%Wood
- 0.6%No fuel used
Private vs. public school enrollment:
| Here: | 5.3% |
| California: | 10.5% |
| Here: | 5.2% |
| California: | 8.5% |
| Here: | 7.4% |
| California: | 15.9% |


