Pflugerville, TX (Texas) Houses and Residents
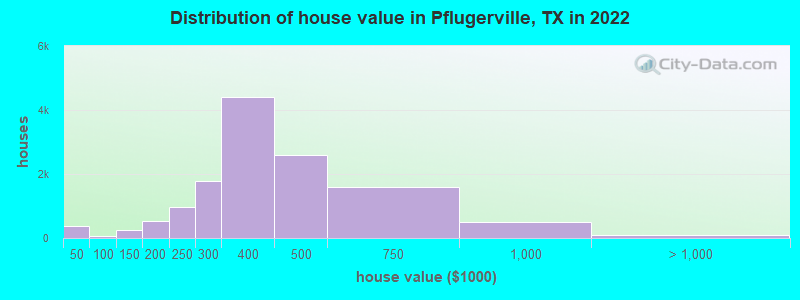
Estimated median house or condo value in 2022: $408,300 (it was $132,200 in 2000 )
Pflugerville:
$408,300Texas:
$275,400
Lower value quartile - upper value quartile: $308,000 - $552,500Mean price in 2022: Detached houses: $331,016 Here:
$331,016State:
$369,058
Townhouses or other attached units: $156,298 Here:
$156,298State:
$327,631
Mobile homes: $100,121 Here:
$100,121State:
$124,413
Total population: 54,644 (Urban population: 16,235, Rural population: 131 (all nonfarm) )
Houses: 24,879 (24,091 occupied: 16,179 owner occupied, 7,912 renter occupied )
% of renters here:
33%State:
38%
Housing density: 2,194 houses/condos per square mile
Median price asked for vacant for-sale houses and condos in 2022: $268,279.
Median contract rent in 2022: $1,692 (lower quartile is $1,375, upper quartile is over $2,000)
Median rent asked for vacant for-rent units in 2022: $1,711
Median gross rent in Pflugerville, TX in 2022: over $2,000
Housing units in Pflugerville with a mortgage: 14,158 (519 second mortgage, 0 home equity loan, 419 both second mortgage and home equity loan )Houses without a mortgage: 407
Median household income for houses/condos with a mortgage: $127,282
Median household income for apartments without a mortgage: $105,452
Median monthly housing costs: $1,801
Data:
Median house or condo value ($)
Median house or condo value ($ change since 2000)
Median house or condo value ($) - White
Median house or condo value ($) - Black or African American
Median house or condo value ($) - Asian
Median house or condo value ($) - Hispanic or Latino
Median house or condo value ($) - American Indian and Alaska Native
Median house or condo value ($) - Multirace
Median house or condo value ($) - Other Race
Median price asked for mobile homes ($)
Household density (households per square mile)
Mean house or condo value by units in structure - 1, detached ($)
Mean house or condo value by units in structure - 1, attached ($)
Mean house or condo value by units in structure - 2 ($)
Mean house or condo value by units in structure by units in structure - 3 or 4 ($)
Mean house or condo value by units in structure - 5 or more ($)
Mean house or condo value by units in structure - Boat, RV, van, etc. ($)
Mean house or condo value by units in structure - Mobile home ($)
Median contract rent ($)
Median contract rent - Lower quartile ($)
Median contract rent - Upper quartile ($)
Median gross rent ($)
Urban houses (%)
Rural houses (%)
Houses occupied (%)
Houses occupied (% change since 2000)
Houses owner occupied (%)
Houses owner occupied (% change since 2000)
Houses renter occupied (%)
Houses renter occupied (% change since 2000)
Vacant housing units - For rent (%)
Vacant housing units - For rent (% change since 2000)
Vacant housing units - For sale only (%)
Vacant housing units - For sale only (% change since 2000)
Vacant housing units - Rented or sold, not occupied (%)
Vacant housing units - Rented or sold, not occupied (% change since 2000)
Vacant housing units - For seasonal, recreational, or occasional use (%)
Vacant housing units - For seasonal, recreational, or occasional use (% change since 2000)
Vacant housing units - For migrant workers (%)
Vacant housing units - For migrant workers (% change since 2000)
Vacant housing units - Other vacant (%)
Vacant housing units - Other vacant (% change since 2000)
Median monthly housing costs ($)
Median household income for houses/condos with a mortgage ($)
Median household income for houses/condos without a mortgage ($)
Median household income ($)
Median household income ($) - White
Median household income ($) - Black or African American
Median household income ($) - Asian
Median household income ($) - Hispanic or Latino
Median household income ($) - American Indian and Alaska Native
Median household income ($) - Multirace
Median household income ($) - Other Race
Mortgage status - with mortgage (%)
Mortgage status - with second mortgage (%)
Mortgage status - with home equity loan (%)
Mortgage status - with both second mortgage and home equity loan (%)
Mortgage status - without a mortgage (%)
Median year house/condo built
Median year apartment built
Household type by relationship - Male householder living alone (%)
Household type by relationship - Male householder not living alone (%)
Household type by relationship - Female householder living alone (%)
Household type by relationship - Female householder not living alone (%)
Household type by relationship - Opposite-Sex spouse (%)
Household type by relationship - Same-Sex spouse (%)
Household type by relationship - Opposite-Sex unmarried partner (%)
Household type by relationship - Same-Sex unmarried partner (%)
Household type by relationship - In group quarters (%)
Size of family households - 2-person household (%)
Size of family households - 3-person household (%)
Size of family households - 4-person household (%)
Size of family households - 5-person household (%)
Size of family households - 6-person household (%)
Size of family households - 7-or-more-person household (%)
Size of nonfamily households - 1-person household (%)
Size of nonfamily households - 2-person household (%)
Size of nonfamily households - 3-person household (%)
Size of nonfamily households - 4-person household (%)
Size of nonfamily households - 5-person household (%)
Size of nonfamily households - 6-person household (%)
Size of nonfamily households - 7-or-moreperson household (%)
Year house built - Built 2010 or later (%)
Year house built - Built 2000 to 2009 (%)
Year house built - Built 1990 to 1999 (%)
Year house built - Built 1980 to 1989 (%)
Year house built - Built 1970 to 1979 (%)
Year house built - Built 1960 to 1969 (%)
Year house built - Built 1950 to 1959 (%)
Year house built - Built 1940 to 1949 (%)
Year house built - Built 1939 or earlier (%)
Median number of rooms in houses and condos
Median number of rooms in apartments
Median number of bedrooms in owner occupied houses
Mean number of bedrooms in owner occupied houses
Median number of bedrooms in renter occupied houses
Mean number of bedrooms in renter occupied houses
Median number of vehichles in owner occupied houses
Mean number of vehichles in owner occupied houses
Median number of vehichles in renter occupied houses
Mean number of vehichles in renter occupied houses
Rooms in owner-occupied houses - 1 room (%)
Rooms in owner-occupied houses - 2 rooms (%)
Rooms in owner-occupied houses - 3 rooms (%)
Rooms in owner-occupied houses - 4 rooms (%)
Rooms in owner-occupied houses - 5 rooms (%)
Rooms in owner-occupied houses - 6 rooms (%)
Rooms in owner-occupied houses - 7 rooms (%)
Rooms in owner-occupied houses - 8 rooms (%)
Rooms in owner-occupied houses - 9+ rooms (%)
Rooms in renter-occupied houses - 1 room (%)
Rooms in renter-occupied houses - 2 rooms (%)
Rooms in renter-occupied houses - 3 rooms (%)
Rooms in renter-occupied houses - 4 rooms (%)
Rooms in renter-occupied houses - 5 rooms (%)
Rooms in renter-occupied houses - 6 rooms (%)
Rooms in renter-occupied houses - 7 rooms (%)
Rooms in renter-occupied houses - 8 rooms (%)
Rooms in renter-occupied houses - 9+ rooms (%)
Bedrooms in owner-occupied houses - no bedrooms (%)
Bedrooms in owner-occupied houses - 1 bedroom (%)
Bedrooms in owner-occupied houses - 2 bedrooms (%)
Bedrooms in owner-occupied houses - 3 bedrooms (%)
Bedrooms in owner-occupied houses - 4 bedrooms (%)
Bedrooms in owner-occupied houses - 5+ bedrooms (%)
Bedrooms in renter-occupied houses - no bedrooms (%)
Bedrooms in renter-occupied houses - 1 bedroom (%)
Bedrooms in renter-occupied houses - 2 bedrooms (%)
Bedrooms in renter-occupied houses - 3 bedrooms (%)
Bedrooms in renter-occupied houses - 4 bedrooms (%)
Bedrooms in renter-occupied houses - 5+ bedrooms (%)
Vehicles available in owner-occupied houses - no vehicle available (%)
Vehicles available in owner-occupied houses - 1 vehicle available(%)
Vehicles available in owner-occupied houses - 2 Vehicles available (%)
Vehicles available in owner-occupied houses - 3 Vehicles available (%)
Vehicles available in owner-occupied houses - 4 Vehicles available (%)
Vehicles available in owner-occupied houses - 5+ Vehicles available (%)
Vehicles available in renter-occupied houses - no vehicle available (%)
Vehicles available in renter-occupied houses - 1 vehicle available (%)
Vehicles available in renter-occupied houses - 2 Vehicles available (%)
Vehicles available in renter-occupied houses - 3 Vehicles available (%)
Vehicles available in renter-occupied houses - 4 Vehicles available (%)
Vehicles available in renter-occupied houses - 5+ Vehicles available (%)
Housing units in structures - 1, detached (%)
Housing units in structures - 1, attached (%)
Housing units in structures - 2 (%)
Housing units in structures - 3 or 4 (%)
Housing units in structures - 5 to 9 (%)
Housing units in structures - 10 to 19 (%)
Housing units in structures - 20 to 49 (%)
Housing units in structures - 50 or more (%)
Housing units in structures - Mobile home (%)
Housing units in structures - Boat, RV, van, etc. (%)
Housing units in structures - Owners - 1, detached (%)
Housing units in structures - Owners - 1, attached (%)
Housing units in structures - Owners - 2 (%)
Housing units in structures - Owners - 3 or 4 (%)
Housing units in structures - Owners - 5 to 9 (%)
Housing units in structures - Owners - 10 to 19 (%)
Housing units in structures - Owners - 20 to 49 (%)
Housing units in structures - Owners - 50 or more (%)
Housing units in structures - Owners - Mobile home (%)
Housing units in structures - Owners - Boat, RV, van, etc. (%)
Housing units in structures - Renters - 1, detached (%)
Housing units in structures - Renters - 1, attached (%)
Housing units in structures - Renters - 2 (%)
Housing units in structures - Renters - 3 or 4 (%)
Housing units in structures - Renters - 5 to 9 (%)
Housing units in structures - Renters - 10 to 19 (%)
Housing units in structures - Renters - 20 to 49 (%)
Housing units in structures - Renters - 50 or more (%)
Housing units in structures - Renters - Mobile home (%)
Housing units in structures - Renters - Boat, RV, van, etc. (%)
House/condo owner moved in on average (years ago)
Renter moved in on average (years ago)
Year householder moved into unit - Moved in 1999 to March 2000 (%)
Year householder moved into unit - Moved in 1999 to March 2000 (%) - White
Year householder moved into unit - Moved in 1999 to March 2000 (%) - Black or African American
Year householder moved into unit - Moved in 1999 to March 2000 (%) - Asian
Year householder moved into unit - Moved in 1999 to March 2000 (%) - Hispanic or Latino
Year householder moved into unit - Moved in 1999 to March 2000 (%) - American Indian and Alaska Native
Year householder moved into unit - Moved in 1999 to March 2000 (%) - Multirace
Year householder moved into unit - Moved in 1999 to March 2000 (%) - Other Race
Year householder moved into unit - Moved in 1995 to 1998 (%)
Year householder moved into unit - Moved in 1995 to 1998 (%) - White
Year householder moved into unit - Moved in 1995 to 1998 (%) - Black or African American
Year householder moved into unit - Moved in 1995 to 1998 (%) - Asian
Year householder moved into unit - Moved in 1995 to 1998 (%) - Hispanic or Latino
Year householder moved into unit - Moved in 1995 to 1998 (%) - American Indian and Alaska Native
Year householder moved into unit - Moved in 1995 to 1998 (%) - Multirace
Year householder moved into unit - Moved in 1995 to 1998 (%) - Other Race
Year householder moved into unit - Moved in 1990 to 1994 (%)
Year householder moved into unit - Moved in 1990 to 1994 (%) - White
Year householder moved into unit - Moved in 1990 to 1994 (%) - Black or African American
Year householder moved into unit - Moved in 1990 to 1994 (%) - Asian
Year householder moved into unit - Moved in 1990 to 1994 (%) - Hispanic or Latino
Year householder moved into unit - Moved in 1990 to 1994 (%) - American Indian and Alaska Native
Year householder moved into unit - Moved in 1990 to 1994 (%) - Multirace
Year householder moved into unit - Moved in 1990 to 1994 (%) - Other Race
Year householder moved into unit - Moved in 1980 to 1989 (%)
Year householder moved into unit - Moved in 1980 to 1989 (%) - White
Year householder moved into unit - Moved in 1980 to 1989 (%) - Black or African American
Year householder moved into unit - Moved in 1980 to 1989 (%) - Asian
Year householder moved into unit - Moved in 1980 to 1989 (%) - Hispanic or Latino
Year householder moved into unit - Moved in 1980 to 1989 (%) - American Indian and Alaska Native
Year householder moved into unit - Moved in 1980 to 1989 (%) - Multirace
Year householder moved into unit - Moved in 1980 to 1989 (%) - Other Race
Year householder moved into unit - Moved in 1970 to 1979 (%)
Year householder moved into unit - Moved in 1970 to 1979 (%) - White
Year householder moved into unit - Moved in 1970 to 1979 (%) - Black or African American
Year householder moved into unit - Moved in 1970 to 1979 (%) - Asian
Year householder moved into unit - Moved in 1970 to 1979 (%) - Hispanic or Latino
Year householder moved into unit - Moved in 1970 to 1979 (%) - American Indian and Alaska Native
Year householder moved into unit - Moved in 1970 to 1979 (%) - Multirace
Year householder moved into unit - Moved in 1970 to 1979 (%) - Other Race
Year householder moved into unit - Moved in 1969 or earlier (%)
Year householder moved into unit - Moved in 1969 or earlier (%) - White
Year householder moved into unit - Moved in 1969 or earlier (%) - Black or African American
Year householder moved into unit - Moved in 1969 or earlier (%) - Asian
Year householder moved into unit - Moved in 1969 or earlier (%) - Hispanic or Latino
Year householder moved into unit - Moved in 1969 or earlier (%) - American Indian and Alaska Native
Year householder moved into unit - Moved in 1969 or earlier (%) - Multirace
Year householder moved into unit - Moved in 1969 or earlier (%) - Other Race
Housing units lacking complete plumbing facilities (%)
Housing units lacking complete kitchen facilities (%)
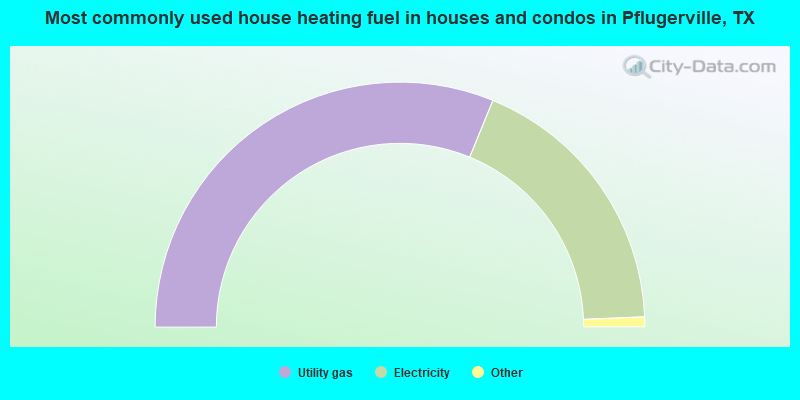
House heating fuel used in houses and condos - Utility gas (%)
House heating fuel used in houses and condos - Bottled, tank, or LP gas (%)
House heating fuel used in houses and condos - Electricity (%)
House heating fuel used in houses and condos - Fuel oil, kerosene, etc. (%)
House heating fuel used in houses and condos - Coal or coke (%)
House heating fuel used in houses and condos - Wood (%)
House heating fuel used in houses and condos - Solar energy (%)
House heating fuel used in houses and condos - Other fuel (%)
House heating fuel used in houses and condos - No fuel used (%)
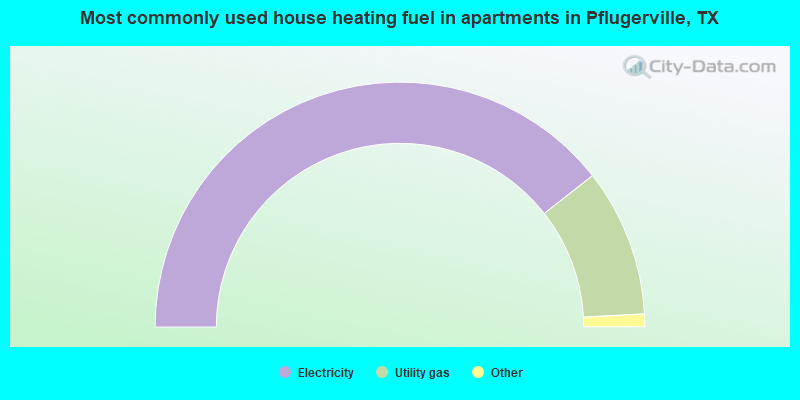
House heating fuel used in apartments - Utility gas (%)
House heating fuel used in apartments - Bottled, tank, or LP gas (%)
House heating fuel used in apartments - Electricity (%)
House heating fuel used in apartments - Fuel oil, kerosene, etc. (%)
House heating fuel used in apartments - Coal or coke (%)
House heating fuel used in apartments - Wood (%)
House heating fuel used in apartments - Solar energy (%)
House heating fuel used in apartments - Other fuel (%)
House heating fuel used in apartments - No fuel used (%)
Latest news about housing in Pflugerville, TX collected exclusively by city-data.com from local newspapers, TV, and radio stations
Median year house/condo built: 2001Median year apartment built: 2010Household type by relationship:
Households: 65,374
Male householders: 12,352 (2,073 living alone ), Female householders: 11,739 (3,914 living alone )12,699 spouses (12,665 opposite-sex spouses ), 2,731 unmarried partners , (2,599 opposite-sex unmarried partners ), 20,214 children (16,515 natural , 1,344 adopted , 2,355 stepchildren ), 1,382 grandchildren , 280 brothers or sisters , 472 parents , 0 foster children , 1,020 other relatives , 2,151 non-relatives In group quarters: 334
Size of family households: 5,079 2-persons , 5,441 3-persons , 2,738 4-persons , 986 5-persons , 1,222 6-persons , 464 7-or-more-persons .
Size of nonfamily households: 5,987 1-person , 1,566 2-persons , 480 3-persons , 128 5-persons .
11,214 married couples with children. single-parent households (1,144 men , 1,695 women ).
72.2% of residents of Pflugerville speak English at home. of residents speak Spanish at home (67% speak English very well , 19% speak English well , 14% speak English not well , 1% don't speak English at all ).of residents speak other Indo-European language at home (85% speak English very well , 15% speak English well ).of residents speak Asian or Pacific Island language at home (62% speak English very well , 25% speak English well , 9% speak English not well , 4% don't speak English at all ).of residents speak other language at home (94% speak English very well , 4% speak English well , 2% speak English not well ).
Foreign born population: 12,451 (19.0%)of them are naturalized citizens )
Median number of rooms in houses and condos:
Median number of rooms in apartments
Owner-occupied Renter-occupied
Bedrooms in owner-occupied houses and condos in Pflugerville, Texas
59 no bedroom 0 1 bedroom 1,527 2 bedrooms 7,835 3 bedrooms 5,599 4 bedrooms 1,159 5+ bedrooms
Bedrooms in renter-occupied apartments in Pflugerville, Texas
126 no bedroom 1,927 1 bedroom 1,321 2 bedrooms 3,013 3 bedrooms 1,397 4 bedrooms 128 5+ bedrooms
Owner-occupied Renter-occupied
Rooms in owner-occupied houses in Pflugerville, Texas
0 1 room 59 2 rooms 64 3 rooms 1,315 4 rooms 3,494 5 rooms 3,807 6 rooms 2,626 7 rooms 2,665 8 rooms 2,149 9+ rooms
Rooms in renter-occupied apartments in Pflugerville, Texas
126 1 room 879 2 rooms 876 3 rooms 2,620 4 rooms 1,034 5 rooms 1,067 6 rooms 742 7 rooms 168 8 rooms 400 9+ rooms
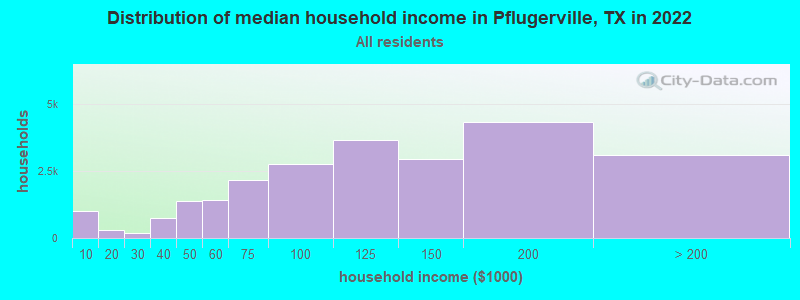
Pflugerville, TX household income distribution 1,025 Less than $10,000298 $10,000 to $19,999170 $20,000 to $29,999748 $30,000 to $39,9991,388 $40,000 to $49,9991,435 $50,000 to $59,9992,152 $60,000 to $74,9992,780 $75,000 to $99,9993,675 $100,000 to $124,9992,970 $125,000 to $149,9994,335 $150,000 to $199,9993,115 $200,000 or more
Home value of owner - occupied houses in 2022 in Pflugerville, TX 48 Less than $10,00039 $15,000 to $19,99965 $20,000 to $24,999131 $25,000 to $29,9996 $30,000 to $34,99936 $35,000 to $39,99950 $40,000 to $49,9997 $50,000 to $59,9997 $60,000 to $69,9990 $90,000 to $99,999168 $100,000 to $124,99988 $125,000 to $149,999373 $150,000 to $174,999158 $175,000 to $199,999964 $200,000 to $249,9991,784 $250,000 to $299,9994,412 $300,000 to $399,9992,588 $400,000 to $499,9991,583 $500,000 to $749,999513 $750,000 to $999,99945 $1,000,000 to $1,499,99960 $2,000,000 or moreRent paid by renters in 2022 in Pflugerville, TX 15 Less than $10014 $100 to $14932 $150 to $19934 $250 to $2996 $300 to $34963 $550 to $599111 $700 to $74934 $750 to $79916 $800 to $89963 $900 to $9991,345 $1,000 to $1,2491,554 $1,250 to $1,4992,314 $1,500 to $1,9991,004 $2,000 to $2,499583 $2,500 to $2,999141 No cash rent
Percentage of workers working in this county: 81.1%Number of people working at home: 10,079 (26.0% of all workers )
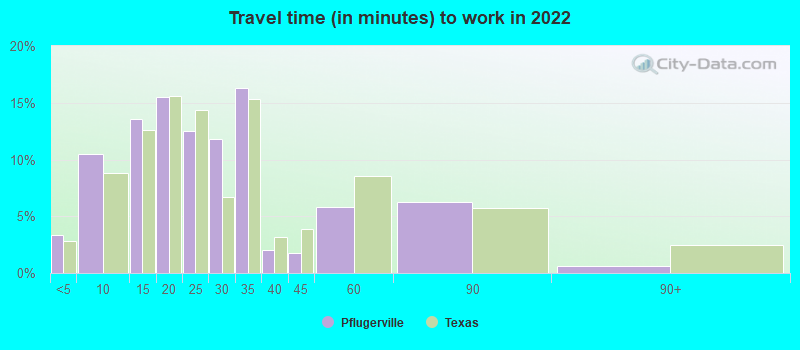
Travel time to work (commute)
Less than 5 minutes: 7465 to 9 minutes: 1,23810 to 14 minutes: 2,72015 to 19 minutes: 3,64620 to 24 minutes: 5,56625 to 29 minutes: 1,98730 to 34 minutes: 5,83535 to 39 minutes: 1,37640 to 44 minutes: 77145 to 59 minutes: 88760 to 89 minutes: 1,17490 or more minutes: 191
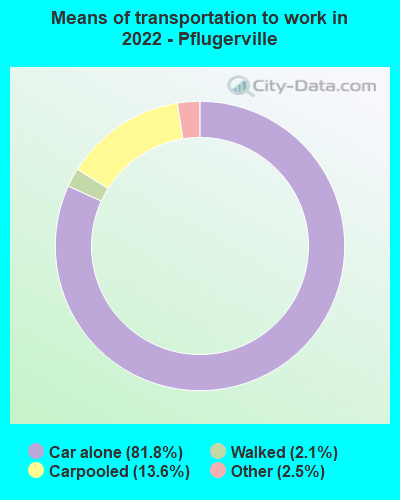
Means of transportation to work:
Drove a car alone: 12,082 (51.2%)Carpooled: 2,032 (8.6%)Taxi: 451 (1.9%)Walked: 340 (1.4%)Worked at home: 10,079 (42.7%)
Unemployment by race in 2022
Unemployment rate for White non-Hispanic residents 1.2% Males5.3% FemalesUnemployment rate for Black residents 1.8% Males2.6% FemalesUnemployment rate for Asian residents 1.9% Males1.2% FemalesUnemployment rate for other race residents 1.3% FemalesUnemployment rate for two or more race residents 3.0% Males1.4% FemalesUnemployment rate for Hispanic or Latino residents 2.4% Males4.2% Females
Year of entry for the foreign-born population in Pflugerville, Texas
2,709 2010 or later 1,515 2000 to 2009 3,129 1990 to 1999 436 1980 to 1989 216 1970 to 1979 95 Before 1970
First ancestries reported:
English: 2,371 (7.0%)
American: 1,843 (5.4%)
German: 1,198 (3.5%)
Jordanian: 1,024 (3.0%)
European: 771 (2.3%)
Irish: 573 (1.7%)
Italian: 501 (1.5%)
Scottish: 355 (1.0%)
African: 349 (1.0%)
Eastern European: 333 (1.0%)
French Canadian: 165 (0.5%)
Norwegian: 161 (0.5%)
French: 156 (0.5%)
Polish: 140 (0.4%)
Nigerian: 130 (0.4%)
British: 116 (0.3%)
Lebanese: 115 (0.3%)
Swedish: 105 (0.3%)
Scotch-Irish: 82 (0.2%)
Belizean: 76 (0.2%)
Welsh: 71 (0.2%)
Czech: 65 (0.2%)
Brazilian: 61 (0.2%)
Icelander: 58 (0.2%)
Arab: 57 (0.2%)
Moroccan: 51 (0.2%)
Northern European: 50 (0.1%)
Portuguese: 50 (0.1%)
Czechoslovakian: 47 (0.1%)
Russian: 43 (0.1%)
Haitian: 39 (0.1%)
Turkish: 32 (0.09%)
Palestinian: 31 (0.09%)
Ukrainian: 29 (0.09%)
Slovene: 28 (0.08%)
Yugoslavian: 22 (0.06%)
Slavic: 19 (0.06%)
Dutch: 13 (0.04%)
Finnish: 10 (0.03%)
Iranian: 9 (0.03%)
Scandinavian: 9 (0.03%)
Serbian: 9 (0.03%)
Hungarian: 9 (0.03%)
Greek: 9 (0.03%)
Canadian: 3 (0.01%) Most common places of birth for foreign-born residents (%): Mexico Pflugerville:
31.6% (3,347)Texas:
48.4% (2,411,723)
Vietnam Pflugerville:
9.0% (954)Texas:
3.7% (184,770)
India Pflugerville:
8.0% (853)Texas:
6.1% (306,347)
Cuba Pflugerville:
6.5% (690)Texas:
1.3% (62,978)
Pakistan Pflugerville:
4.6% (489)Texas:
1.2% (62,159)
Nigeria Pflugerville:
4.2% (444)Texas:
1.9% (96,110)
England Pflugerville:
3.2% (340)Texas:
0.4% (20,885)
Germany Pflugerville:
3.2% (340)Texas:
0.8% (37,989)
Uruguay Pflugerville:
2.9% (304)Texas:
0.1% (2,774)
El Salvador Pflugerville:
2.6% (275)Texas:
4.5% (224,455)
Honduras Pflugerville:
2.2% (236)Texas:
3.0% (147,182)
Jordan Pflugerville:
1.9% (204)Texas:
0.2% (8,922)
Venezuela Pflugerville:
1.5% (164)Texas:
1.5% (72,413)
Place of birth for U.S.-born residents:
This state: 34,055Other state: 17,870Northeast: 4,099Midwest: 5,332South: 3,817West: 4,622 88.1% of Pflugerville residents lived in the same house 1 years ago.
Out of people who lived in different houses, 34.2% lived in this county.
Out of people who lived in different counties, 57.4% lived in Texas.
Pflugerville:
88.1%State average:
85.7%
Education attainment for males 25 years and older:
No schooling: 931Nursery to 4th grade: 05th and 6th grade: 947th and 8th grade: 09th grade: 6510th grade: 12211th grade: 21612th grade, no diploma: 1,475High school graduate (or equivalency): 3,944Less than 1 year of college: 987Some college more than 1 year, no degree: 3,763Associate degree: 1,922Bachelor's degree: 5,570Master's degree: 3,348Professional school degree: 433Doctorate degree: 200
Education attainment for females 25 years and older:
No schooling: 653Nursery to 4th grade: 435th and 6th grade: 1467th and 8th grade: 6479th grade: 010th grade: 011th grade: 9612th grade, no diploma: 585High school graduate (or equivalency): 3,553Less than 1 year of college: 1,579Some college more than 1 year, no degree: 4,472Associate degree: 1,855Bachelor's degree: 5,825Master's degree: 2,527Professional school degree: 478Doctorate degree: 285
Housing units in structures:
One, detached: 17,663One, attached: 1,111Two: 2293 or 4: 7775 to 9: 1,54510 to 19: 1,79620 to 49: 94050 or more: 204Mobile homes: 614Housing units lacking complete plumbing facilities in 2022: 0.7%Housing units lacking complete kitchen facilities in 2022: 1.0%House/condo owner moved in on average 10 years ago
Renter moved in on average 3 years ago
Private vs. public school enrollment:
Students in private schools in grades 1 to 8 (elementary and middle school): 259 Students in private schools in grades 9 to 12 (high school): 485 Students in private undergraduate colleges: 327