Travilah, MD (Maryland) Houses and Residents
| Travilah: | $1,247,393 |
| Maryland: | $398,100 |
Mean price in 2022:
Detached houses: $1,865,085
Here: $1,865,085 State: $526,819 Townhouses or other attached units: $1,068,025
Here: $1,068,025 State: $328,305
Total population: 12,159 (Urban population: 7,016, Rural population: 533 (all nonfarm))
Houses: 3,911 (3,732 occupied: 3,614 owner occupied, 146 renter occupied)
| % of renters here: | 4% |
| State: | 32% |
Housing density: 272 houses/condos per square mile
Median price asked for vacant for-sale houses and condos in 2022: $2,225,358.
Median contract rent in 2022: over $2,000 (lower quartile is over $2,000, upper quartile is over $2,000)
Median rent asked for vacant for-rent units in 2022: $3,291
Median gross rent in Travilah, MD in 2022: over $2,000
Housing units in Travilah with a mortgage: 2,474 (378 second mortgage, 11 home equity loan, 354 both second mortgage and home equity loan)
Houses without a mortgage: 46
Median household income for houses/condos with a mortgage: $241,073
Median household income for apartments without a mortgage: $176,094
Median monthly housing costs: $3,500
Compare current foreclosures near Travilah, MD:
| Photo | Address | Area | Beds / Baths | Price | Details |
|---|---|---|---|---|---|

|
#1
Wilson Ln Apt 204
Mc Lean, VA 22102
|
925 sq. feet
|
1 baths 2 beds |
$359,900
|
show details |

|
#2
Pooks Hill Rd Apt 1612s
Bethesda, MD 20814
|
1,250 sq. feet
|
1 baths 2 beds |
$289,000
|
show details |

|
#3
9th St NW
Washington, DC 20011
|
1,604 sq. feet
|
2 baths 3 beds |
$598,000
|
show details |

|
#4
Brooke Knolls Rd
Gaithersburg, MD 20882
|
1,704 sq. feet
|
3 baths 4 beds |
$681,500
|
show details |

|
#5
17th St NW Apt 504
Washington, DC 20009
|
800 sq. feet
|
1 baths 1 beds |
$405,000
|
show details |

|
#6
Cathedral Ave NW Apt 108
Washington, DC 20016
|
765 sq. feet
|
1 baths 1 beds |
$269,900
|
show details |

|
#7
19th St NW
Washington, DC 20036
|
2,515 sq. feet
|
6 baths 8 beds |
$1,684,800
|
show details |

|
#8
Interlachen Dr Apt 111
Silver Spring, MD 20906
|
965 sq. feet
|
1 baths 2 beds |
$148,000
|
show details |

|
#9
Eastern Ave NE
Washington, DC 20011
|
1,024 sq. feet
|
1 baths 3 beds |
$395,000
|
show details |

|
#10
Monroe St NW
Washington, DC 20010
|
- sq. feet
|
2 baths 2 beds |
$665,000
|
show details |
| Photo | Address | Area | Beds / Baths | Price | Details |
|---|---|---|---|---|---|

|
#11
Hammersmith Cir
Silver Spring, MD 20906
|
1,152 sq. feet
|
1 baths 3 beds |
$353,600
|
show details |

|
#12
Caledonia Ct Apt K
Germantown, MD 20874
|
1,087 sq. feet
|
2 baths 2 beds |
show details | |

|
#13
Holbrook Ter NE
Washington, DC 20002
|
3,164 sq. feet
|
4 baths 8 beds |
show details | |

|
#14
Collis Oak Ct
Fairfax, VA 22033
|
1,362 sq. feet
|
3 baths 3 beds |
show details | |

|
#15
Tremayne Pl Apt 309
Mc Lean, VA 22102
|
1,180 sq. feet
|
2 baths 2 beds |
show details | |

|
#16
16th St NW Apt 305
Washington, DC 20009
|
1,158 sq. feet
|
1 baths 2 beds |
show details | |

|
#17
Morse St NE
Washington, DC 20002
|
1,836 sq. feet
|
2 baths 3 beds |
show details | |

|
#18
Jefferson St NW
Washington, DC 20011
|
1,280 sq. feet
|
5 baths 6 beds |
show details | |

|
#19
Willoughby Ct
Chantilly, VA 20151
|
950 sq. feet
|
2 baths 4 beds |
show details | |

|
#20
Sargent Rd NE
Washington, DC 20017
|
1,360 sq. feet
|
2 baths 3 beds |
show details |
| Photo | Address | Area | Beds / Baths | Price | Details |
|---|---|---|---|---|---|

|
#21
Connecticut Ave NW Apt 606
Washington, DC 20008
|
160 sq. feet
|
1 baths 1 beds |
show details | |

|
#22
Berryville Rd
Germantown, MD 20874
|
960 sq. feet
|
1 baths 3 beds |
show details | |

|
#23
Brooke Rd
Sandy Spring, MD 20860
|
5,046 sq. feet
|
4 baths 4 beds |
show details | |

|
#24
Counsellor Dr
Vienna, VA 22181
|
1,916 sq. feet
|
2 baths 5 beds |
show details | |

|
#25
Plainfield St
Falls Church, VA 22043
|
1,102 sq. feet
|
3 baths 4 beds |
show details | |

|
#26
Arkansas Ave
Herndon, VA 20170
|
1,025 sq. feet
|
1 baths 3 beds |
show details | |

|
#27
Lee Landing Dr
Falls Church, VA 22043
|
900 sq. feet
|
1 baths 2 beds |
show details | |

|
#28
13th Ave
Hyattsville, MD 20782
|
1,598 sq. feet
|
1 baths 4 beds |
show details | |

|
#29
Pearl Fog Way
Dunn Loring, VA 22027
|
3,497 sq. feet
|
4 baths 4 beds |
show details | |

|
#30
Rhode Island Ave NW Apt 202
Washington, DC 20005
|
604 sq. feet
|
1 baths 1 beds |
show details |
| Photo | Address | Area | Beds / Baths | Price | Details |
|---|---|---|---|---|---|

|
#31
Cypress Tree Pl
Herndon, VA 20170
|
1,456 sq. feet
|
2 baths 3 beds |
show details | |

|
#32
Cathedral Ave NW Apt 404w
Washington, DC 20016
|
803 sq. feet
|
1 baths 1 beds |
show details | |

|
#33
Navahoe St
Hyattsville, MD 20783
|
1,068 sq. feet
|
2 baths 3 beds |
show details | |

|
#34
Lakeland Dr
Sterling, VA 20164
|
2,143 sq. feet
|
2 baths 3 beds |
show details | |

|
#35
Avena St
Silver Spring, MD 20902
|
1,188 sq. feet
|
2 baths 3 beds |
show details | |

|
#36
Dana Dr
Hyattsville, MD 20783
|
2,380 sq. feet
|
2 baths 3 beds |
show details | |

|
#37
Palmetto Cir
Germantown, MD 20874
|
1,135 sq. feet
|
2 baths 3 beds |
show details | |

|
#38
New York Ave NW Apt 402
Washington, DC 20001
|
842 sq. feet
|
1 baths 2 beds |
show details | |

|
#39
Brassie Pl Apt 201
Montgomery Village, MD 20886
|
1,054 sq. feet
|
2 baths 2 beds |
show details | |

|
#40
Blacksmith Sq
Ashburn, VA 20147
|
1,380 sq. feet
|
4 baths 3 beds |
show details |
| Photo | Address | Area | Beds / Baths | Price | Details |
|---|---|---|---|---|---|

|
#41
Mcwhorter Farm Ct
Damascus, MD 20872
|
6,621 sq. feet
|
6 baths 5 beds |
show details | |

|
#42
Pine Ln
Alexandria, VA 22312
|
2,356 sq. feet
|
3 baths 3 beds |
show details | |

|
#43
S George Mason Dr Unit 918n
Falls Church, VA 22041
|
752 sq. feet
|
1 baths 1 beds |
show details | |

|
#44
Asbury Pl NW
Washington, DC 20016
|
1,813 sq. feet
|
3 baths 4 beds |
show details | |

|
#45
Pleasant Meadow Ct
Chantilly, VA 20151
|
1,294 sq. feet
|
2 baths 3 beds |
show details | |

|
#46
Goldstone Ter
Sterling, VA 20164
|
1,582 sq. feet
|
2 baths 3 beds |
show details | |

|
#47
Kings Garden Way
Falls Church, VA 22043
|
1,790 sq. feet
|
3 baths 4 beds |
show details | |

|
#48
Perry St NE
Washington, DC 20018
|
1,140 sq. feet
|
1 baths 3 beds |
show details | |

|
#49
Mossy Creek Ln
Reston, VA 20191
|
1,342 sq. feet
|
2 baths 3 beds |
show details | |

|
Check over 1 million property listings on Foreclosure.com!
|
browse all offers | |||

Latest news about housing in Travilah, MD collected exclusively by city-data.com from local newspapers, TV, and radio stations

 | Am I alone in hating Montgomery County? (258 replies) |
| Bethesda’s median income is lowest in District 1 (1 reply) |
| Rental properties in Rockville, North Potomac areas (5 replies) |
| Seeking fun family neighborhoods suburbs of DC (11 replies) |
| Relocating to the Potomac area (5 replies) |
| Fallsgrove, King Farm, or Shady Grove Crossing? (8 replies) |

Median year apartment built: 1993
Household type by relationship:
Households: 10,800- Male householders: 2,299 (212 living alone), Female householders: 1,388 (159 living alone)
2,968 spouses (2,931 opposite-sex spouses), 16 unmarried partners, (16 opposite-sex unmarried partners), 3,314 children (3,173 natural, 93 adopted, 46 stepchildren), 11 grandchildren, 148 brothers or sisters, 319 parents, 0 foster children, 179 other relatives, 151 non-relatives
- In group quarters: 2
Size of family households: 1,574 2-persons, 630 3-persons, 666 4-persons, 304 5-persons, 59 6-persons, 17 7-or-more-persons.
Size of nonfamily households: 424 1-person, 19 2-persons.
1,963 married couples with children.
139 single-parent households (14 men, 125 women).
57.8% of residents of Travilah speak English at home.
2.0% of residents speak Spanish at home (98% speak English very well, 2% speak English well).
14.4% of residents speak other Indo-European language at home (82% speak English very well, 14% speak English well, 2% speak English not well, 2% don't speak English at all).
20.8% of residents speak Asian or Pacific Island language at home (68% speak English very well, 18% speak English well, 8% speak English not well, 6% don't speak English at all).
6.2% of residents speak other language at home (97% speak English very well, 3% speak English well).
Foreign born population: 3,660 (33.9%)
(81.9% of them are naturalized citizens)
| Here: | 9.9 |
| State: | 7.3 |
| Here: | 7.0 |
| State: | 4.2 |

- Bedrooms in owner-occupied houses and condos in Travilah, Maryland
- 0no bedroom
- 191 bedroom
- 202 bedrooms
- 5083 bedrooms
- 1,3634 bedrooms
- 1,7045+ bedrooms

- Bedrooms in renter-occupied apartments in Travilah, Maryland
- 0no bedroom
- 01 bedroom
- 82 bedrooms
- 833 bedrooms
- 314 bedrooms
- 235+ bedrooms

- Cars and other vehicles available in Travilah in owner-occupied houses/condos
- 36no vehicle
- 4171 vehicle
- 1,8502 vehicles
- 9183 vehicles
- 3304 vehicles
- 635+ vehicles

- Cars and other vehicles available in Travilah in renter-occupied apartments
- 8no vehicle
- 641 vehicle
- 472 vehicles
- 273 vehicles
- 04 vehicles
- 05+ vehicles

- Rooms in owner-occupied houses in Travilah, Maryland
- 01 room
- 02 rooms
- 113 rooms
- 294 rooms
- 855 rooms
- 2446 rooms
- 2957 rooms
- 4348 rooms
- 2,5179+ rooms

- Rooms in renter-occupied apartments in Travilah, Maryland
- 01 room
- 02 rooms
- 03 rooms
- 84 rooms
- 225 rooms
- 256 rooms
- 377 rooms
- 228 rooms
- 319+ rooms


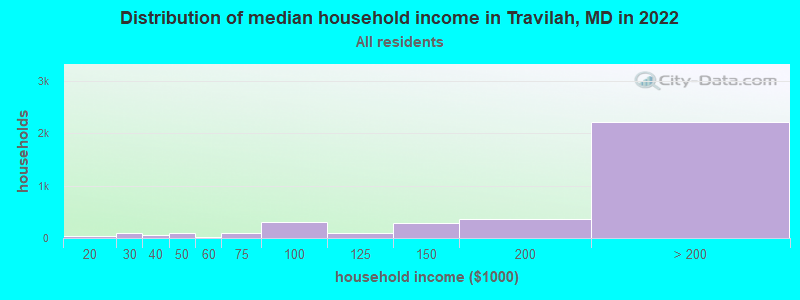
Travilah, MD household income distribution

- 15Less than $10,000
- 34$10,000 to $19,999
- 88$20,000 to $29,999
- 48$30,000 to $39,999
- 95$40,000 to $49,999
- 23$50,000 to $59,999
- 91$60,000 to $74,999
- 308$75,000 to $99,999
- 100$100,000 to $124,999
- 294$125,000 to $149,999
- 365$150,000 to $199,999
- 2,215$200,000 or more
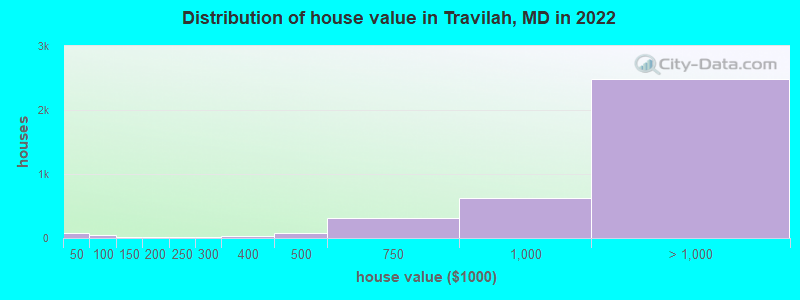
Home value of owner - occupied houses in 2022 in Travilah, MD
-
- 68Less than $10,000
- 7$10,000 to $14,999
- 51$50,000 to $59,999
- 11$100,000 to $124,999
- 6$150,000 to $174,999
- 15$175,000 to $199,999
- 12$200,000 to $249,999
- 20$250,000 to $299,999
- 26$300,000 to $399,999
- 80$400,000 to $499,999
- 308$500,000 to $749,999
- 631$750,000 to $999,999
- 1,297$1,000,000 to $1,499,999
- 623$1,500,000 to $1,999,999
- 570$2,000,000 or more
Rent paid by renters in 2022 in Travilah, MD
-
- 37$1,250 to $1,499
- 3$2,000 to $2,499
- 42$2,500 to $2,999
- 42$3,500 or more
- 9No cash rent


Percentage of workers working in this county: 78.4%
Number of people working at home: 1,940 (35.8% of all workers)

Travel time to work (commute)
- Less than 5 minutes: 33
- 5 to 9 minutes: 100
- 10 to 14 minutes: 287
- 15 to 19 minutes: 652
- 20 to 24 minutes: 491
- 25 to 29 minutes: 338
- 30 to 34 minutes: 383
- 35 to 39 minutes: 174
- 40 to 44 minutes: 254
- 45 to 59 minutes: 454
- 60 to 89 minutes: 411
- 90 or more minutes: 38
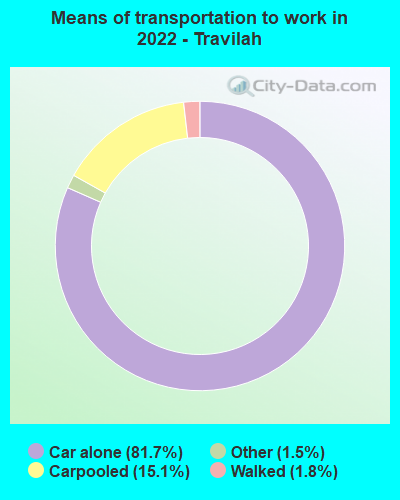
Means of transportation to work:
- Drove a car alone: 786 (30.5%)
- Carpooled: 154 (6.0%)
- Taxi: 15 (0.6%)
- Walked: 14 (0.5%)
- Worked at home: 1,940 (75.3%)

- Unemployment by race in 2022
- Unemployment rate for White non-Hispanic residents
- 2.6%Males
- 0.7%Females
- Unemployment rate for Black residents
- 5.2%Males
- 12.8%Females
- Unemployment rate for Asian residents
- 5.3%Males
- 3.8%Females

- Year of entry for the foreign-born population in Travilah, Maryland
- 4342010 or later
- 5762000 to 2009
- 8271990 to 1999
- 3691980 to 1989
- 3911970 to 1979
- 544Before 1970

First ancestries reported:
- Iranian: 610 (9.0%)
- English: 546 (8.0%)
- German: 316 (4.6%)
- Arab: 249 (3.7%)
- Irish: 203 (3.0%)
- European: 177 (2.6%)
- American: 168 (2.5%)
- Italian: 140 (2.1%)
- Ukrainian: 109 (1.6%)
- Eastern European: 106 (1.6%)
- Nigerian: 76 (1.1%)
- Sierra Leonean: 67 (1.0%)
- Russian: 63 (0.9%)
- Armenian: 61 (0.9%)
- Polish: 60 (0.9%)
- Scottish: 59 (0.9%)
- Canadian: 54 (0.8%)
- Sudanese: 48 (0.7%)
- Greek: 36 (0.5%)
- Egyptian: 35 (0.5%)
- Norwegian: 33 (0.5%)
- Turkish: 33 (0.5%)
- Dutch: 20 (0.3%)
- Ethiopian: 17 (0.3%)
- Portuguese: 15 (0.2%)
- South African: 15 (0.2%)
- French Canadian: 11 (0.2%)
- Scotch-Irish: 11 (0.2%)
- French: 8 (0.1%)
- Welsh: 8 (0.1%)
- Brazilian: 7 (0.1%)
- Czech: 7 (0.1%)
- Lebanese: 5 (0.07%)
- Northern European: 5 (0.07%)
- Israeli: 4 (0.06%)
- Moroccan: 3 (0.04%)
Most common places of birth for foreign-born residents (%):
| Travilah: | 27.8% (1,017) |
| Maryland: | 4.6% (44,742) |
| Travilah: | 14.4% (526) |
| Maryland: | 1.3% (12,074) |
| Travilah: | 13.3% (487) |
| Maryland: | 6.4% (61,725) |
| Travilah: | 8.7% (320) |
| Maryland: | 3.4% (32,635) |
| Travilah: | 4.3% (157) |
| Maryland: | 0.9% (8,520) |
| Travilah: | 3.3% (122) |
| Maryland: | 1.9% (18,716) |
| Travilah: | 2.3% (85) |
| Maryland: | 0.9% (8,603) |
| Travilah: | 2.3% (83) |
| Maryland: | 1.0% (9,481) |
| Travilah: | 2.0% (73) |
| Maryland: | 0.5% (4,414) |
| Travilah: | 1.9% (68) |
| Maryland: | 0.2% (1,757) |
Place of birth for U.S.-born residents:
- This state: 2,528
- Other state: 4,264
- Northeast: 1,504
- Midwest: 700
- South: 1,726
- West: 288
94.3% of Travilah residents lived in the same house 1 years ago.
Out of people who lived in different houses, 30.6% lived in this county.
Out of people who lived in different counties, 48.1% lived in Maryland.
| Travilah: | 94.3% |
| State average: | 88.5% |
Education attainment for males 25 years and older:
- No schooling: 70
- Nursery to 4th grade: 0
- 5th and 6th grade: 31
- 7th and 8th grade: 0
- 9th grade: 0
- 10th grade: 0
- 11th grade: 0
- 12th grade, no diploma: 20
- High school graduate (or equivalency): 229
- Less than 1 year of college: 74
- Some college more than 1 year, no degree: 234
- Associate degree: 54
- Bachelor's degree: 964
- Master's degree: 865
- Professional school degree: 595
- Doctorate degree: 816

Education attainment for females 25 years and older:
- No schooling: 47
- Nursery to 4th grade: 0
- 5th and 6th grade: 0
- 7th and 8th grade: 26
- 9th grade: 34
- 10th grade: 0
- 11th grade: 8
- 12th grade, no diploma: 33
- High school graduate (or equivalency): 239
- Less than 1 year of college: 29
- Some college more than 1 year, no degree: 199
- Associate degree: 79
- Bachelor's degree: 1,334
- Master's degree: 1,007
- Professional school degree: 484
- Doctorate degree: 329


Housing units in structures:
- One, detached: 3,415
- One, attached: 430
- 3 or 4: 7
- 5 to 9: 6
- Mobile homes: 52
House/condo owner moved in on average 16 years ago
Renter moved in on average 7 years ago

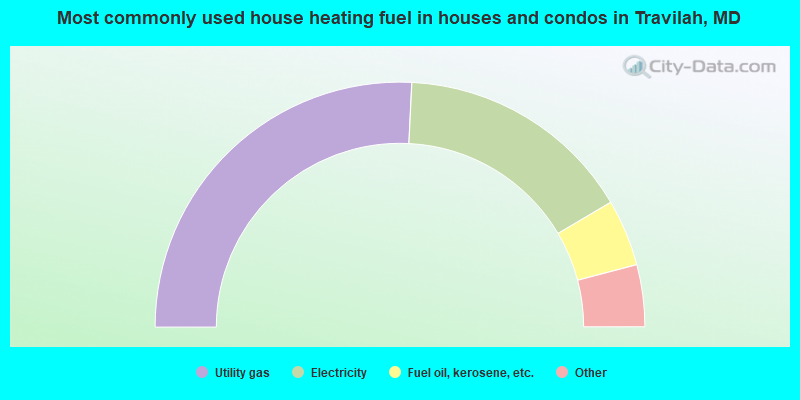
- 51.6%Utility gas
- 31.5%Electricity
- 8.8%Fuel oil, kerosene, etc.
- 3.8%Bottled, tank, or LP gas
- 3.7%Other fuel
- 0.4%No fuel used
- 0.3%Wood
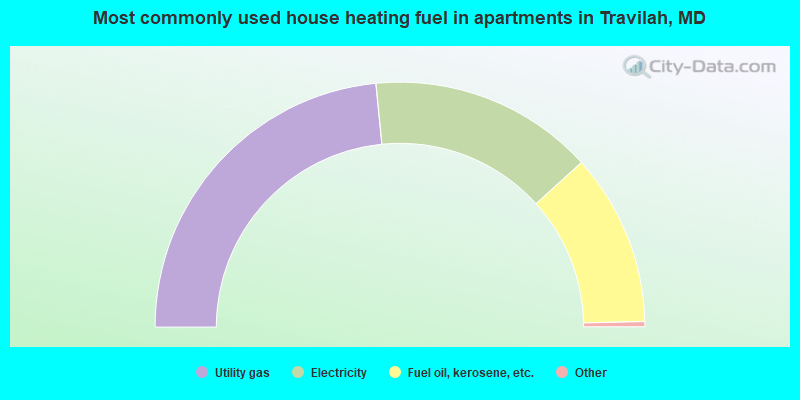
- 47.2%Utility gas
- 29.9%Electricity
- 22.9%Fuel oil, kerosene, etc.
Private vs. public school enrollment:
| Here: | 13.5% |
| Maryland: | 15.2% |
| Here: | 22.8% |
| Maryland: | 14.4% |
| Here: | 32.2% |
| Maryland: | 20.2% |


