Races in Arlington, Virginia (VA) Detailed Stats
Data:
Races - White alone (%)
Races - White alone (% change since 2000)
Races - Black alone (%)
Races - Black alone (% change since 2000)
Races - American Indian alone (%)
Races - American Indian alone (% change since 2000)
Races - Asian alone (%)
Races - Asian alone (% change since 2000)
Races - Hispanic (%)
Races - Hispanic (% change since 2000)
Races - Native Hawaiian and Other Pacific Islander alone (%)
Races - Native Hawaiian and Other Pacific Islander alone (% change since 2000)
Races - Two or more races(%)
Races - Two or more races(% change since 2000)
Races - Other race alone (%)
Races - Other race alone (% change since 2000)
Racial diversity
Place of birth - Born in state of residence (%)
Place of birth - Born in state of residence (%) - White
Place of birth - Born in state of residence (%) - Black or African American
Place of birth - Born in state of residence (%) - Asian
Place of birth - Born in state of residence (%) - Hispanic or Latino
Place of birth - Born in state of residence (%) - American Indian and Alaska Native
Place of birth - Born in state of residence (%) - Multirace
Place of birth - Born in state of residence (%) - Other Race
Place of birth - Born in other state (%)
Place of birth - Born in other state (%) - White
Place of birth - Born in other state (%) - Black or African American
Place of birth - Born in other state (%) - Asian
Place of birth - Born in other state (%) - Hispanic or Latino
Place of birth - Born in other state (%) - American Indian and Alaska Native
Place of birth - Born in other state (%) - Multirace
Place of birth - Born in other state (%) - Other Race
Place of birth - Native, outside of US (%)
Place of birth - Native, outside of US (%) - White
Place of birth - Native, outside of US (%) - Black or African American
Place of birth - Native, outside of US (%) - Asian
Place of birth - Native, outside of US (%) - Hispanic or Latino
Place of birth - Native, outside of US (%) - American Indian and Alaska Native
Place of birth - Native, outside of US (%) - Multirace
Place of birth - Native, outside of US (%) - Other Race
Place of birth - Foreign born (%)
Place of birth - Foreign born (%) - White
Place of birth - Foreign born (%) - Black or African American
Place of birth - Foreign born (%) - Asian
Place of birth - Foreign born (%) - Hispanic or Latino
Place of birth - Foreign born (%) - American Indian and Alaska Native
Place of birth - Foreign born (%) - Multirace
Place of birth - Foreign born (%) - Other Race
Residents speaking English at home (%)
Residents speaking English at home - Born in the United States (%)
Residents speaking English at home - Native, born elsewhere (%)
Residents speaking English at home - Foreign born (%)
Residents speaking Spanish at home (%)
Residents speaking Spanish at home - Born in the United States (%)
Residents speaking Spanish at home - Native, born elsewhere (%)
Residents speaking Spanish at home - Foreign born (%)
Residents speaking other language at home (%)
Residents speaking other language at home - Born in the United States (%)
Residents speaking other language at home - Native, born elsewhere (%)
Residents speaking other language at home - Foreign born (%)
Marital status - Never married (%)
Marital status - Now married (%)
Marital status - Separated (%)
Marital status - Widowed (%)
Marital status - Divorced (%)
Ancestries Reported - Arab (%)
Ancestries Reported - Czech (%)
Ancestries Reported - Danish (%)
Ancestries Reported - Dutch (%)
Ancestries Reported - English (%)
Ancestries Reported - French (%)
Ancestries Reported - French Canadian (%)
Ancestries Reported - German (%)
Ancestries Reported - Greek (%)
Ancestries Reported - Hungarian (%)
Ancestries Reported - Irish (%)
Ancestries Reported - Italian (%)
Ancestries Reported - Lithuanian (%)
Ancestries Reported - Norwegian (%)
Ancestries Reported - Polish (%)
Ancestries Reported - Portuguese (%)
Ancestries Reported - Russian (%)
Ancestries Reported - Scotch-Irish (%)
Ancestries Reported - Scottish (%)
Ancestries Reported - Slovak (%)
Ancestries Reported - Subsaharan African (%)
Ancestries Reported - Swedish (%)
Ancestries Reported - Swiss (%)
Ancestries Reported - Ukrainian (%)
Ancestries Reported - United States (%)
Ancestries Reported - Welsh (%)
Ancestries Reported - West Indian (%)
Ancestries Reported - Other (%)
Geographical mobility - Same house 1 year ago (%)
Geographical mobility - Same house 1 year ago (%) - White
Geographical mobility - Same house 1 year ago (%) - Black or African American
Geographical mobility - Same house 1 year ago (%) - Asian
Geographical mobility - Same house 1 year ago (%) - Hispanic or Latino
Geographical mobility - Same house 1 year ago (%) - American Indian and Alaska Native
Geographical mobility - Same house 1 year ago (%) - Multirace
Geographical mobility - Same house 1 year ago (%) - Other Race
Geographical mobility - Moved within same county (%)
Geographical mobility - Moved within same county (%) - White
Geographical mobility - Moved within same county (%) - Black or African American
Geographical mobility - Moved within same county (%) - Asian
Geographical mobility - Moved within same county (%) - Hispanic or Latino
Geographical mobility - Moved within same county (%) - American Indian and Alaska Native
Geographical mobility - Moved within same county (%) - Multirace
Geographical mobility - Moved within same county (%) - Other Race
Geographical mobility - Moved from different county within same state (%)
Geographical mobility - Moved from different county within same state (%) - White
Geographical mobility - Moved from different county within same state (%) - Black or African American
Geographical mobility - Moved from different county within same state (%) - Asian
Geographical mobility - Moved from different county within same state (%) - Hispanic or Latino
Geographical mobility - Moved from different county within same state (%) - American Indian and Alaska Native
Geographical mobility - Moved from different county within same state (%) - Multirace
Geographical mobility - Moved from different county within same state (%) - Other Race
Geographical mobility - Moved from different state (%)
Geographical mobility - Moved from different state (%) - White
Geographical mobility - Moved from different state (%) - Black or African American
Geographical mobility - Moved from different state (%) - Asian
Geographical mobility - Moved from different state (%) - Hispanic or Latino
Geographical mobility - Moved from different state (%) - American Indian and Alaska Native
Geographical mobility - Moved from different state (%) - Multirace
Geographical mobility - Moved from different state (%) - Other Race
Geographical mobility - Moved from abroad (%)
Geographical mobility - Moved from abroad (%) - White
Geographical mobility - Moved from abroad (%) - Black or African American
Geographical mobility - Moved from abroad (%) - Asian
Geographical mobility - Moved from abroad (%) - Hispanic or Latino
Geographical mobility - Moved from abroad (%) - American Indian and Alaska Native
Geographical mobility - Moved from abroad (%) - Multirace
Geographical mobility - Moved from abroad (%) - Other Race
Place of birth for the foreign-born population - Ireland (%)
Place of birth for the foreign-born population - Denmark (%)
Place of birth for the foreign-born population - Norway (%)
Place of birth for the foreign-born population - Sweden (%)
Place of birth for the foreign-born population - United Kingdom (%)
Place of birth for the foreign-born population - England (%)
Place of birth for the foreign-born population - Scotland (%)
Place of birth for the foreign-born population - Other Northern Europe (%)
Place of birth for the foreign-born population - Austria (%)
Place of birth for the foreign-born population - Belgium (%)
Place of birth for the foreign-born population - France (%)
Place of birth for the foreign-born population - Germany (%)
Place of birth for the foreign-born population - Netherlands (%)
Place of birth for the foreign-born population - Switzerland (%)
Place of birth for the foreign-born population - Other Western Europe (%)
Place of birth for the foreign-born population - Greece (%)
Place of birth for the foreign-born population - Italy (%)
Place of birth for the foreign-born population - Portugal (%)
Place of birth for the foreign-born population - Spain (%)
Place of birth for the foreign-born population - Other Southern Europe (%)
Place of birth for the foreign-born population - Albania (%)
Place of birth for the foreign-born population - Belarus (%)
Place of birth for the foreign-born population - Bosnia and Herzegovina (%)
Place of birth for the foreign-born population - Bulgaria (%)
Place of birth for the foreign-born population - Croatia (%)
Place of birth for the foreign-born population - Czechoslovakia (%)
Place of birth for the foreign-born population - Hungary (%)
Place of birth for the foreign-born population - Latvia (%)
Place of birth for the foreign-born population - Lithuania (%)
Place of birth for the foreign-born population - North Macedonia (Macedonia) (%)
Place of birth for the foreign-born population - Moldova (%)
Place of birth for the foreign-born population - Poland (%)
Place of birth for the foreign-born population - Romania (%)
Place of birth for the foreign-born population - Russia (%)
Place of birth for the foreign-born population - Serbia (%)
Place of birth for the foreign-born population - Ukraine (%)
Place of birth for the foreign-born population - Other Eastern Europe (%)
Place of birth for the foreign-born population - China (%)
Place of birth for the foreign-born population - Hong Kong (%)
Place of birth for the foreign-born population - Taiwan (%)
Place of birth for the foreign-born population - Japan (%)
Place of birth for the foreign-born population - Korea (%)
Place of birth for the foreign-born population - Other Eastern Asia (%)
Place of birth for the foreign-born population - Afghanistan (%)
Place of birth for the foreign-born population - Bangladesh (%)
Place of birth for the foreign-born population - India (%)
Place of birth for the foreign-born population - Iran (%)
Place of birth for the foreign-born population - Kazakhstan (%)
Place of birth for the foreign-born population - Nepal (%)
Place of birth for the foreign-born population - Pakistan (%)
Place of birth for the foreign-born population - Sri Lanka (%)
Place of birth for the foreign-born population - Uzbekistan (%)
Place of birth for the foreign-born population - Other South Central Asia (%)
Place of birth for the foreign-born population - Burma (%)
Place of birth for the foreign-born population - Cambodia (%)
Place of birth for the foreign-born population - Indonesia (%)
Place of birth for the foreign-born population - Laos (%)
Place of birth for the foreign-born population - Malaysia (%)
Place of birth for the foreign-born population - Philippines (%)
Place of birth for the foreign-born population - Singapore (%)
Place of birth for the foreign-born population - Thailand (%)
Place of birth for the foreign-born population - Vietnam (%)
Place of birth for the foreign-born population - Other South Eastern Asia (%)
Place of birth for the foreign-born population - Armenia (%)
Place of birth for the foreign-born population - Iraq (%)
Place of birth for the foreign-born population - Israel (%)
Place of birth for the foreign-born population - Jordan (%)
Place of birth for the foreign-born population - Kuwait (%)
Place of birth for the foreign-born population - Lebanon (%)
Place of birth for the foreign-born population - Saudi Arabia (%)
Place of birth for the foreign-born population - Syria (%)
Place of birth for the foreign-born population - Turkey (%)
Place of birth for the foreign-born population - Yemen (%)
Place of birth for the foreign-born population - Other Western Asia (%)
Place of birth for the foreign-born population - Eritrea (%)
Place of birth for the foreign-born population - Ethiopia (%)
Place of birth for the foreign-born population - Kenya (%)
Place of birth for the foreign-born population - Somalia (%)
Place of birth for the foreign-born population - Uganda (%)
Place of birth for the foreign-born population - Zimbabwe (%)
Place of birth for the foreign-born population - Other Eastern Africa (%)
Place of birth for the foreign-born population - Cameroon (%)
Place of birth for the foreign-born population - Congo (%)
Place of birth for the foreign-born population - Democratic Republic of Congo (Zaire) (%)
Place of birth for the foreign-born population - Other Middle Africa (%)
Place of birth for the foreign-born population - Egypt (%)
Place of birth for the foreign-born population - Morocco (%)
Place of birth for the foreign-born population - Sudan (%)
Place of birth for the foreign-born population - Other Northern Africa (%)
Place of birth for the foreign-born population - South Africa (%)
Place of birth for the foreign-born population - Other Southern Africa (%)
Place of birth for the foreign-born population - Cabo Verde (%)
Place of birth for the foreign-born population - Ghana (%)
Place of birth for the foreign-born population - Liberia (%)
Place of birth for the foreign-born population - Nigeria (%)
Place of birth for the foreign-born population - Senegal (%)
Place of birth for the foreign-born population - Sierra Leone (%)
Place of birth for the foreign-born population - Other Western Africa (%)
Place of birth for the foreign-born population - Australia (%)
Place of birth for the foreign-born population - New Zealand (%)
Place of birth for the foreign-born population - Fiji (%)
Place of birth for the foreign-born population - Micronesia (%)
Place of birth for the foreign-born population - Bahamas (%)
Place of birth for the foreign-born population - Barbados (%)
Place of birth for the foreign-born population - Cuba (%)
Place of birth for the foreign-born population - Dominica (%)
Place of birth for the foreign-born population - Dominican Republic (%)
Place of birth for the foreign-born population - Grenada (%)
Place of birth for the foreign-born population - Haiti (%)
Place of birth for the foreign-born population - Jamaica (%)
Place of birth for the foreign-born population - St. Vincent and the Grenadines (%)
Place of birth for the foreign-born population - Trinidad and Tobago (%)
Place of birth for the foreign-born population - West Indies (%)
Place of birth for the foreign-born population - Other Caribbean (%)
Place of birth for the foreign-born population - Belize (%)
Place of birth for the foreign-born population - Costa Rica (%)
Place of birth for the foreign-born population - El Salvador (%)
Place of birth for the foreign-born population - Guatemala (%)
Place of birth for the foreign-born population - Honduras (%)
Place of birth for the foreign-born population - Mexico (%)
Place of birth for the foreign-born population - Nicaragua (%)
Place of birth for the foreign-born population - Panama (%)
Place of birth for the foreign-born population - Other Central America (%)
Place of birth for the foreign-born population - Argentina (%)
Place of birth for the foreign-born population - Bolivia (%)
Place of birth for the foreign-born population - Brazil (%)
Place of birth for the foreign-born population - Chile (%)
Place of birth for the foreign-born population - Colombia (%)
Place of birth for the foreign-born population - Ecuador (%)
Place of birth for the foreign-born population - Guyana (%)
Place of birth for the foreign-born population - Peru (%)
Place of birth for the foreign-born population - Uruguay (%)
Place of birth for the foreign-born population - Venezuela (%)
Place of birth for the foreign-born population - Other South America (%)
Place of birth for the foreign-born population - Canada (%)
Place of birth for the foreign-born population - Other Northern America (%)
Place of birth for the foreign-born population - Other (%)
Latest news about races in Arlington, VA collected exclusively by city-data.com from local newspapers, TV, and radio stations
According to 2022 data, the most numerous races in Arlington, VA are White alone (136,769 residents), Black alone (21,502 residents), and Hispanic (36,500 residents). 72.1% of Arlington residents speak English at home. 22.8% of Arlington, VA residents are foreign-born (8.7% born in Asia, 7.5% born in Latin America, 3.0% born in Europe, 2.7% born in Africa), which is 47.3% greater than the foreign-born rate of 12.0% across the entire state of Virginia.
Race distribution in Arlington
2000 2022
114,489 60.4% White alone 35,268 18.6% Hispanic 17,244 9.1% Black alone 16,232 8.6% Asian alone 5,101 2.7% Two or more races 587 0.3% Other race alone 418 0.2% American Indian alone 114 0.06% Native Hawaiian and Other
136,769 58.4% White alone 36,500 15.6% Hispanic 24,352 10.4% Asian alone 21,502 9.2% Black alone 12,310 5.3% Two or more races 1,985 0.8% Other race alone 385 0.2% American Indian alone 197 0.08% Native Hawaiian and Other
2000 2022
4,965,637 70.2% White alone 1,376,378 19.4% Black alone 329,540 4.7% Hispanic 259,277 3.7% Asian alone 114,022 1.6% Two or more races 18,596 0.3% American Indian alone 11,685 0.2% Other race alone 3,380 0.05% Native Hawaiian and Other
5,095,130 58.7% White alone 1,594,785 18.4% Black alone 905,750 10.4% Hispanic 602,881 6.9% Asian alone 406,047 4.7% Two or more races 60,419 0.7% Other race alone 11,738 0.1% American Indian alone 6,869 0.08% Native Hawaiian and Other
Income and house value in Arlington Median household income in 2022 $149,280 White non-Hispanic householders$109,845 Black householders$106,481 American Indian and Alaska Native householders$112,882 Asian householdersover $200,000 Native Hawaiian and other Pacific Islander householders$68,968 Some other race householders$112,814 Two or more races householders$98,369 Hispanic or Latino race householdersMedian 2022 house value $980,232 White Non-Hispanic householders$578,921 Black or African American householders$717,891 American Indian or Alaska Native householders $754,761 Asian householders$856,861 Native Hawaiian and other Pacific Islander householders$623,236 Some other race householders$728,881 Two or more races householders$681,731 Hispanic or Latino householders
Median age by race in Arlington
36.5 Median age for White residents36.3 36.6 38.0 Median age for Black or African American residents37.9 38.1 48.8 Median age for American Indian / Alaska Native residents30.9 49.7 35.2 Median age for Asian residents34.4 35.5 25.0 Median age for Native Hawaiian / Pacific Islander residents-666,666,666.0 -666,666,666.0 28.8 Median age for Other race residents29.0 28.6 32.2 Median age for Two or more races residents32.2 32.1 36.4 Median age for White alone residents36.3 36.4 33.8 Median age for Hispanic or Latino residents34.3 33.5
Owner/renter occupied households by race in Arlington
House owners and renters - White residents 34,602 46.9% Owner occupied39,166 53.1% Renter occupiedHouse owners and renters - Black or African American residents 2,569 24.9% Owner occupied7,740 75.1% Renter occupiedHouse owners and renters - American Indian / Alaska Native residents 107 24.3% Owner occupied333 75.7% Renter occupiedHouse owners and renters - Asian residents 3,501 30.8% Owner occupied7,882 69.2% Renter occupiedHouse owners and renters - Native Hawaiian / Pacific Islander residents 36 26.1% Owner occupied103 73.9% Renter occupiedHouse owners and renters - Other race residents 1,232 25.1% Owner occupied3,682 74.9% Renter occupiedHouse owners and renters - Two or more races residents 3,993 34.2% Owner occupied7,681 65.8% Renter occupiedHouse owners and renters - White alone residents 33,735 47.6% Owner occupied37,153 52.4% Renter occupiedHouse owners and renters - Hispanic or Latino residents 3,929 28.8% Owner occupied9,724 71.2% Renter occupied
Language usage in Arlington
English speakers - Total 72.1% of residents of Arlington speak English at home.
12.0% of residents speak Spanish at home 18,400 69.2% Speak English very well8,199 30.8% Speak English less than very well15.9% of residents speak other language at home 23,420 66.1% Speak English very well11,987 33.9% Speak English less than very well
English speakers - Born in the United States 89.7% of residents of Arlington speak English at home.
5.3% of residents speak Spanish at home 5,917 90.8% Speak English very well596 9.2% Speak English less than very well5.0% of residents speak other language at home 5,679 91.6% Speak English very well523 8.4% Speak English less than very well
English speakers - Native, born elsewhere 56.9% of residents of Arlington speak English at home.
36.3% of residents speak Spanish at home 2,497 82.8% Speak English very well519 17.2% Speak English less than very well6.8% of residents speak other language at home 486 85.4% Speak English very well83 14.6% Speak English less than very well
English speakers - Foreign-born 22.2% of residents of Arlington speak English at home.
24.7% of residents speak Spanish at home 6,167 50.2% Speak English very well6,124 49.8% Speak English less than very well53.1% of residents speak other language at home 15,947 60.3% Speak English very well10,480 39.7% Speak English less than very well
White (Caucasian) - Speak only English Native:
94.3% (115,095)Foreign-born:
31.4% (4,703)
White (Caucasian) - Speak another language Native:
5.7% (6,980)Foreign-born:
68.6% (10,287)
Black or African American - Speak only English Native:
88.4% (13,189)Foreign-born:
16.9% (1,093)
Black or African American - Speak another language Native:
11.6% (1,729)Foreign-born:
83.1% (5,382)
American Indian / Alaska Native - Speak only English Native:
78.4% (362)Foreign-born:
8.1% (47)
American Indian / Alaska Native - Speak another language Native:
21.9% (101)Foreign-born:
84.3% (492)
Asian - Speak only English Native:
59.7% (4,174)Foreign-born:
24.2% (3,947)
Asian - Speak another language Native:
40.3% (2,821)Foreign-born:
75.8% (12,376)
Native Hawaiian / Pacific Islander - Speak only English Native:
88.0% (200)Foreign-born:
12.6% (10)
Other race - Speak only English Native:
42.2% (3,701)Foreign-born:
6.8% (388)
Other race - Speak another language Native:
57.8% (5,079)Foreign-born:
93.2% (5,341)
Two or more races - Speak only English Native:
64.9% (12,360)Foreign-born:
14.8% (898)
Two or more races - Speak another language Native:
35.1% (6,679)Foreign-born:
85.2% (5,164)
White alone - Speak only English Native:
95.4% (113,182)Foreign-born:
37.6% (4,586)
White alone - Speak another language Native:
4.6% (5,481)Foreign-born:
62.4% (7,626)
Hispanic or Latino - Speak only English Native:
41.0% (8,483)Foreign-born:
8.1% (1,079)
Hispanic or Latino - Speak another language Native:
59.0% (12,196)Foreign-born:
91.9% (12,230)
Foreign-born residents in Arlington 53,237 residents are foreign born (8.7% Asia , 7.5% Latin America , 3.0% Europe , 2.7% Africa ).
This city:
22.8%Virginia:
12.6%
Marital status for residents in Arlington Marital status - White (Caucasian) population 15 years and over
Males 46.4% Never married46.2% Now married0.4% Separated1.4% Widowed5.6% DivorcedFemales 43.0% Never married39.7% Now married0.8% Separated4.8% Widowed11.7% DivorcedWomen who gave birth in the past 12 months Now married:
92.4% (1,351)Unmarried:
7.6% (111)
Women who did not give birth in the past 12 months Now married:
34.0% (13,039)Unmarried:
66.0% (25,365)
Marital status - Black or African American population 15 years and over
Males 53.0% Never married31.3% Now married2.2% Separated3.4% Widowed10.1% DivorcedFemales 49.5% Never married27.3% Now married2.5% Separated3.9% Widowed16.8% DivorcedWomen who gave birth in the past 12 months Now married:
23.8% (53)Unmarried:
76.2% (169)
Women who did not give birth in the past 12 months Now married:
27.5% (1,870)Unmarried:
72.5% (4,921)
Marital status - American Indian / Alaska Native population 15 years and over
Males 48.6% Never married43.0% Now married8.4% Separated0.0% Widowed0.0% DivorcedFemales 23.3% Never married47.7% Now married5.0% Separated12.7% Widowed11.3% DivorcedWomen who did not give birth in the past 12 months Now married:
46.1% (131)Unmarried:
53.9% (153)
Marital status - Asian population 15 years and over
Males 44.3% Never married50.6% Now married2.1% Separated0.0% Widowed3.0% DivorcedFemales 33.3% Never married50.6% Now married0.7% Separated5.6% Widowed9.8% DivorcedWomen who gave birth in the past 12 months Now married:
100.0% (532)Unmarried:
0.0% (0)
Women who did not give birth in the past 12 months Now married:
45.4% (3,472)Unmarried:
54.6% (4,175)
Marital status - Native Hawaiian / Pacific Islander population 15 years and over
Males 72.9% Never married27.1% Now married0.0% Separated0.0% Widowed0.0% DivorcedFemales 63.2% Never married18.4% Now married0.0% Separated0.0% Widowed18.4% DivorcedWomen who did not give birth in the past 12 months Now married:
0.0% (0)Unmarried:
100.0% (75)
Marital status - Other race population 15 years and over
Males 55.5% Never married40.8% Now married1.4% Separated0.6% Widowed1.7% DivorcedFemales 51.7% Never married31.2% Now married5.0% Separated2.3% Widowed9.8% DivorcedWomen who gave birth in the past 12 months Now married:
39.0% (42)Unmarried:
61.0% (66)
Women who did not give birth in the past 12 months Now married:
37.1% (1,603)Unmarried:
62.9% (2,720)
Marital status - Two or more races population 15 years and over
Males 46.3% Never married41.8% Now married4.1% Separated0.0% Widowed7.7% DivorcedFemales 48.4% Never married31.1% Now married5.2% Separated3.9% Widowed11.3% DivorcedWomen who gave birth in the past 12 months Now married:
84.9% (186)Unmarried:
15.1% (33)
Women who did not give birth in the past 12 months Now married:
32.1% (2,345)Unmarried:
67.9% (4,965)
Marital status - White alone, not Hispanic / Latino population 15 years and over
Males 45.9% Never married46.7% Now married0.4% Separated1.5% Widowed5.5% DivorcedFemales 43.0% Never married40.6% Now married0.8% Separated4.3% Widowed11.2% DivorcedWomen who gave birth in the past 12 months Now married:
91.8% (1,245)Unmarried:
8.2% (111)
Women who did not give birth in the past 12 months Now married:
34.2% (12,546)Unmarried:
65.8% (24,157)
Marital status - Hispanic or Latino population 15 years and over
Males 49.0% Never married44.8% Now married2.3% Separated0.0% Widowed3.9% DivorcedFemales 47.7% Never married30.9% Now married2.9% Separated3.9% Widowed14.6% DivorcedWomen who gave birth in the past 12 months Now married:
53.6% (194)Unmarried:
46.4% (168)
Women who did not give birth in the past 12 months Now married:
33.1% (3,267)Unmarried:
66.9% (6,617)
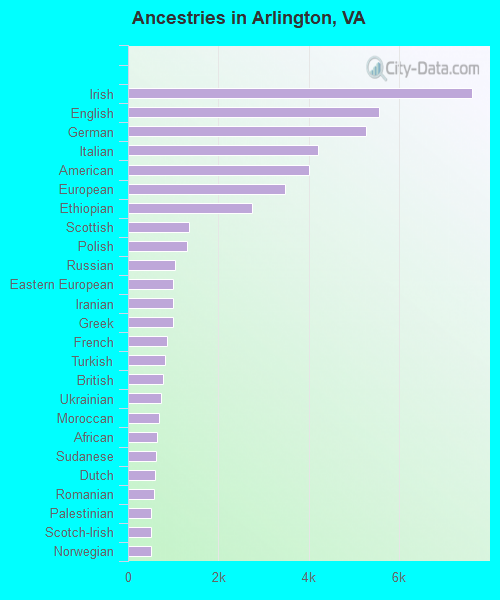
Ancestries in Arlington
7,617 6.5% Irish5,550 4.7% English5,270 4.5% German4,212 3.6% Italian4,000 3.4% American3,470 3.0% European2,743 2.3% Ethiopian1,355 1.2% Scottish1,305 1.1% Polish1,051 0.9% Russian1,008 0.9% Eastern European993 0.8% Iranian989 0.8% Greek863 0.7% French820 0.7% Turkish781 0.7% British739 0.6% Ukrainian682 0.6% Moroccan648 0.6% African614 0.5% Sudanese599 0.5% Dutch577 0.5% Romanian511 0.4% Palestinian508 0.4% Scotch-Irish506 0.4% Norwegian438 0.4% Lebanese424 0.4% Swedish393 0.3% Jamaican386 0.3% Egyptian359 0.3% French Canadian358 0.3% Brazilian332 0.3% Nigerian307 0.3% Northern European301 0.3% Afghan280 0.2% Serbian265 0.2% Scandinavian244 0.2% Portuguese236 0.2% Armenian222 0.2% Hungarian197 0.2% Bulgarian193 0.2% Iraqi176 0.2% Somali175 0.1% Arab174 0.1% Welsh173 0.1% Finnish164 0.1% Jordanian164 0.1% Albanian162 0.1% Czech156 0.1% Israeli154 0.1% Yugoslavian152 0.1% South African149 0.1% Slovene148 0.1% Syrian135 0.1% Danish131 0.1% Ghanaian120 0.1% Austrian109 0.09% Swiss104 0.09% Lithuanian89 0.08% Australian72 0.06% Belgian65 0.06% Belizean58 0.05% Haitian54 0.05% Trinidadian and Tobagonian50 0.04% Croatian47 0.04% Sierra Leonean47 0.04% Canadian46 0.04% Kenyan43 0.04% Assyrian42 0.04% Slovak38 0.03% Bahamian33 0.03% West Indian31 0.03% New Zealander31 0.03% Senegalese30 0.03% Latvian25 0.02% Cajun17 0.01% Slavic16 0.01% Estonian16 0.01% Guyanese15 0.01% Celtic14 0.01% Pennsylvania German12 0.01% Carpatho Rusyn11 0.01% Czechoslovakian9 0.01% Macedonian
Geographical mobility in Arlington Same house 1 year ago 112,839 79.7% White (Caucasian)17,043 76.4% Black or African American738 77.7% American Indian / Alaska Native16,748 69.5% Asian226 73.6% Native Hawaiian / Pacific Islander14,758 88.6% Other race20,876 77.3% Two or more races108,007 79.9% White alone, not Hispanic / Latino29,999 83.2% Hispanic or LatinoMoved within same county 8,378 5.9% White / Caucasian1,717 7.7% Black or African American181 19.1% American Indian / Alaska Native1,897 7.9% Asian49 16.1% Native Hawaiian / Pacific Islander585 3.5% Other race1,803 6.7% Two or more races8,092 6.0% White alone, not Hispanic / Latino1,711 4.7% Hispanic or LatinoMoved within same state 5,834 4.1% White / Caucasian1,080 4.8% Black or African American1 0.1% American Indian / Alaska Native749 3.1% Asian48 15.5% Native Hawaiian / Pacific Islander222 1.3% Other race652 2.4% Two or more races5,138 3.8% White alone, not Hispanic / Latino1,148 3.2% Hispanic or LatinoMoved from different state 12,983 9.2% White / Caucasian1,870 8.4% Black or African American55 5.8% American Indian / Alaska Native3,852 16.0% Asian935 5.6% Other race3,109 11.5% Two or more races12,732 9.4% White alone, not Hispanic / Latino2,091 5.8% Hispanic or LatinoMoved from abroad 1,470 1.0% White584 2.6% Black or African American30 3.2% American Indian / Alaska Native849 3.5% Asian264 1.6% Other race569 2.1% Two or more races1,287 1.0% White alone, not Hispanic / Latino1,121 3.1% Hispanic or Latino
Children Nativity (place of birth) in Arlington
Children under 6 years - Living with two parents Both parents native 9,065 100.0% NativeBoth parents foreign-born 1,423 85.9% Native233 14.1% Foreign-bornOne native, one foreign-born parent 1,964 100.0% NativeChildren under 6 years - Living with one parent Native parent 1,065 100.0% NativeForeign-born parent 283 100.0% NativeChildren 6 to 17 years - Living with two parents Both parents native 13,015 100.0% NativeBoth parents foreign-born 2,566 68.4% Native1,188 31.6% Foreign-bornOne native, one foreign-born parent 3,748 97.3% Native105 2.7% Foreign-bornChildren 6 to 17 years - Living with one parent Native parent 2,635 100.0% NativeForeign-born parent 3,335 58.1% Native2,410 41.9% Foreign-born
Place of birth for residents in Arlington 20,782 Asia18,537 Americas17,885 Latin America9,713 Central America7,622 Eastern Asia7,154 South America7,151 Europe6,415 Africa6,271 South Central Asia3,967 China3,759 South Eastern Asia3,548 Eastern Africa3,011 Eastern Europe2,996 Western Asia1,573 Northern Africa1,541 Northern Europe1,497 Western Europe1,077 Southern Europe1,017 Caribbean704 Western Africa652 Northern America349 Oceania305 Australia and New Zealand Subregion297 Southern Africa180 Middle Africa5,156 El Salvador3,377 China2,674 Ethiopia2,621 India2,579 Bolivia1,950 Guatemala1,719 Korea1,602 Colombia1,299 Philippines1,235 Mexico1,183 Vietnam1,024 Peru945 Bangladesh910 Iran906 Turkey867 Morocco832 Japan811 Russia707 United Kingdom687 Brazil686 Nepal652 Canada603 France521 Indonesia505 Pakistan449 Saudi Arabia426 Germany426 Greece417 Honduras397 Taiwan394 Nicaragua380 Argentina376 Nigeria366 Thailand355 Ukraine350 Italy341 Jamaica332 Ecuador322 Sudan317 Jordan316 Eritrea297 South Africa296 England293 Costa Rica293 Egypt287 Lebanon274 Israel272 Cuba262 Serbia258 Romania256 Bosnia and Herzegovina254 Dominican Republic250 Austria249 Venezuela246 Bulgaria237 United Arab Emirates226 Australia197 Afghanistan196 Sri Lanka195 Panama192 Spain192 Hong Kong184 Burma (Myanmar)180 Poland173 Ireland166 Ghana161 Somalia155 Albania145 Kenya131 Iraq121 Cambodia114 Netherlands109 Sweden107 Syria106 Portugal102 Scotland95 Democratic Republic of Congo (Zaire)91 Belarus85 Azerbaijan85 Uruguay80 Chile79 New Zealand73 Switzerland70 Belize65 Zimbabwe64 Haiti64 Hungary62 Moldova58 Ivory Coast55 Trinidad and Tobago54 Norway54 Czechoslovakia53 Armenia53 Guyana49 Yemen47 Croatia46 Malaysia44 Algeria36 Lithuania36 Singapore35 Denmark30 Kuwait29 Belgium27 Bahamas26 Senegal22 Sierra Leone17 Cameroon14 Uzbekistan14 Georgia12 North Macedonia (Macedonia)10 Fiji7 Uganda
Grandparents responsible for own grandchildren in Arlington
Grandparents (30 to 59 years) White / Caucasian 16 22.0% Responsible for grandchildren58 78.0% Not responsible for grandchildrenBlack or African American 13 30.9% Responsible for grandchildren28 69.1% Not responsible for grandchildrenAmerican Indian / Alaska Native 2 100.0% Not responsible for grandchildrenAsian 32 100.0% Not responsible for grandchildrenOther race 47 30.9% Responsible for grandchildren105 69.1% Not responsible for grandchildrenTwo or more races 68 21.5% Responsible for grandchildren246 78.5% Not responsible for grandchildrenWhite alone, not Hispanic / Latino 8 29.0% Responsible for grandchildren20 71.0% Not responsible for grandchildrenHispanic or Latino 62 18.5% Responsible for grandchildren274 81.5% Not responsible for grandchildrenGrandparents (60 years and over) White / Caucasian 97 18.4% Responsible for grandchildren429 81.6% Not responsible for grandchildrenBlack or African American 63 62.0% Responsible for grandchildren39 38.0% Not responsible for grandchildrenAsian 233 100.0% Not responsible for grandchildrenOther race 59 79.1% Responsible for grandchildren16 20.9% Not responsible for grandchildrenTwo or more races 184 100.0% Not responsible for grandchildrenWhite alone, not Hispanic / Latino 98 20.4% Responsible for grandchildren382 79.6% Not responsible for grandchildrenHispanic or Latino 34 13.1% Responsible for grandchildren228 86.9% Not responsible for grandchildren
Zip codes: 22101 , 22201 , 22202 , 22203 , 22204 , 22205 , 22207 , 22209 , 22211 , 22213 , 22214.