Races in Bartlesville, Oklahoma (OK) Detailed Stats
Data:
Races - White alone (%)
Races - White alone (% change since 2000)
Races - Black alone (%)
Races - Black alone (% change since 2000)
Races - American Indian alone (%)
Races - American Indian alone (% change since 2000)
Races - Asian alone (%)
Races - Asian alone (% change since 2000)
Races - Hispanic (%)
Races - Hispanic (% change since 2000)
Races - Native Hawaiian and Other Pacific Islander alone (%)
Races - Native Hawaiian and Other Pacific Islander alone (% change since 2000)
Races - Two or more races(%)
Races - Two or more races(% change since 2000)
Races - Other race alone (%)
Races - Other race alone (% change since 2000)
Racial diversity
Place of birth - Born in state of residence (%)
Place of birth - Born in state of residence (%) - White
Place of birth - Born in state of residence (%) - Black or African American
Place of birth - Born in state of residence (%) - Asian
Place of birth - Born in state of residence (%) - Hispanic or Latino
Place of birth - Born in state of residence (%) - American Indian and Alaska Native
Place of birth - Born in state of residence (%) - Multirace
Place of birth - Born in state of residence (%) - Other Race
Place of birth - Born in other state (%)
Place of birth - Born in other state (%) - White
Place of birth - Born in other state (%) - Black or African American
Place of birth - Born in other state (%) - Asian
Place of birth - Born in other state (%) - Hispanic or Latino
Place of birth - Born in other state (%) - American Indian and Alaska Native
Place of birth - Born in other state (%) - Multirace
Place of birth - Born in other state (%) - Other Race
Place of birth - Native, outside of US (%)
Place of birth - Native, outside of US (%) - White
Place of birth - Native, outside of US (%) - Black or African American
Place of birth - Native, outside of US (%) - Asian
Place of birth - Native, outside of US (%) - Hispanic or Latino
Place of birth - Native, outside of US (%) - American Indian and Alaska Native
Place of birth - Native, outside of US (%) - Multirace
Place of birth - Native, outside of US (%) - Other Race
Place of birth - Foreign born (%)
Place of birth - Foreign born (%) - White
Place of birth - Foreign born (%) - Black or African American
Place of birth - Foreign born (%) - Asian
Place of birth - Foreign born (%) - Hispanic or Latino
Place of birth - Foreign born (%) - American Indian and Alaska Native
Place of birth - Foreign born (%) - Multirace
Place of birth - Foreign born (%) - Other Race
Residents speaking English at home (%)
Residents speaking English at home - Born in the United States (%)
Residents speaking English at home - Native, born elsewhere (%)
Residents speaking English at home - Foreign born (%)
Residents speaking Spanish at home (%)
Residents speaking Spanish at home - Born in the United States (%)
Residents speaking Spanish at home - Native, born elsewhere (%)
Residents speaking Spanish at home - Foreign born (%)
Residents speaking other language at home (%)
Residents speaking other language at home - Born in the United States (%)
Residents speaking other language at home - Native, born elsewhere (%)
Residents speaking other language at home - Foreign born (%)
Marital status - Never married (%)
Marital status - Now married (%)
Marital status - Separated (%)
Marital status - Widowed (%)
Marital status - Divorced (%)
Ancestries Reported - Arab (%)
Ancestries Reported - Czech (%)
Ancestries Reported - Danish (%)
Ancestries Reported - Dutch (%)
Ancestries Reported - English (%)
Ancestries Reported - French (%)
Ancestries Reported - French Canadian (%)
Ancestries Reported - German (%)
Ancestries Reported - Greek (%)
Ancestries Reported - Hungarian (%)
Ancestries Reported - Irish (%)
Ancestries Reported - Italian (%)
Ancestries Reported - Lithuanian (%)
Ancestries Reported - Norwegian (%)
Ancestries Reported - Polish (%)
Ancestries Reported - Portuguese (%)
Ancestries Reported - Russian (%)
Ancestries Reported - Scotch-Irish (%)
Ancestries Reported - Scottish (%)
Ancestries Reported - Slovak (%)
Ancestries Reported - Subsaharan African (%)
Ancestries Reported - Swedish (%)
Ancestries Reported - Swiss (%)
Ancestries Reported - Ukrainian (%)
Ancestries Reported - United States (%)
Ancestries Reported - Welsh (%)
Ancestries Reported - West Indian (%)
Ancestries Reported - Other (%)
Geographical mobility - Same house 1 year ago (%)
Geographical mobility - Same house 1 year ago (%) - White
Geographical mobility - Same house 1 year ago (%) - Black or African American
Geographical mobility - Same house 1 year ago (%) - Asian
Geographical mobility - Same house 1 year ago (%) - Hispanic or Latino
Geographical mobility - Same house 1 year ago (%) - American Indian and Alaska Native
Geographical mobility - Same house 1 year ago (%) - Multirace
Geographical mobility - Same house 1 year ago (%) - Other Race
Geographical mobility - Moved within same county (%)
Geographical mobility - Moved within same county (%) - White
Geographical mobility - Moved within same county (%) - Black or African American
Geographical mobility - Moved within same county (%) - Asian
Geographical mobility - Moved within same county (%) - Hispanic or Latino
Geographical mobility - Moved within same county (%) - American Indian and Alaska Native
Geographical mobility - Moved within same county (%) - Multirace
Geographical mobility - Moved within same county (%) - Other Race
Geographical mobility - Moved from different county within same state (%)
Geographical mobility - Moved from different county within same state (%) - White
Geographical mobility - Moved from different county within same state (%) - Black or African American
Geographical mobility - Moved from different county within same state (%) - Asian
Geographical mobility - Moved from different county within same state (%) - Hispanic or Latino
Geographical mobility - Moved from different county within same state (%) - American Indian and Alaska Native
Geographical mobility - Moved from different county within same state (%) - Multirace
Geographical mobility - Moved from different county within same state (%) - Other Race
Geographical mobility - Moved from different state (%)
Geographical mobility - Moved from different state (%) - White
Geographical mobility - Moved from different state (%) - Black or African American
Geographical mobility - Moved from different state (%) - Asian
Geographical mobility - Moved from different state (%) - Hispanic or Latino
Geographical mobility - Moved from different state (%) - American Indian and Alaska Native
Geographical mobility - Moved from different state (%) - Multirace
Geographical mobility - Moved from different state (%) - Other Race
Geographical mobility - Moved from abroad (%)
Geographical mobility - Moved from abroad (%) - White
Geographical mobility - Moved from abroad (%) - Black or African American
Geographical mobility - Moved from abroad (%) - Asian
Geographical mobility - Moved from abroad (%) - Hispanic or Latino
Geographical mobility - Moved from abroad (%) - American Indian and Alaska Native
Geographical mobility - Moved from abroad (%) - Multirace
Geographical mobility - Moved from abroad (%) - Other Race
Place of birth for the foreign-born population - Ireland (%)
Place of birth for the foreign-born population - Denmark (%)
Place of birth for the foreign-born population - Norway (%)
Place of birth for the foreign-born population - Sweden (%)
Place of birth for the foreign-born population - United Kingdom (%)
Place of birth for the foreign-born population - England (%)
Place of birth for the foreign-born population - Scotland (%)
Place of birth for the foreign-born population - Other Northern Europe (%)
Place of birth for the foreign-born population - Austria (%)
Place of birth for the foreign-born population - Belgium (%)
Place of birth for the foreign-born population - France (%)
Place of birth for the foreign-born population - Germany (%)
Place of birth for the foreign-born population - Netherlands (%)
Place of birth for the foreign-born population - Switzerland (%)
Place of birth for the foreign-born population - Other Western Europe (%)
Place of birth for the foreign-born population - Greece (%)
Place of birth for the foreign-born population - Italy (%)
Place of birth for the foreign-born population - Portugal (%)
Place of birth for the foreign-born population - Spain (%)
Place of birth for the foreign-born population - Other Southern Europe (%)
Place of birth for the foreign-born population - Albania (%)
Place of birth for the foreign-born population - Belarus (%)
Place of birth for the foreign-born population - Bosnia and Herzegovina (%)
Place of birth for the foreign-born population - Bulgaria (%)
Place of birth for the foreign-born population - Croatia (%)
Place of birth for the foreign-born population - Czechoslovakia (%)
Place of birth for the foreign-born population - Hungary (%)
Place of birth for the foreign-born population - Latvia (%)
Place of birth for the foreign-born population - Lithuania (%)
Place of birth for the foreign-born population - North Macedonia (Macedonia) (%)
Place of birth for the foreign-born population - Moldova (%)
Place of birth for the foreign-born population - Poland (%)
Place of birth for the foreign-born population - Romania (%)
Place of birth for the foreign-born population - Russia (%)
Place of birth for the foreign-born population - Serbia (%)
Place of birth for the foreign-born population - Ukraine (%)
Place of birth for the foreign-born population - Other Eastern Europe (%)
Place of birth for the foreign-born population - China (%)
Place of birth for the foreign-born population - Hong Kong (%)
Place of birth for the foreign-born population - Taiwan (%)
Place of birth for the foreign-born population - Japan (%)
Place of birth for the foreign-born population - Korea (%)
Place of birth for the foreign-born population - Other Eastern Asia (%)
Place of birth for the foreign-born population - Afghanistan (%)
Place of birth for the foreign-born population - Bangladesh (%)
Place of birth for the foreign-born population - India (%)
Place of birth for the foreign-born population - Iran (%)
Place of birth for the foreign-born population - Kazakhstan (%)
Place of birth for the foreign-born population - Nepal (%)
Place of birth for the foreign-born population - Pakistan (%)
Place of birth for the foreign-born population - Sri Lanka (%)
Place of birth for the foreign-born population - Uzbekistan (%)
Place of birth for the foreign-born population - Other South Central Asia (%)
Place of birth for the foreign-born population - Burma (%)
Place of birth for the foreign-born population - Cambodia (%)
Place of birth for the foreign-born population - Indonesia (%)
Place of birth for the foreign-born population - Laos (%)
Place of birth for the foreign-born population - Malaysia (%)
Place of birth for the foreign-born population - Philippines (%)
Place of birth for the foreign-born population - Singapore (%)
Place of birth for the foreign-born population - Thailand (%)
Place of birth for the foreign-born population - Vietnam (%)
Place of birth for the foreign-born population - Other South Eastern Asia (%)
Place of birth for the foreign-born population - Armenia (%)
Place of birth for the foreign-born population - Iraq (%)
Place of birth for the foreign-born population - Israel (%)
Place of birth for the foreign-born population - Jordan (%)
Place of birth for the foreign-born population - Kuwait (%)
Place of birth for the foreign-born population - Lebanon (%)
Place of birth for the foreign-born population - Saudi Arabia (%)
Place of birth for the foreign-born population - Syria (%)
Place of birth for the foreign-born population - Turkey (%)
Place of birth for the foreign-born population - Yemen (%)
Place of birth for the foreign-born population - Other Western Asia (%)
Place of birth for the foreign-born population - Eritrea (%)
Place of birth for the foreign-born population - Ethiopia (%)
Place of birth for the foreign-born population - Kenya (%)
Place of birth for the foreign-born population - Somalia (%)
Place of birth for the foreign-born population - Uganda (%)
Place of birth for the foreign-born population - Zimbabwe (%)
Place of birth for the foreign-born population - Other Eastern Africa (%)
Place of birth for the foreign-born population - Cameroon (%)
Place of birth for the foreign-born population - Congo (%)
Place of birth for the foreign-born population - Democratic Republic of Congo (Zaire) (%)
Place of birth for the foreign-born population - Other Middle Africa (%)
Place of birth for the foreign-born population - Egypt (%)
Place of birth for the foreign-born population - Morocco (%)
Place of birth for the foreign-born population - Sudan (%)
Place of birth for the foreign-born population - Other Northern Africa (%)
Place of birth for the foreign-born population - South Africa (%)
Place of birth for the foreign-born population - Other Southern Africa (%)
Place of birth for the foreign-born population - Cabo Verde (%)
Place of birth for the foreign-born population - Ghana (%)
Place of birth for the foreign-born population - Liberia (%)
Place of birth for the foreign-born population - Nigeria (%)
Place of birth for the foreign-born population - Senegal (%)
Place of birth for the foreign-born population - Sierra Leone (%)
Place of birth for the foreign-born population - Other Western Africa (%)
Place of birth for the foreign-born population - Australia (%)
Place of birth for the foreign-born population - New Zealand (%)
Place of birth for the foreign-born population - Fiji (%)
Place of birth for the foreign-born population - Micronesia (%)
Place of birth for the foreign-born population - Bahamas (%)
Place of birth for the foreign-born population - Barbados (%)
Place of birth for the foreign-born population - Cuba (%)
Place of birth for the foreign-born population - Dominica (%)
Place of birth for the foreign-born population - Dominican Republic (%)
Place of birth for the foreign-born population - Grenada (%)
Place of birth for the foreign-born population - Haiti (%)
Place of birth for the foreign-born population - Jamaica (%)
Place of birth for the foreign-born population - St. Vincent and the Grenadines (%)
Place of birth for the foreign-born population - Trinidad and Tobago (%)
Place of birth for the foreign-born population - West Indies (%)
Place of birth for the foreign-born population - Other Caribbean (%)
Place of birth for the foreign-born population - Belize (%)
Place of birth for the foreign-born population - Costa Rica (%)
Place of birth for the foreign-born population - El Salvador (%)
Place of birth for the foreign-born population - Guatemala (%)
Place of birth for the foreign-born population - Honduras (%)
Place of birth for the foreign-born population - Mexico (%)
Place of birth for the foreign-born population - Nicaragua (%)
Place of birth for the foreign-born population - Panama (%)
Place of birth for the foreign-born population - Other Central America (%)
Place of birth for the foreign-born population - Argentina (%)
Place of birth for the foreign-born population - Bolivia (%)
Place of birth for the foreign-born population - Brazil (%)
Place of birth for the foreign-born population - Chile (%)
Place of birth for the foreign-born population - Colombia (%)
Place of birth for the foreign-born population - Ecuador (%)
Place of birth for the foreign-born population - Guyana (%)
Place of birth for the foreign-born population - Peru (%)
Place of birth for the foreign-born population - Uruguay (%)
Place of birth for the foreign-born population - Venezuela (%)
Place of birth for the foreign-born population - Other South America (%)
Place of birth for the foreign-born population - Canada (%)
Place of birth for the foreign-born population - Other Northern America (%)
Place of birth for the foreign-born population - Other (%)
Latest news about races in Bartlesville, OK collected exclusively by city-data.com from local newspapers, TV, and radio stations
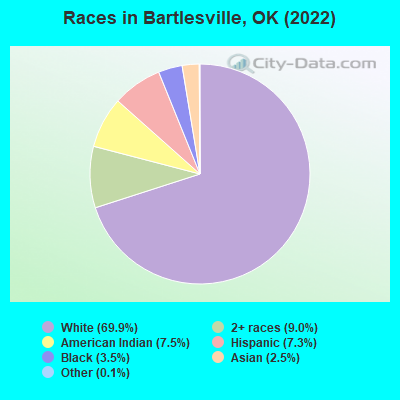
According to 2022 data, the most numerous races in Bartlesville, OK are White alone (26,392 residents), Hispanic (2,750 residents), and Two or more races (3,398 residents). 93.2% of Bartlesville residents speak English at home. 4.7% of Bartlesville, OK residents are foreign-born (2.6% born in Latin America, 1.6% born in Asia, 0.5% born in Europe), which is 26.8% less than the foreign-born rate of 6.0% across the entire state of Oklahoma.
Race distribution in Bartlesville
2000 2022
28,003 80.6% White alone 2,455 7.1% American Indian alone 1,789 5.1% Two or more races 1,103 3.2% Black alone 1,049 3.0% Hispanic 325 0.9% Asian alone 19 0.05% Other race alone 5 0.01% Native Hawaiian and Other
26,392 69.9% White alone 3,398 9.0% Two or more races 2,837 7.5% American Indian alone 2,750 7.3% Hispanic 1,312 3.5% Black alone 959 2.5% Asian alone 41 0.1% Other race alone 4 0.01% Native Hawaiian and Other
2000 2022
2,556,368 74.1% White alone 266,158 7.7% American Indian alone 257,981 7.5% Black alone 179,304 5.2% Hispanic 140,249 4.1% Two or more races 46,172 1.3% Asian alone 2,322 0.07% Other race alone 2,100 0.06% Native Hawaiian and Other
2,517,403 62.6% White alone 486,692 12.1% Hispanic 364,453 9.1% Two or more races 273,650 6.8% American Indian alone 268,543 6.7% Black alone 92,672 2.3% Asian alone 10,786 0.3% Other race alone 5,601 0.1% Native Hawaiian and Other
Income and house value in Bartlesville Median household income in 2022 $59,780 White non-Hispanic householders$34,035 Black householders$46,510 American Indian and Alaska Native householders$96,104 Asian householders$43,508 Some other race householders$46,967 Two or more races householders$42,825 Hispanic or Latino race householdersMedian 2022 house value $174,017 White Non-Hispanic householders$109,960 Black or African American householders$153,270 American Indian or Alaska Native householders$128,633 Some other race householders$111,775 Two or more races householders$191,912 Hispanic or Latino householders
Median age by race in Bartlesville
43.2 Median age for White residents40.1 46.9 41.3 Median age for Black or African American residents31.5 49.9 26.4 Median age for American Indian / Alaska Native residents23.3 31.0 30.6 Median age for Asian residents32.9 30.3 -725,225,224.5 Median age for Native Hawaiian / Pacific Islander residents-675,324,674.6 -767,251,461.2 28.7 Median age for Other race residents25.8 35.8 23.6 Median age for Two or more races residents23.1 24.6 43.0 Median age for White alone residents40.3 46.9 26.4 Median age for Hispanic or Latino residents23.2 29.5
Owner/renter occupied households by race in Bartlesville
House owners and renters - White residents 8,407 74.1% Owner occupied2,937 25.9% Renter occupiedHouse owners and renters - Black or African American residents 209 39.7% Owner occupied317 60.3% Renter occupiedHouse owners and renters - American Indian / Alaska Native residents 579 57.5% Owner occupied427 42.5% Renter occupiedHouse owners and renters - Asian residents 189 65.4% Owner occupied100 34.6% Renter occupiedHouse owners and renters - Native Hawaiian / Pacific Islander residents 4 100.0% Renter occupiedHouse owners and renters - Other race residents 188 48.1% Owner occupied203 51.9% Renter occupiedHouse owners and renters - Two or more races residents 683 52.4% Owner occupied619 47.6% Renter occupiedHouse owners and renters - White alone residents 8,337 73.8% Owner occupied2,962 26.2% Renter occupiedHouse owners and renters - Hispanic or Latino residents 446 57.3% Owner occupied332 42.7% Renter occupied
Language usage in Bartlesville
English speakers - Total 93.2% of residents of Bartlesville speak English at home.
4.4% of residents speak Spanish at home 966 62.0% Speak English very well591 38.0% Speak English less than very well2.4% of residents speak other language at home 481 57.7% Speak English very well352 42.3% Speak English less than very well
English speakers - Born in the United States 96.5% of residents of Bartlesville speak English at home.
2.9% of residents speak Spanish at home 271 64.1% Speak English very well152 35.9% Speak English less than very well0.6% of residents speak other language at home 68 76.4% Speak English very well21 23.6% Speak English less than very well
English speakers - Native, born elsewhere 78.8% of residents of Bartlesville speak English at home.
12.1% of residents speak Spanish at home 33 84.6% Speak English very well6 15.4% Speak English less than very well6.5% of residents speak other language at home 21 100.0% Speak English very well
English speakers - Foreign-born 13.7% of residents of Bartlesville speak English at home.
49.3% of residents speak Spanish at home 461 52.7% Speak English very well413 47.3% Speak English less than very well36.7% of residents speak other language at home 362 55.7% Speak English very well288 44.3% Speak English less than very well
White (Caucasian) - Speak only English Native:
100.0% (24,904)Foreign-born:
35.9% (79)
White (Caucasian) - Speak another language Native:
0.7% (173)Foreign-born:
65.4% (143)
Black or African American - Speak only English Native:
100.0% (1,164)Foreign-born:
35.1% (17)
American Indian / Alaska Native - Speak only English Native:
98.8% (2,636)Foreign-born:
31.8% (20)
American Indian / Alaska Native - Speak another language Native:
1.2% (32)Foreign-born:
67.0% (42)
Asian - Speak only English Native:
65.7% (194)Foreign-born:
10.8% (58)
Asian - Speak another language Native:
34.2% (101)Foreign-born:
89.5% (481)
Other race - Speak only English Native:
30.7% (172)Foreign-born:
9.0% (63)
Other race - Speak another language Native:
70.2% (393)Foreign-born:
91.0% (642)
Two or more races - Speak only English Native:
92.1% (3,490)Foreign-born:
6.8% (16)
Two or more races - Speak another language Native:
5.1% (194)Foreign-born:
93.0% (213)
White alone - Speak only English Native:
99.1% (24,644)Foreign-born:
31.1% (53)
White alone - Speak another language Native:
0.9% (218)Foreign-born:
67.8% (115)
Hispanic or Latino - Speak only English Native:
67.9% (1,003)Foreign-born:
11.8% (117)
Hispanic or Latino - Speak another language Native:
32.5% (481)Foreign-born:
88.8% (884)
Foreign-born residents in Bartlesville 1,787 residents are foreign born (2.6% Latin America , 1.6% Asia , 0.5% Europe ).
This city:
4.7%Oklahoma:
6.1%
Marital status for residents in Bartlesville Marital status - White (Caucasian) population 15 years and over
Males 28.0% Never married55.7% Now married1.3% Separated3.3% Widowed11.7% DivorcedFemales 16.9% Never married52.5% Now married1.6% Separated13.6% Widowed15.4% DivorcedWomen who gave birth in the past 12 months Now married:
86.0% (297)Unmarried:
14.0% (48)
Women who did not give birth in the past 12 months Now married:
52.2% (2,661)Unmarried:
47.8% (2,439)
Marital status - Black or African American population 15 years and over
Males 52.6% Never married31.1% Now married0.0% Separated0.0% Widowed16.3% DivorcedFemales 31.1% Never married36.6% Now married1.9% Separated9.7% Widowed20.7% DivorcedWomen who gave birth in the past 12 months Now married:
0.0% (0)Unmarried:
100.0% (7)
Women who did not give birth in the past 12 months Now married:
42.2% (92)Unmarried:
57.8% (126)
Marital status - American Indian / Alaska Native population 15 years and over
Males 44.2% Never married42.0% Now married1.8% Separated4.0% Widowed8.0% DivorcedFemales 31.2% Never married34.7% Now married3.8% Separated4.5% Widowed25.9% DivorcedWomen who gave birth in the past 12 months Now married:
81.2% (27)Unmarried:
18.8% (6)
Women who did not give birth in the past 12 months Now married:
31.3% (232)Unmarried:
68.7% (508)
Marital status - Asian population 15 years and over
Males 23.5% Never married71.8% Now married0.0% Separated0.0% Widowed4.7% DivorcedFemales 19.4% Never married71.9% Now married0.0% Separated1.9% Widowed6.8% DivorcedWomen who gave birth in the past 12 months Now married:
0.0% (0)Unmarried:
100.0% (8)
Women who did not give birth in the past 12 months Now married:
71.1% (170)Unmarried:
28.9% (69)
Marital status - Other race population 15 years and over
Males 46.2% Never married45.5% Now married0.0% Separated0.9% Widowed7.4% DivorcedFemales 24.2% Never married52.4% Now married0.0% Separated8.2% Widowed15.2% DivorcedWomen who gave birth in the past 12 months Now married:
100.0% (48)Unmarried:
0.0% (0)
Women who did not give birth in the past 12 months Now married:
50.2% (154)Unmarried:
49.8% (153)
Marital status - Two or more races population 15 years and over
Males 42.3% Never married33.9% Now married3.9% Separated0.6% Widowed19.3% DivorcedFemales 43.8% Never married33.5% Now married2.4% Separated3.4% Widowed16.9% DivorcedWomen who gave birth in the past 12 months Now married:
63.1% (55)Unmarried:
36.9% (32)
Women who did not give birth in the past 12 months Now married:
34.9% (400)Unmarried:
65.1% (748)
Marital status - White alone, not Hispanic / Latino population 15 years and over
Males 28.2% Never married55.5% Now married1.3% Separated3.3% Widowed11.7% DivorcedFemales 16.6% Never married52.8% Now married1.7% Separated13.6% Widowed15.4% DivorcedWomen who gave birth in the past 12 months Now married:
84.7% (276)Unmarried:
15.3% (50)
Women who did not give birth in the past 12 months Now married:
52.6% (2,661)Unmarried:
47.4% (2,400)
Marital status - Hispanic or Latino population 15 years and over
Males 40.9% Never married51.1% Now married0.0% Separated1.4% Widowed6.6% DivorcedFemales 31.1% Never married41.5% Now married0.0% Separated9.5% Widowed18.0% DivorcedWomen who gave birth in the past 12 months Now married:
100.0% (82)Unmarried:
0.0% (0)
Women who did not give birth in the past 12 months Now married:
41.2% (317)Unmarried:
58.8% (452)
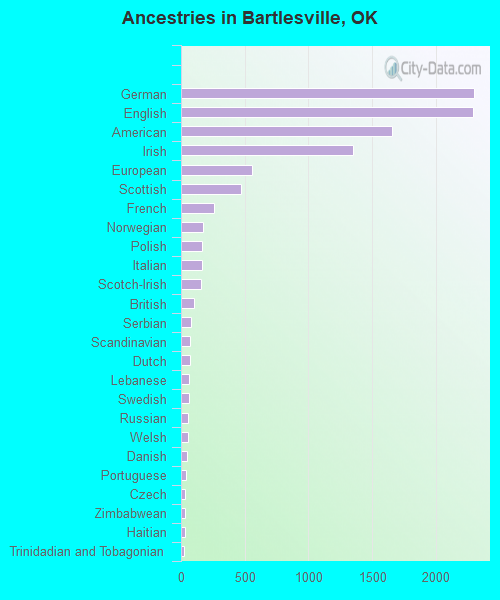
Ancestries in Bartlesville
2,302 13.4% German2,288 13.3% English1,655 9.6% American1,346 7.8% Irish560 3.3% European470 2.7% Scottish256 1.5% French171 1.0% Norwegian168 1.0% Polish167 1.0% Italian155 0.9% Scotch-Irish105 0.6% British75 0.4% Serbian68 0.4% Scandinavian68 0.4% Dutch63 0.4% Lebanese63 0.4% Swedish56 0.3% Russian55 0.3% Welsh45 0.3% Danish40 0.2% Portuguese34 0.2% Czech33 0.2% Zimbabwean28 0.2% Haitian26 0.2% Trinidadian and Tobagonian20 0.1% Northern European17 0.10% Brazilian17 0.10% African17 0.10% Hungarian16 0.09% Iranian14 0.08% Dutch West Indian12 0.07% Canadian11 0.06% Czechoslovakian10 0.06% Nigerian9 0.05% British West Indian8 0.05% French Canadian7 0.04% Ukrainian5 0.03% Basque1 0.01% Maltese
Geographical mobility in Bartlesville Same house 1 year ago 22,965 88.0% White (Caucasian)1,101 86.4% Black or African American2,589 86.7% American Indian / Alaska Native862 89.8% Asian6 60.8% Native Hawaiian / Pacific Islander1,072 83.2% Other race3,865 86.9% Two or more races22,932 87.8% White alone, not Hispanic / Latino2,263 84.3% Hispanic or LatinoMoved within same county 1,234 4.7% White / Caucasian50 3.9% Black or African American133 4.5% American Indian / Alaska Native16 1.6% Asian3 30.3% Native Hawaiian / Pacific Islander175 13.6% Other race273 6.1% Two or more races1,248 4.8% White alone, not Hispanic / Latino237 8.8% Hispanic or LatinoMoved within same state 1,017 3.9% White / Caucasian78 6.1% Black or African American195 6.5% American Indian / Alaska Native13 1.3% Asian197 4.4% Two or more races996 3.8% White alone, not Hispanic / Latino78 2.9% Hispanic or LatinoMoved from different state 850 3.3% White / Caucasian70 5.5% Black or African American90 3.0% American Indian / Alaska Native77 8.0% Asian19 1.5% Other race59 1.3% Two or more races868 3.3% White alone, not Hispanic / Latino95 3.5% Hispanic or LatinoMoved from abroad 130 0.5% White103 2.3% Two or more races161 0.6% White alone, not Hispanic / Latino
Children Nativity (place of birth) in Bartlesville
Children under 6 years - Living with two parents Both parents native 1,570 100.0% NativeBoth parents foreign-born 274 91.5% Native25 8.5% Foreign-bornOne native, one foreign-born parent 53 100.0% NativeChildren under 6 years - Living with one parent Native parent 681 100.0% NativeForeign-born parent 10 100.0% NativeChildren 6 to 17 years - Living with two parents Both parents native 3,288 100.0% Native1 0.0% Foreign-bornBoth parents foreign-born 204 80.0% Native51 20.0% Foreign-bornOne native, one foreign-born parent 150 100.0% NativeChildren 6 to 17 years - Living with one parent Native parent 1,947 100.0% NativeForeign-born parent 83 49.9% Native83 50.1% Foreign-born
Grandparents responsible for own grandchildren in Bartlesville
Grandparents (30 to 59 years) White / Caucasian 55 81.3% Responsible for grandchildren13 18.7% Not responsible for grandchildrenAmerican Indian / Alaska Native 10 46.4% Responsible for grandchildren11 53.6% Not responsible for grandchildrenAsian 9 100.0% Responsible for grandchildrenOther race 19 100.0% Responsible for grandchildrenTwo or more races 14 100.0% Responsible for grandchildrenWhite alone, not Hispanic / Latino 50 83.9% Responsible for grandchildren10 16.1% Not responsible for grandchildrenHispanic or Latino 30 85.5% Responsible for grandchildren5 14.5% Not responsible for grandchildrenGrandparents (60 years and over) White / Caucasian 63 37.6% Responsible for grandchildren104 62.4% Not responsible for grandchildrenAmerican Indian / Alaska Native 6 56.8% Responsible for grandchildren4 43.2% Not responsible for grandchildrenOther race 5 100.0% Responsible for grandchildrenTwo or more races 5 13.3% Responsible for grandchildren30 86.7% Not responsible for grandchildrenWhite alone, not Hispanic / Latino 62 36.5% Responsible for grandchildren108 63.5% Not responsible for grandchildrenHispanic or Latino 6 100.0% Responsible for grandchildren