Races in Budd Lake, New Jersey (NJ) Detailed Stats
Data:
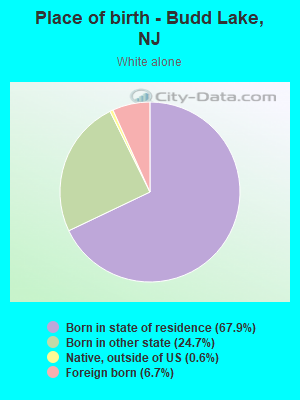
Races - White alone (%)
Races - White alone (% change since 2000)
Races - Black alone (%)
Races - Black alone (% change since 2000)
Races - American Indian alone (%)
Races - American Indian alone (% change since 2000)
Races - Asian alone (%)
Races - Asian alone (% change since 2000)
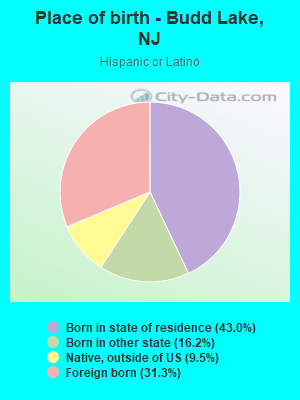
Races - Hispanic (%)
Races - Hispanic (% change since 2000)
Races - Native Hawaiian and Other Pacific Islander alone (%)
Races - Native Hawaiian and Other Pacific Islander alone (% change since 2000)
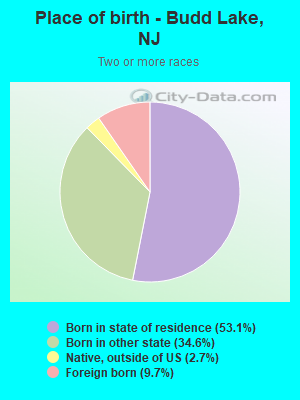
Races - Two or more races(%)
Races - Two or more races(% change since 2000)
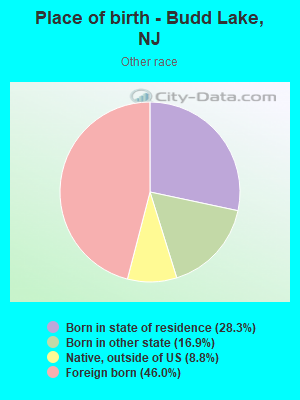
Races - Other race alone (%)
Races - Other race alone (% change since 2000)
Racial diversity
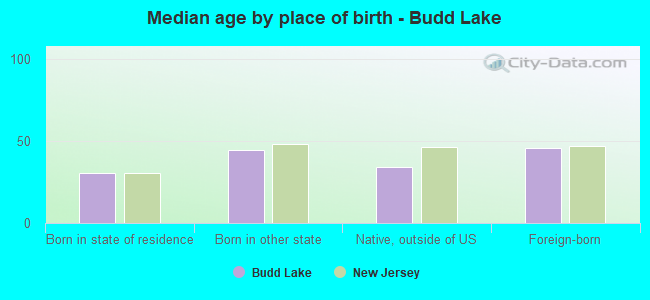
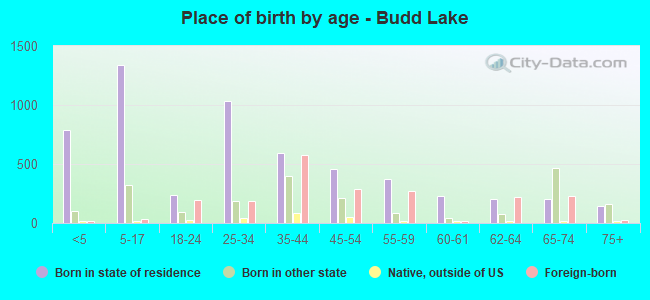
Place of birth - Born in state of residence (%)
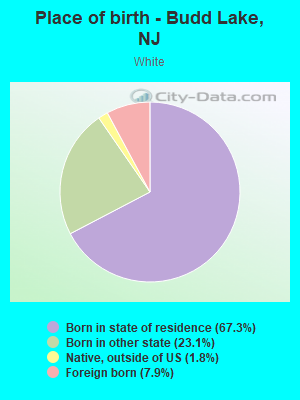
Place of birth - Born in state of residence (%) - White
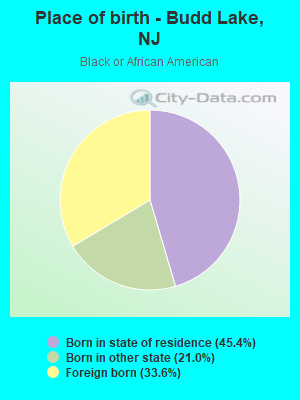
Place of birth - Born in state of residence (%) - Black or African American
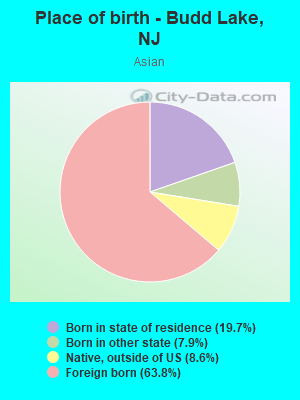
Place of birth - Born in state of residence (%) - Asian
Place of birth - Born in state of residence (%) - Hispanic or Latino
Place of birth - Born in state of residence (%) - American Indian and Alaska Native
Place of birth - Born in state of residence (%) - Multirace
Place of birth - Born in state of residence (%) - Other Race
Place of birth - Born in other state (%)
Place of birth - Born in other state (%) - White
Place of birth - Born in other state (%) - Black or African American
Place of birth - Born in other state (%) - Asian
Place of birth - Born in other state (%) - Hispanic or Latino
Place of birth - Born in other state (%) - American Indian and Alaska Native
Place of birth - Born in other state (%) - Multirace
Place of birth - Born in other state (%) - Other Race
Place of birth - Native, outside of US (%)
Place of birth - Native, outside of US (%) - White
Place of birth - Native, outside of US (%) - Black or African American
Place of birth - Native, outside of US (%) - Asian
Place of birth - Native, outside of US (%) - Hispanic or Latino
Place of birth - Native, outside of US (%) - American Indian and Alaska Native
Place of birth - Native, outside of US (%) - Multirace
Place of birth - Native, outside of US (%) - Other Race
Place of birth - Foreign born (%)
Place of birth - Foreign born (%) - White
Place of birth - Foreign born (%) - Black or African American
Place of birth - Foreign born (%) - Asian
Place of birth - Foreign born (%) - Hispanic or Latino
Place of birth - Foreign born (%) - American Indian and Alaska Native
Place of birth - Foreign born (%) - Multirace
Place of birth - Foreign born (%) - Other Race
Residents speaking English at home (%)
Residents speaking English at home - Born in the United States (%)
Residents speaking English at home - Native, born elsewhere (%)
Residents speaking English at home - Foreign born (%)
Residents speaking Spanish at home (%)
Residents speaking Spanish at home - Born in the United States (%)
Residents speaking Spanish at home - Native, born elsewhere (%)
Residents speaking Spanish at home - Foreign born (%)
Residents speaking other language at home (%)
Residents speaking other language at home - Born in the United States (%)
Residents speaking other language at home - Native, born elsewhere (%)
Residents speaking other language at home - Foreign born (%)
Marital status - Never married (%)
Marital status - Now married (%)
Marital status - Separated (%)
Marital status - Widowed (%)
Marital status - Divorced (%)
Ancestries Reported - Arab (%)
Ancestries Reported - Czech (%)
Ancestries Reported - Danish (%)
Ancestries Reported - Dutch (%)
Ancestries Reported - English (%)
Ancestries Reported - French (%)
Ancestries Reported - French Canadian (%)
Ancestries Reported - German (%)
Ancestries Reported - Greek (%)
Ancestries Reported - Hungarian (%)
Ancestries Reported - Irish (%)
Ancestries Reported - Italian (%)
Ancestries Reported - Lithuanian (%)
Ancestries Reported - Norwegian (%)
Ancestries Reported - Polish (%)
Ancestries Reported - Portuguese (%)
Ancestries Reported - Russian (%)
Ancestries Reported - Scotch-Irish (%)
Ancestries Reported - Scottish (%)
Ancestries Reported - Slovak (%)
Ancestries Reported - Subsaharan African (%)
Ancestries Reported - Swedish (%)
Ancestries Reported - Swiss (%)
Ancestries Reported - Ukrainian (%)
Ancestries Reported - United States (%)
Ancestries Reported - Welsh (%)
Ancestries Reported - West Indian (%)
Ancestries Reported - Other (%)
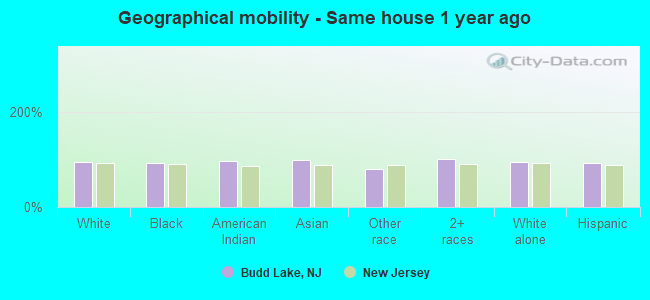
Geographical mobility - Same house 1 year ago (%)
Geographical mobility - Same house 1 year ago (%) - White
Geographical mobility - Same house 1 year ago (%) - Black or African American
Geographical mobility - Same house 1 year ago (%) - Asian
Geographical mobility - Same house 1 year ago (%) - Hispanic or Latino
Geographical mobility - Same house 1 year ago (%) - American Indian and Alaska Native
Geographical mobility - Same house 1 year ago (%) - Multirace
Geographical mobility - Same house 1 year ago (%) - Other Race
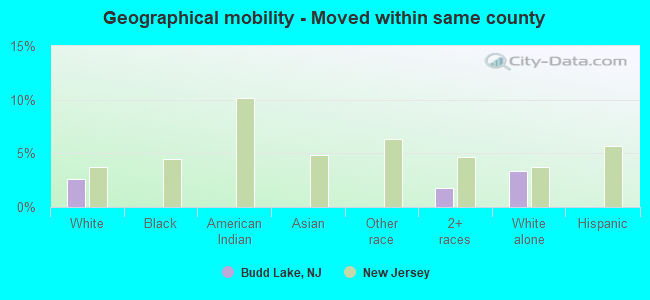
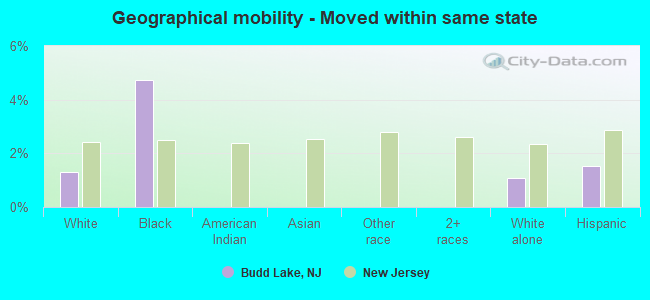
Geographical mobility - Moved within same county (%)
Geographical mobility - Moved within same county (%) - White
Geographical mobility - Moved within same county (%) - Black or African American
Geographical mobility - Moved within same county (%) - Asian
Geographical mobility - Moved within same county (%) - Hispanic or Latino
Geographical mobility - Moved within same county (%) - American Indian and Alaska Native
Geographical mobility - Moved within same county (%) - Multirace
Geographical mobility - Moved within same county (%) - Other Race
Geographical mobility - Moved from different county within same state (%)
Geographical mobility - Moved from different county within same state (%) - White
Geographical mobility - Moved from different county within same state (%) - Black or African American
Geographical mobility - Moved from different county within same state (%) - Asian
Geographical mobility - Moved from different county within same state (%) - Hispanic or Latino
Geographical mobility - Moved from different county within same state (%) - American Indian and Alaska Native
Geographical mobility - Moved from different county within same state (%) - Multirace
Geographical mobility - Moved from different county within same state (%) - Other Race
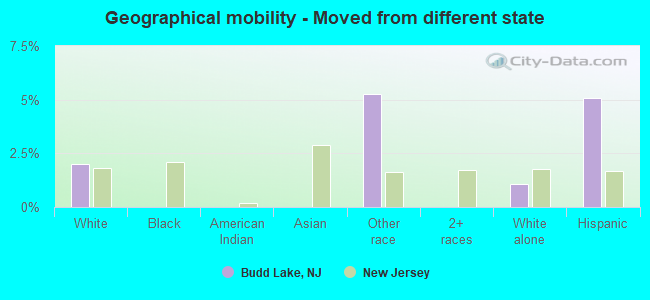
Geographical mobility - Moved from different state (%)
Geographical mobility - Moved from different state (%) - White
Geographical mobility - Moved from different state (%) - Black or African American
Geographical mobility - Moved from different state (%) - Asian
Geographical mobility - Moved from different state (%) - Hispanic or Latino
Geographical mobility - Moved from different state (%) - American Indian and Alaska Native
Geographical mobility - Moved from different state (%) - Multirace
Geographical mobility - Moved from different state (%) - Other Race
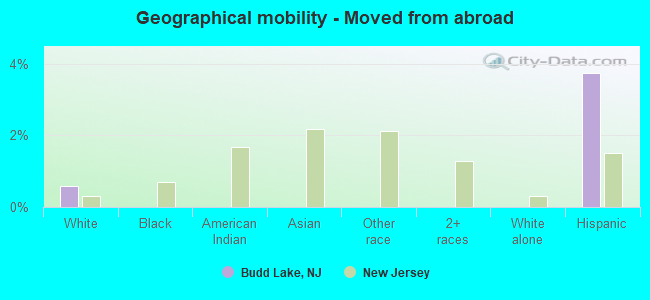
Geographical mobility - Moved from abroad (%)
Geographical mobility - Moved from abroad (%) - White
Geographical mobility - Moved from abroad (%) - Black or African American
Geographical mobility - Moved from abroad (%) - Asian
Geographical mobility - Moved from abroad (%) - Hispanic or Latino
Geographical mobility - Moved from abroad (%) - American Indian and Alaska Native
Geographical mobility - Moved from abroad (%) - Multirace
Geographical mobility - Moved from abroad (%) - Other Race
Place of birth for the foreign-born population - Ireland (%)
Place of birth for the foreign-born population - Denmark (%)
Place of birth for the foreign-born population - Norway (%)
Place of birth for the foreign-born population - Sweden (%)
Place of birth for the foreign-born population - United Kingdom (%)
Place of birth for the foreign-born population - England (%)
Place of birth for the foreign-born population - Scotland (%)
Place of birth for the foreign-born population - Other Northern Europe (%)
Place of birth for the foreign-born population - Austria (%)
Place of birth for the foreign-born population - Belgium (%)
Place of birth for the foreign-born population - France (%)
Place of birth for the foreign-born population - Germany (%)
Place of birth for the foreign-born population - Netherlands (%)
Place of birth for the foreign-born population - Switzerland (%)
Place of birth for the foreign-born population - Other Western Europe (%)
Place of birth for the foreign-born population - Greece (%)
Place of birth for the foreign-born population - Italy (%)
Place of birth for the foreign-born population - Portugal (%)
Place of birth for the foreign-born population - Spain (%)
Place of birth for the foreign-born population - Other Southern Europe (%)
Place of birth for the foreign-born population - Albania (%)
Place of birth for the foreign-born population - Belarus (%)
Place of birth for the foreign-born population - Bosnia and Herzegovina (%)
Place of birth for the foreign-born population - Bulgaria (%)
Place of birth for the foreign-born population - Croatia (%)
Place of birth for the foreign-born population - Czechoslovakia (%)
Place of birth for the foreign-born population - Hungary (%)
Place of birth for the foreign-born population - Latvia (%)
Place of birth for the foreign-born population - Lithuania (%)
Place of birth for the foreign-born population - North Macedonia (Macedonia) (%)
Place of birth for the foreign-born population - Moldova (%)
Place of birth for the foreign-born population - Poland (%)
Place of birth for the foreign-born population - Romania (%)
Place of birth for the foreign-born population - Russia (%)
Place of birth for the foreign-born population - Serbia (%)
Place of birth for the foreign-born population - Ukraine (%)
Place of birth for the foreign-born population - Other Eastern Europe (%)
Place of birth for the foreign-born population - China (%)
Place of birth for the foreign-born population - Hong Kong (%)
Place of birth for the foreign-born population - Taiwan (%)
Place of birth for the foreign-born population - Japan (%)
Place of birth for the foreign-born population - Korea (%)
Place of birth for the foreign-born population - Other Eastern Asia (%)
Place of birth for the foreign-born population - Afghanistan (%)
Place of birth for the foreign-born population - Bangladesh (%)
Place of birth for the foreign-born population - India (%)
Place of birth for the foreign-born population - Iran (%)
Place of birth for the foreign-born population - Kazakhstan (%)
Place of birth for the foreign-born population - Nepal (%)
Place of birth for the foreign-born population - Pakistan (%)
Place of birth for the foreign-born population - Sri Lanka (%)
Place of birth for the foreign-born population - Uzbekistan (%)
Place of birth for the foreign-born population - Other South Central Asia (%)
Place of birth for the foreign-born population - Burma (%)
Place of birth for the foreign-born population - Cambodia (%)
Place of birth for the foreign-born population - Indonesia (%)
Place of birth for the foreign-born population - Laos (%)
Place of birth for the foreign-born population - Malaysia (%)
Place of birth for the foreign-born population - Philippines (%)
Place of birth for the foreign-born population - Singapore (%)
Place of birth for the foreign-born population - Thailand (%)
Place of birth for the foreign-born population - Vietnam (%)
Place of birth for the foreign-born population - Other South Eastern Asia (%)
Place of birth for the foreign-born population - Armenia (%)
Place of birth for the foreign-born population - Iraq (%)
Place of birth for the foreign-born population - Israel (%)
Place of birth for the foreign-born population - Jordan (%)
Place of birth for the foreign-born population - Kuwait (%)
Place of birth for the foreign-born population - Lebanon (%)
Place of birth for the foreign-born population - Saudi Arabia (%)
Place of birth for the foreign-born population - Syria (%)
Place of birth for the foreign-born population - Turkey (%)
Place of birth for the foreign-born population - Yemen (%)
Place of birth for the foreign-born population - Other Western Asia (%)
Place of birth for the foreign-born population - Eritrea (%)
Place of birth for the foreign-born population - Ethiopia (%)
Place of birth for the foreign-born population - Kenya (%)
Place of birth for the foreign-born population - Somalia (%)
Place of birth for the foreign-born population - Uganda (%)
Place of birth for the foreign-born population - Zimbabwe (%)
Place of birth for the foreign-born population - Other Eastern Africa (%)
Place of birth for the foreign-born population - Cameroon (%)
Place of birth for the foreign-born population - Congo (%)
Place of birth for the foreign-born population - Democratic Republic of Congo (Zaire) (%)
Place of birth for the foreign-born population - Other Middle Africa (%)
Place of birth for the foreign-born population - Egypt (%)
Place of birth for the foreign-born population - Morocco (%)
Place of birth for the foreign-born population - Sudan (%)
Place of birth for the foreign-born population - Other Northern Africa (%)
Place of birth for the foreign-born population - South Africa (%)
Place of birth for the foreign-born population - Other Southern Africa (%)
Place of birth for the foreign-born population - Cabo Verde (%)
Place of birth for the foreign-born population - Ghana (%)
Place of birth for the foreign-born population - Liberia (%)
Place of birth for the foreign-born population - Nigeria (%)
Place of birth for the foreign-born population - Senegal (%)
Place of birth for the foreign-born population - Sierra Leone (%)
Place of birth for the foreign-born population - Other Western Africa (%)
Place of birth for the foreign-born population - Australia (%)
Place of birth for the foreign-born population - New Zealand (%)
Place of birth for the foreign-born population - Fiji (%)
Place of birth for the foreign-born population - Micronesia (%)
Place of birth for the foreign-born population - Bahamas (%)
Place of birth for the foreign-born population - Barbados (%)
Place of birth for the foreign-born population - Cuba (%)
Place of birth for the foreign-born population - Dominica (%)
Place of birth for the foreign-born population - Dominican Republic (%)
Place of birth for the foreign-born population - Grenada (%)
Place of birth for the foreign-born population - Haiti (%)
Place of birth for the foreign-born population - Jamaica (%)
Place of birth for the foreign-born population - St. Vincent and the Grenadines (%)
Place of birth for the foreign-born population - Trinidad and Tobago (%)
Place of birth for the foreign-born population - West Indies (%)
Place of birth for the foreign-born population - Other Caribbean (%)
Place of birth for the foreign-born population - Belize (%)
Place of birth for the foreign-born population - Costa Rica (%)
Place of birth for the foreign-born population - El Salvador (%)
Place of birth for the foreign-born population - Guatemala (%)
Place of birth for the foreign-born population - Honduras (%)
Place of birth for the foreign-born population - Mexico (%)
Place of birth for the foreign-born population - Nicaragua (%)
Place of birth for the foreign-born population - Panama (%)
Place of birth for the foreign-born population - Other Central America (%)
Place of birth for the foreign-born population - Argentina (%)
Place of birth for the foreign-born population - Bolivia (%)
Place of birth for the foreign-born population - Brazil (%)
Place of birth for the foreign-born population - Chile (%)
Place of birth for the foreign-born population - Colombia (%)
Place of birth for the foreign-born population - Ecuador (%)
Place of birth for the foreign-born population - Guyana (%)
Place of birth for the foreign-born population - Peru (%)
Place of birth for the foreign-born population - Uruguay (%)
Place of birth for the foreign-born population - Venezuela (%)
Place of birth for the foreign-born population - Other South America (%)
Place of birth for the foreign-born population - Canada (%)
Place of birth for the foreign-born population - Other Northern America (%)
Place of birth for the foreign-born population - Other (%)
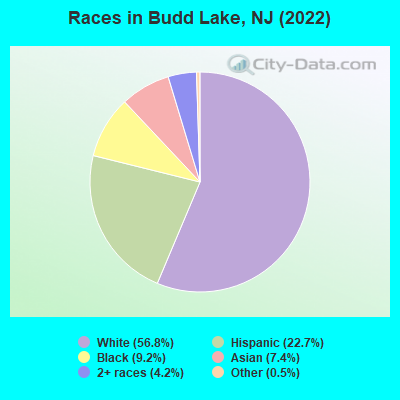
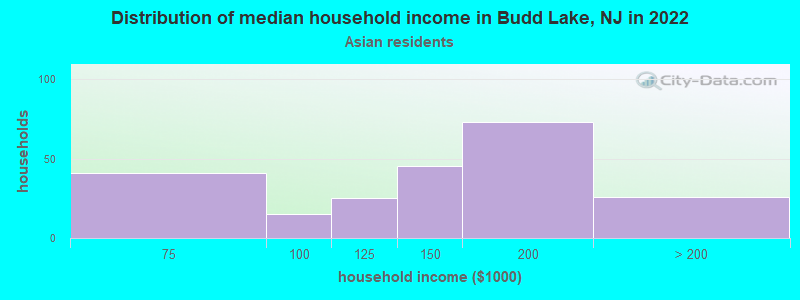
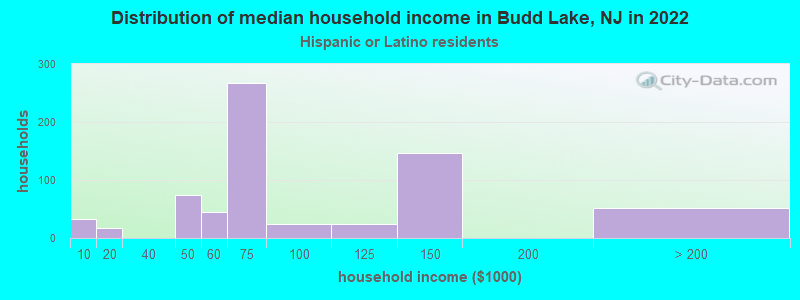
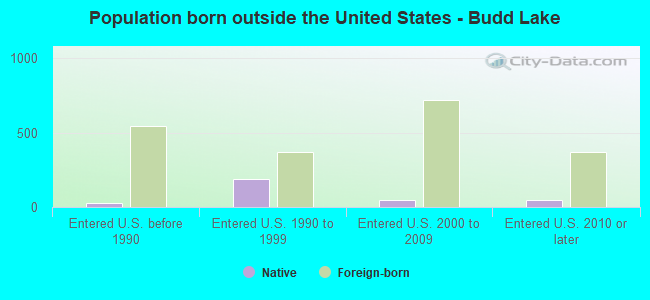
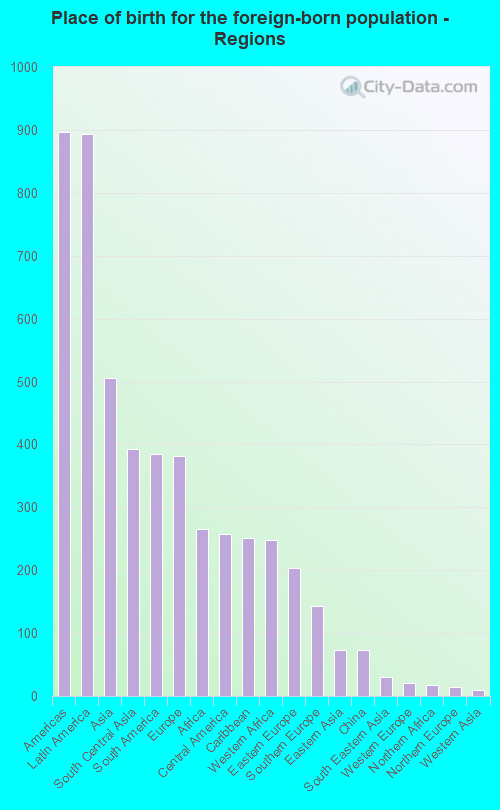
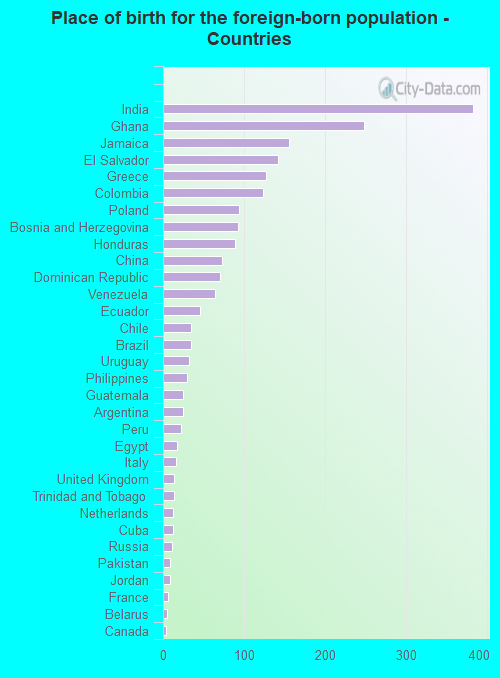
According to 2022 data, the most numerous races in Budd Lake, NJ are White alone (5,691 residents), Hispanic (2,278 residents), and Black alone (919 residents). 67.5% of Budd Lake residents speak English at home. 20.4% of Budd Lake, NJ residents are foreign-born (8.8% born in Latin America, 5.0% born in Asia, 3.8% born in Europe, 2.6% born in Africa), which is 12.5% less than the foreign-born rate of 23.0% across the entire state of New Jersey.
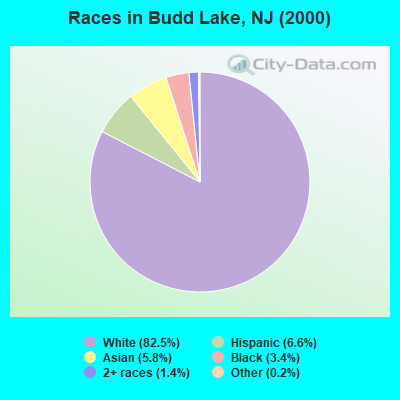
Race distribution in Budd Lake
2000 2022
5,557,209 66.0% White alone 1,117,191 13.3% Hispanic 1,096,171 13.0% Black alone 477,012 5.7% Asian alone 133,689 1.6% Two or more races 19,565 0.2% Other race alone 11,338 0.1% American Indian alone 2,175 0.03% Native Hawaiian and Other
4,766,476 51.5% White alone 2,028,470 21.9% Hispanic 1,111,632 12.0% Black alone 923,546 10.0% Asian alone 332,237 3.6% Two or more races 89,847 1.0% Other race alone 8,557 0.09% American Indian alone 934 0.01% Native Hawaiian and Other
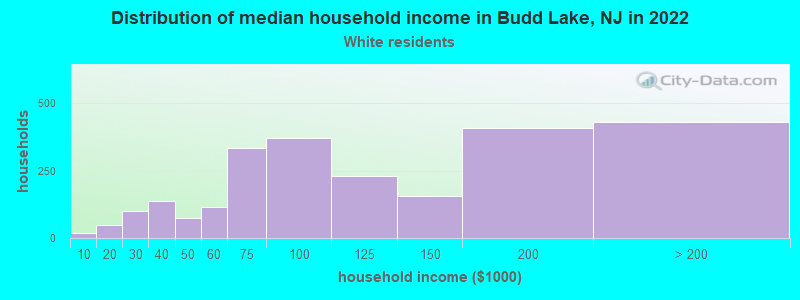
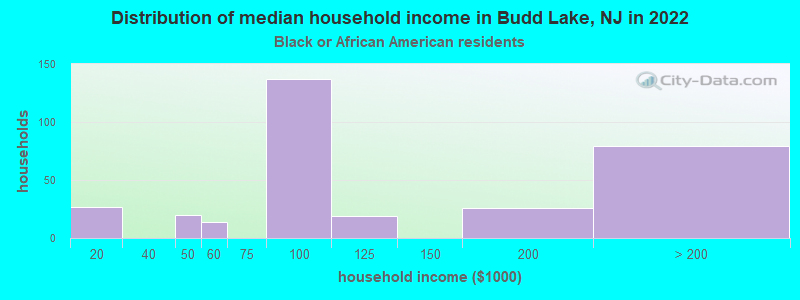
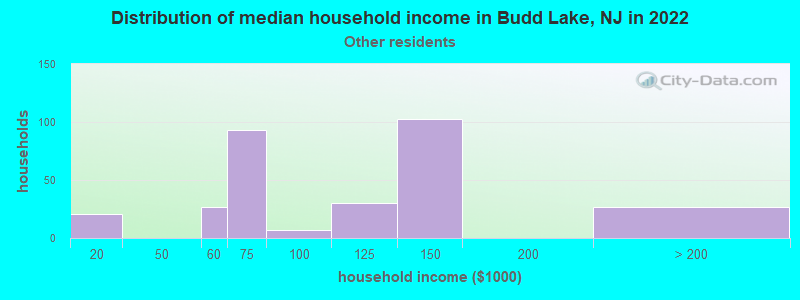
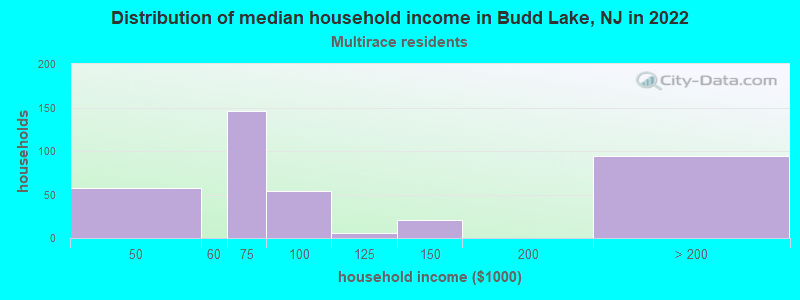
Income and house value in Budd Lake Median household income in 2022 $106,422 White non-Hispanic householders$123,528 Black householders$142,109 Asian householders$101,916 Some other race householders$88,135 Two or more races householders$77,894 Hispanic or Latino race householdersMedian 2022 house value $391,523 White Non-Hispanic householders$460,497 Black or African American householders $609,383 Asian householders$153,573 Some other race householders$390,630 Two or more races householders$302,236 Hispanic or Latino householders
Median age by race in Budd Lake
39.2 Median age for White residents39.0 39.4 36.7 Median age for Black or African American residents39.3 31.6 -847,710,329.3 Median age for American Indian / Alaska Native residents-707,246,376.1 -671,264,367.1 37.5 Median age for Asian residents35.8 37.2 -804,177,544.9 Median age for Native Hawaiian / Pacific Islander residents-666,666,666.0 -713,070,378.3 29.9 Median age for Other race residents38.5 25.8 33.8 Median age for Two or more races residents30.5 35.5 41.8 Median age for White alone residents43.7 40.5 30.1 Median age for Hispanic or Latino residents29.0 30.4
Owner/renter occupied households by race in Budd Lake
House owners and renters - White residents 1,907 79.7% Owner occupied486 20.3% Renter occupiedHouse owners and renters - Black or African American residents 130 41.1% Owner occupied187 58.9% Renter occupiedHouse owners and renters - American Indian / Alaska Native residents 37 100.0% Owner occupiedHouse owners and renters - Asian residents 238 92.9% Owner occupied18 7.1% Renter occupiedHouse owners and renters - Other race residents 177 59.8% Owner occupied119 40.2% Renter occupiedHouse owners and renters - Two or more races residents 403 86.8% Owner occupied61 13.2% Renter occupiedHouse owners and renters - White alone residents 1,833 80.9% Owner occupied432 19.1% Renter occupiedHouse owners and renters - Hispanic or Latino residents 488 69.0% Owner occupied220 31.0% Renter occupied
Language usage in Budd Lake
English speakers - Total 67.5% of residents of Budd Lake speak English at home.
13.8% of residents speak Spanish at home 774 61.6% Speak English very well483 38.4% Speak English less than very well18.9% of residents speak other language at home 1,509 87.6% Speak English very well213 12.4% Speak English less than very well
English speakers - Born in the United States 89.0% of residents of Budd Lake speak English at home.
5.6% of residents speak Spanish at home 87 77.0% Speak English very well26 23.0% Speak English less than very well5.3% of residents speak other language at home 77 72.0% Speak English very well30 28.0% Speak English less than very well
English speakers - Native, born elsewhere 32.8% of residents of Budd Lake speak English at home.
46.1% of residents speak Spanish at home 91 72.8% Speak English very well34 27.2% Speak English less than very well17.3% of residents speak other language at home 47 100.0% Speak English very well
English speakers - Foreign-born 10.5% of residents of Budd Lake speak English at home.
30.7% of residents speak Spanish at home 273 44.8% Speak English very well336 55.2% Speak English less than very well59.4% of residents speak other language at home 1,008 85.6% Speak English very well169 14.4% Speak English less than very well
White (Caucasian) - Speak only English Native:
89.1% (4,700)Foreign-born:
4.5% (23)
White (Caucasian) - Speak another language Native:
9.7% (510)Foreign-born:
88.4% (441)
Black or African American - Speak only English Native:
100.0% (449)Foreign-born:
42.6% (106)
Asian - Speak only English Native:
20.0% (45)Foreign-born:
0.2% (1)
Asian - Speak another language Native:
77.5% (174)Foreign-born:
100.0% (472)
Other race - Speak only English Native:
48.4% (153)Foreign-born:
10.7% (41)
Other race - Speak another language Native:
48.9% (154)Foreign-born:
89.6% (344)
Two or more races - Speak another language Native:
31.2% (324)Foreign-born:
97.9% (115)
White alone - Speak only English Native:
93.7% (4,511)Foreign-born:
2.1% (8)
White alone - Speak another language Native:
6.3% (305)Foreign-born:
100.0% (384)
Hispanic or Latino - Speak only English Native:
49.8% (674)Foreign-born:
14.5% (103)
Hispanic or Latino - Speak another language Native:
50.2% (680)Foreign-born:
86.9% (618)
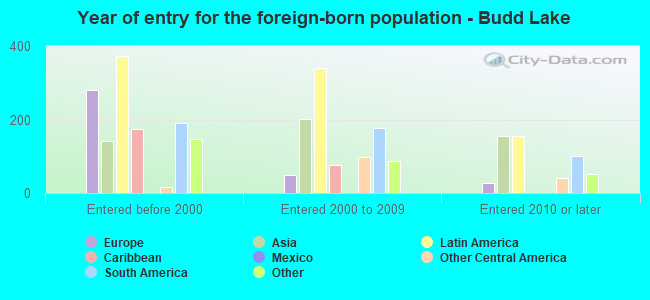
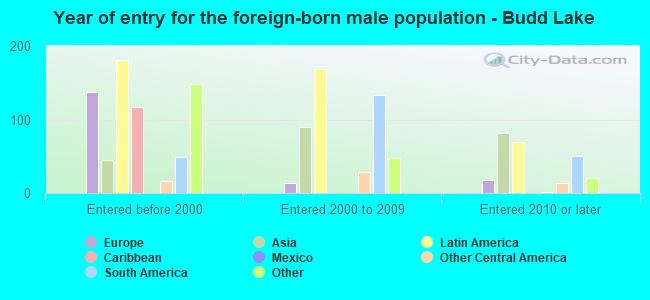
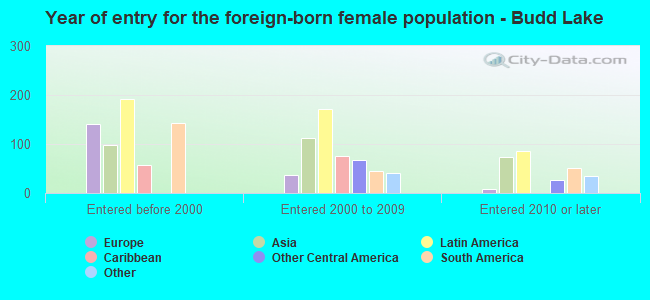
Foreign-born residents in Budd Lake 2,050 residents are foreign born (8.8% Latin America , 5.0% Asia , 3.8% Europe , 2.6% Africa ).
This city:
20.4%New Jersey:
23.2%
Marital status for residents in Budd Lake Marital status - White (Caucasian) population 15 years and over
Males 29.3% Never married53.2% Now married2.1% Separated6.7% Widowed8.7% DivorcedFemales 19.0% Never married57.4% Now married1.2% Separated6.5% Widowed15.9% DivorcedWomen who gave birth in the past 12 months Now married:
61.3% (90)Unmarried:
38.7% (57)
Women who did not give birth in the past 12 months Now married:
56.0% (621)Unmarried:
44.0% (487)
Marital status - Black or African American population 15 years and over
Males 37.8% Never married51.8% Now married10.4% Separated0.0% Widowed0.0% DivorcedFemales 43.3% Never married42.0% Now married0.0% Separated9.6% Widowed5.2% DivorcedWomen who did not give birth in the past 12 months Now married:
42.6% (118)Unmarried:
57.4% (160)
Marital status - Asian population 15 years and over
Males 5.9% Never married86.8% Now married0.0% Separated7.4% Widowed0.0% DivorcedFemales 26.0% Never married65.2% Now married0.0% Separated8.8% Widowed0.0% DivorcedWomen who did not give birth in the past 12 months Now married:
55.0% (154)Unmarried:
45.0% (126)
Marital status - Other race population 15 years and over
Males 39.0% Never married42.6% Now married6.3% Separated3.6% Widowed8.5% DivorcedFemales 50.5% Never married33.2% Now married9.8% Separated0.0% Widowed6.5% DivorcedWomen who gave birth in the past 12 months Now married:
0.0% (0)Unmarried:
100.0% (77)
Women who did not give birth in the past 12 months Now married:
54.0% (100)Unmarried:
46.0% (85)
Marital status - Two or more races population 15 years and over
Males 70.2% Never married26.7% Now married0.0% Separated0.0% Widowed3.0% DivorcedFemales 35.7% Never married42.6% Now married0.0% Separated0.0% Widowed21.7% DivorcedWomen who gave birth in the past 12 months Now married:
20.8% (15)Unmarried:
79.2% (58)
Women who did not give birth in the past 12 months Now married:
21.3% (36)Unmarried:
78.7% (133)
Marital status - White alone, not Hispanic / Latino population 15 years and over
Males 27.3% Never married53.1% Now married2.4% Separated7.5% Widowed9.7% DivorcedFemales 18.8% Never married57.1% Now married0.7% Separated7.6% Widowed15.8% DivorcedWomen who gave birth in the past 12 months Now married:
56.6% (78)Unmarried:
43.4% (60)
Women who did not give birth in the past 12 months Now married:
54.3% (503)Unmarried:
45.7% (423)
Marital status - Hispanic or Latino population 15 years and over
Males 54.0% Never married40.3% Now married1.9% Separated0.0% Widowed3.9% DivorcedFemales 31.3% Never married47.4% Now married4.9% Separated0.0% Widowed16.4% DivorcedWomen who gave birth in the past 12 months Now married:
22.5% (30)Unmarried:
77.5% (104)
Women who did not give birth in the past 12 months Now married:
54.0% (249)Unmarried:
46.0% (212)
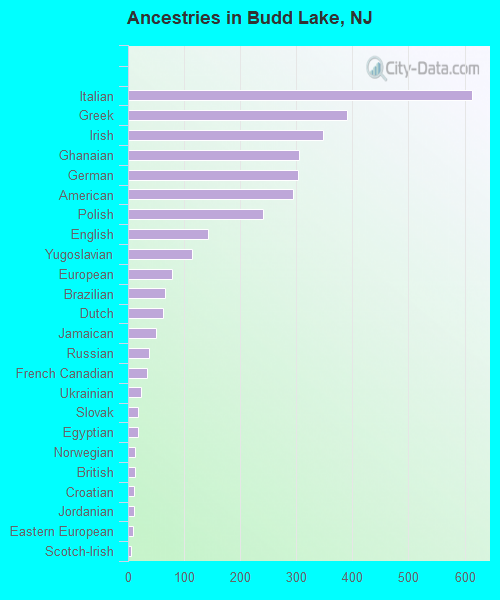
Ancestries in Budd Lake
613 11.7% Italian390 7.5% Greek348 6.7% Irish305 5.8% Ghanaian303 5.8% German294 5.6% American240 4.6% Polish142 2.7% English114 2.2% Yugoslavian78 1.5% European66 1.3% Brazilian62 1.2% Dutch50 1.0% Jamaican37 0.7% Russian33 0.6% French Canadian24 0.5% Ukrainian18 0.3% Slovak17 0.3% Egyptian13 0.2% Norwegian12 0.2% British11 0.2% Croatian10 0.2% Jordanian9 0.2% Eastern European6 0.1% Scotch-Irish5 0.10% French
Children Nativity (place of birth) in Budd Lake
Children under 6 years - Living with two parents Both parents native 520 100.0% NativeBoth parents foreign-born 121 100.0% NativeOne native, one foreign-born parent 98 100.0% NativeChildren under 6 years - Living with one parent Native parent 203 100.0% NativeForeign-born parent 84 100.0% NativeChildren 6 to 17 years - Living with two parents Both parents native 826 100.0% NativeBoth parents foreign-born 294 94.4% Native18 5.6% Foreign-bornOne native, one foreign-born parent 103 100.0% NativeChildren 6 to 17 years - Living with one parent Native parent 112 100.0% NativeForeign-born parent 173 51.9% Native160 48.1% Foreign-born
Grandparents responsible for own grandchildren in Budd Lake
Grandparents (30 to 59 years) Other race 16 100.0% Not responsible for grandchildrenHispanic or Latino 12 100.0% Not responsible for grandchildren
Grandparents (60 years and over) Other race 20 100.0% Not responsible for grandchildrenHispanic or Latino 72 100.0% Not responsible for grandchildren