Races in Burlington, Vermont (VT) Detailed Stats
Data:
Races - White alone (%)
Races - White alone (% change since 2000)
Races - Black alone (%)
Races - Black alone (% change since 2000)
Races - American Indian alone (%)
Races - American Indian alone (% change since 2000)
Races - Asian alone (%)
Races - Asian alone (% change since 2000)
Races - Hispanic (%)
Races - Hispanic (% change since 2000)
Races - Native Hawaiian and Other Pacific Islander alone (%)
Races - Native Hawaiian and Other Pacific Islander alone (% change since 2000)
Races - Two or more races(%)
Races - Two or more races(% change since 2000)
Races - Other race alone (%)
Races - Other race alone (% change since 2000)
Racial diversity
Place of birth - Born in state of residence (%)
Place of birth - Born in state of residence (%) - White
Place of birth - Born in state of residence (%) - Black or African American
Place of birth - Born in state of residence (%) - Asian
Place of birth - Born in state of residence (%) - Hispanic or Latino
Place of birth - Born in state of residence (%) - American Indian and Alaska Native
Place of birth - Born in state of residence (%) - Multirace
Place of birth - Born in state of residence (%) - Other Race
Place of birth - Born in other state (%)
Place of birth - Born in other state (%) - White
Place of birth - Born in other state (%) - Black or African American
Place of birth - Born in other state (%) - Asian
Place of birth - Born in other state (%) - Hispanic or Latino
Place of birth - Born in other state (%) - American Indian and Alaska Native
Place of birth - Born in other state (%) - Multirace
Place of birth - Born in other state (%) - Other Race
Place of birth - Native, outside of US (%)
Place of birth - Native, outside of US (%) - White
Place of birth - Native, outside of US (%) - Black or African American
Place of birth - Native, outside of US (%) - Asian
Place of birth - Native, outside of US (%) - Hispanic or Latino
Place of birth - Native, outside of US (%) - American Indian and Alaska Native
Place of birth - Native, outside of US (%) - Multirace
Place of birth - Native, outside of US (%) - Other Race
Place of birth - Foreign born (%)
Place of birth - Foreign born (%) - White
Place of birth - Foreign born (%) - Black or African American
Place of birth - Foreign born (%) - Asian
Place of birth - Foreign born (%) - Hispanic or Latino
Place of birth - Foreign born (%) - American Indian and Alaska Native
Place of birth - Foreign born (%) - Multirace
Place of birth - Foreign born (%) - Other Race
Residents speaking English at home (%)
Residents speaking English at home - Born in the United States (%)
Residents speaking English at home - Native, born elsewhere (%)
Residents speaking English at home - Foreign born (%)
Residents speaking Spanish at home (%)
Residents speaking Spanish at home - Born in the United States (%)
Residents speaking Spanish at home - Native, born elsewhere (%)
Residents speaking Spanish at home - Foreign born (%)
Residents speaking other language at home (%)
Residents speaking other language at home - Born in the United States (%)
Residents speaking other language at home - Native, born elsewhere (%)
Residents speaking other language at home - Foreign born (%)
Marital status - Never married (%)
Marital status - Now married (%)
Marital status - Separated (%)
Marital status - Widowed (%)
Marital status - Divorced (%)
Ancestries Reported - Arab (%)
Ancestries Reported - Czech (%)
Ancestries Reported - Danish (%)
Ancestries Reported - Dutch (%)
Ancestries Reported - English (%)
Ancestries Reported - French (%)
Ancestries Reported - French Canadian (%)
Ancestries Reported - German (%)
Ancestries Reported - Greek (%)
Ancestries Reported - Hungarian (%)
Ancestries Reported - Irish (%)
Ancestries Reported - Italian (%)
Ancestries Reported - Lithuanian (%)
Ancestries Reported - Norwegian (%)
Ancestries Reported - Polish (%)
Ancestries Reported - Portuguese (%)
Ancestries Reported - Russian (%)
Ancestries Reported - Scotch-Irish (%)
Ancestries Reported - Scottish (%)
Ancestries Reported - Slovak (%)
Ancestries Reported - Subsaharan African (%)
Ancestries Reported - Swedish (%)
Ancestries Reported - Swiss (%)
Ancestries Reported - Ukrainian (%)
Ancestries Reported - United States (%)
Ancestries Reported - Welsh (%)
Ancestries Reported - West Indian (%)
Ancestries Reported - Other (%)
Geographical mobility - Same house 1 year ago (%)
Geographical mobility - Same house 1 year ago (%) - White
Geographical mobility - Same house 1 year ago (%) - Black or African American
Geographical mobility - Same house 1 year ago (%) - Asian
Geographical mobility - Same house 1 year ago (%) - Hispanic or Latino
Geographical mobility - Same house 1 year ago (%) - American Indian and Alaska Native
Geographical mobility - Same house 1 year ago (%) - Multirace
Geographical mobility - Same house 1 year ago (%) - Other Race
Geographical mobility - Moved within same county (%)
Geographical mobility - Moved within same county (%) - White
Geographical mobility - Moved within same county (%) - Black or African American
Geographical mobility - Moved within same county (%) - Asian
Geographical mobility - Moved within same county (%) - Hispanic or Latino
Geographical mobility - Moved within same county (%) - American Indian and Alaska Native
Geographical mobility - Moved within same county (%) - Multirace
Geographical mobility - Moved within same county (%) - Other Race
Geographical mobility - Moved from different county within same state (%)
Geographical mobility - Moved from different county within same state (%) - White
Geographical mobility - Moved from different county within same state (%) - Black or African American
Geographical mobility - Moved from different county within same state (%) - Asian
Geographical mobility - Moved from different county within same state (%) - Hispanic or Latino
Geographical mobility - Moved from different county within same state (%) - American Indian and Alaska Native
Geographical mobility - Moved from different county within same state (%) - Multirace
Geographical mobility - Moved from different county within same state (%) - Other Race
Geographical mobility - Moved from different state (%)
Geographical mobility - Moved from different state (%) - White
Geographical mobility - Moved from different state (%) - Black or African American
Geographical mobility - Moved from different state (%) - Asian
Geographical mobility - Moved from different state (%) - Hispanic or Latino
Geographical mobility - Moved from different state (%) - American Indian and Alaska Native
Geographical mobility - Moved from different state (%) - Multirace
Geographical mobility - Moved from different state (%) - Other Race
Geographical mobility - Moved from abroad (%)
Geographical mobility - Moved from abroad (%) - White
Geographical mobility - Moved from abroad (%) - Black or African American
Geographical mobility - Moved from abroad (%) - Asian
Geographical mobility - Moved from abroad (%) - Hispanic or Latino
Geographical mobility - Moved from abroad (%) - American Indian and Alaska Native
Geographical mobility - Moved from abroad (%) - Multirace
Geographical mobility - Moved from abroad (%) - Other Race
Place of birth for the foreign-born population - Ireland (%)
Place of birth for the foreign-born population - Denmark (%)
Place of birth for the foreign-born population - Norway (%)
Place of birth for the foreign-born population - Sweden (%)
Place of birth for the foreign-born population - United Kingdom (%)
Place of birth for the foreign-born population - England (%)
Place of birth for the foreign-born population - Scotland (%)
Place of birth for the foreign-born population - Other Northern Europe (%)
Place of birth for the foreign-born population - Austria (%)
Place of birth for the foreign-born population - Belgium (%)
Place of birth for the foreign-born population - France (%)
Place of birth for the foreign-born population - Germany (%)
Place of birth for the foreign-born population - Netherlands (%)
Place of birth for the foreign-born population - Switzerland (%)
Place of birth for the foreign-born population - Other Western Europe (%)
Place of birth for the foreign-born population - Greece (%)
Place of birth for the foreign-born population - Italy (%)
Place of birth for the foreign-born population - Portugal (%)
Place of birth for the foreign-born population - Spain (%)
Place of birth for the foreign-born population - Other Southern Europe (%)
Place of birth for the foreign-born population - Albania (%)
Place of birth for the foreign-born population - Belarus (%)
Place of birth for the foreign-born population - Bosnia and Herzegovina (%)
Place of birth for the foreign-born population - Bulgaria (%)
Place of birth for the foreign-born population - Croatia (%)
Place of birth for the foreign-born population - Czechoslovakia (%)
Place of birth for the foreign-born population - Hungary (%)
Place of birth for the foreign-born population - Latvia (%)
Place of birth for the foreign-born population - Lithuania (%)
Place of birth for the foreign-born population - North Macedonia (Macedonia) (%)
Place of birth for the foreign-born population - Moldova (%)
Place of birth for the foreign-born population - Poland (%)
Place of birth for the foreign-born population - Romania (%)
Place of birth for the foreign-born population - Russia (%)
Place of birth for the foreign-born population - Serbia (%)
Place of birth for the foreign-born population - Ukraine (%)
Place of birth for the foreign-born population - Other Eastern Europe (%)
Place of birth for the foreign-born population - China (%)
Place of birth for the foreign-born population - Hong Kong (%)
Place of birth for the foreign-born population - Taiwan (%)
Place of birth for the foreign-born population - Japan (%)
Place of birth for the foreign-born population - Korea (%)
Place of birth for the foreign-born population - Other Eastern Asia (%)
Place of birth for the foreign-born population - Afghanistan (%)
Place of birth for the foreign-born population - Bangladesh (%)
Place of birth for the foreign-born population - India (%)
Place of birth for the foreign-born population - Iran (%)
Place of birth for the foreign-born population - Kazakhstan (%)
Place of birth for the foreign-born population - Nepal (%)
Place of birth for the foreign-born population - Pakistan (%)
Place of birth for the foreign-born population - Sri Lanka (%)
Place of birth for the foreign-born population - Uzbekistan (%)
Place of birth for the foreign-born population - Other South Central Asia (%)
Place of birth for the foreign-born population - Burma (%)
Place of birth for the foreign-born population - Cambodia (%)
Place of birth for the foreign-born population - Indonesia (%)
Place of birth for the foreign-born population - Laos (%)
Place of birth for the foreign-born population - Malaysia (%)
Place of birth for the foreign-born population - Philippines (%)
Place of birth for the foreign-born population - Singapore (%)
Place of birth for the foreign-born population - Thailand (%)
Place of birth for the foreign-born population - Vietnam (%)
Place of birth for the foreign-born population - Other South Eastern Asia (%)
Place of birth for the foreign-born population - Armenia (%)
Place of birth for the foreign-born population - Iraq (%)
Place of birth for the foreign-born population - Israel (%)
Place of birth for the foreign-born population - Jordan (%)
Place of birth for the foreign-born population - Kuwait (%)
Place of birth for the foreign-born population - Lebanon (%)
Place of birth for the foreign-born population - Saudi Arabia (%)
Place of birth for the foreign-born population - Syria (%)
Place of birth for the foreign-born population - Turkey (%)
Place of birth for the foreign-born population - Yemen (%)
Place of birth for the foreign-born population - Other Western Asia (%)
Place of birth for the foreign-born population - Eritrea (%)
Place of birth for the foreign-born population - Ethiopia (%)
Place of birth for the foreign-born population - Kenya (%)
Place of birth for the foreign-born population - Somalia (%)
Place of birth for the foreign-born population - Uganda (%)
Place of birth for the foreign-born population - Zimbabwe (%)
Place of birth for the foreign-born population - Other Eastern Africa (%)
Place of birth for the foreign-born population - Cameroon (%)
Place of birth for the foreign-born population - Congo (%)
Place of birth for the foreign-born population - Democratic Republic of Congo (Zaire) (%)
Place of birth for the foreign-born population - Other Middle Africa (%)
Place of birth for the foreign-born population - Egypt (%)
Place of birth for the foreign-born population - Morocco (%)
Place of birth for the foreign-born population - Sudan (%)
Place of birth for the foreign-born population - Other Northern Africa (%)
Place of birth for the foreign-born population - South Africa (%)
Place of birth for the foreign-born population - Other Southern Africa (%)
Place of birth for the foreign-born population - Cabo Verde (%)
Place of birth for the foreign-born population - Ghana (%)
Place of birth for the foreign-born population - Liberia (%)
Place of birth for the foreign-born population - Nigeria (%)
Place of birth for the foreign-born population - Senegal (%)
Place of birth for the foreign-born population - Sierra Leone (%)
Place of birth for the foreign-born population - Other Western Africa (%)
Place of birth for the foreign-born population - Australia (%)
Place of birth for the foreign-born population - New Zealand (%)
Place of birth for the foreign-born population - Fiji (%)
Place of birth for the foreign-born population - Micronesia (%)
Place of birth for the foreign-born population - Bahamas (%)
Place of birth for the foreign-born population - Barbados (%)
Place of birth for the foreign-born population - Cuba (%)
Place of birth for the foreign-born population - Dominica (%)
Place of birth for the foreign-born population - Dominican Republic (%)
Place of birth for the foreign-born population - Grenada (%)
Place of birth for the foreign-born population - Haiti (%)
Place of birth for the foreign-born population - Jamaica (%)
Place of birth for the foreign-born population - St. Vincent and the Grenadines (%)
Place of birth for the foreign-born population - Trinidad and Tobago (%)
Place of birth for the foreign-born population - West Indies (%)
Place of birth for the foreign-born population - Other Caribbean (%)
Place of birth for the foreign-born population - Belize (%)
Place of birth for the foreign-born population - Costa Rica (%)
Place of birth for the foreign-born population - El Salvador (%)
Place of birth for the foreign-born population - Guatemala (%)
Place of birth for the foreign-born population - Honduras (%)
Place of birth for the foreign-born population - Mexico (%)
Place of birth for the foreign-born population - Nicaragua (%)
Place of birth for the foreign-born population - Panama (%)
Place of birth for the foreign-born population - Other Central America (%)
Place of birth for the foreign-born population - Argentina (%)
Place of birth for the foreign-born population - Bolivia (%)
Place of birth for the foreign-born population - Brazil (%)
Place of birth for the foreign-born population - Chile (%)
Place of birth for the foreign-born population - Colombia (%)
Place of birth for the foreign-born population - Ecuador (%)
Place of birth for the foreign-born population - Guyana (%)
Place of birth for the foreign-born population - Peru (%)
Place of birth for the foreign-born population - Uruguay (%)
Place of birth for the foreign-born population - Venezuela (%)
Place of birth for the foreign-born population - Other South America (%)
Place of birth for the foreign-born population - Canada (%)
Place of birth for the foreign-born population - Other Northern America (%)
Place of birth for the foreign-born population - Other (%)
Latest news about races in Burlington, VT collected exclusively by city-data.com from local newspapers, TV, and radio stations
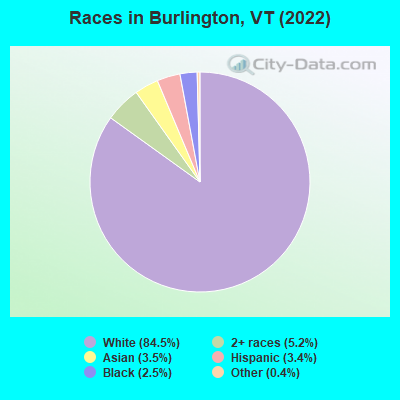
According to 2022 data, the most numerous races in Burlington, VT are White alone (37,959 residents), Two or more races (2,324 residents), and Hispanic (1,527 residents). 90.0% of Burlington residents speak English at home. 7.8% of Burlington, VT residents are foreign-born (3.0% born in Asia, 1.5% born in Europe, 1.4% born in Africa, 1.0% born in Latin America, 0.8% born in North America), which is 48.7% greater than the foreign-born rate of 4.0% across the entire state of Vermont.
Race distribution in Burlington
2000 2022
585,431 96.2% White alone 6,809 1.1% Two or more races 5,504 0.9% Hispanic 5,160 0.8% Asian alone 2,921 0.5% Black alone 2,325 0.4% American Indian alone 557 0.09% Other race alone 120 0.02% Native Hawaiian and Other
583,546 90.2% White alone 27,340 4.2% Two or more races 14,770 2.3% Hispanic 11,512 1.8% Asian alone 6,264 1.0% Black alone 2,521 0.4% Other race alone 1,052 0.2% American Indian alone 59 0.01% Native Hawaiian and Other
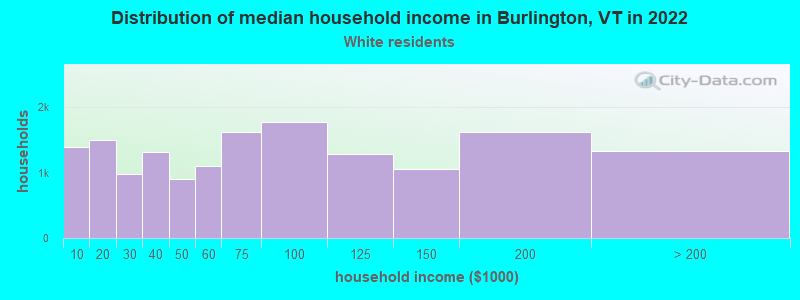
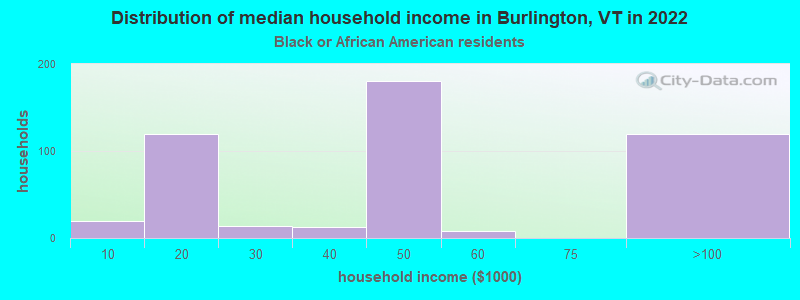
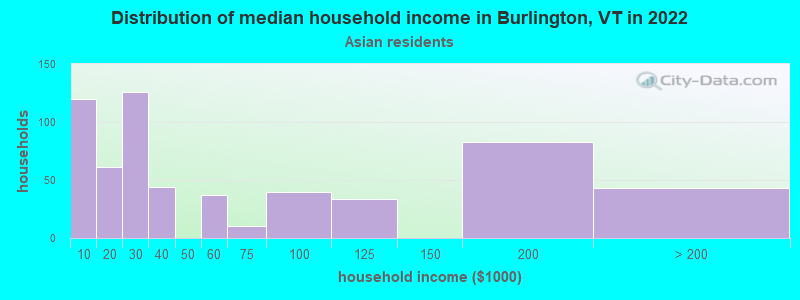
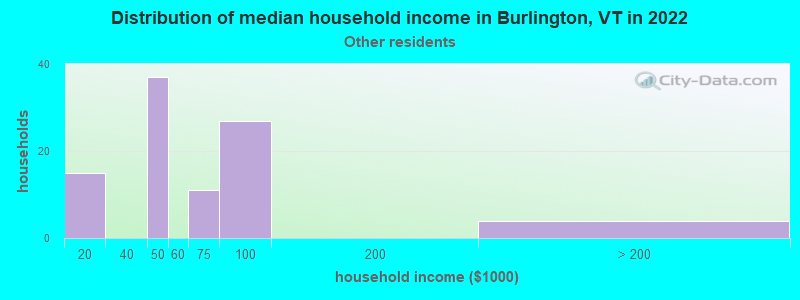
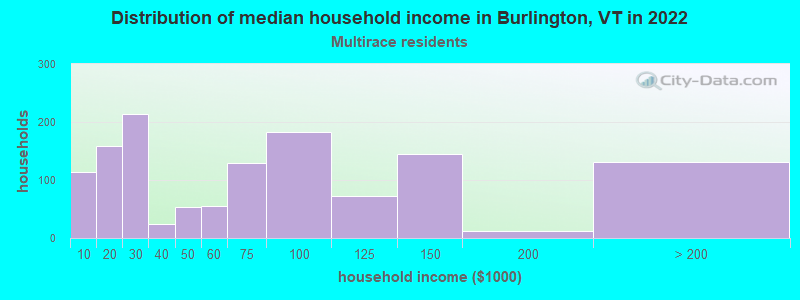
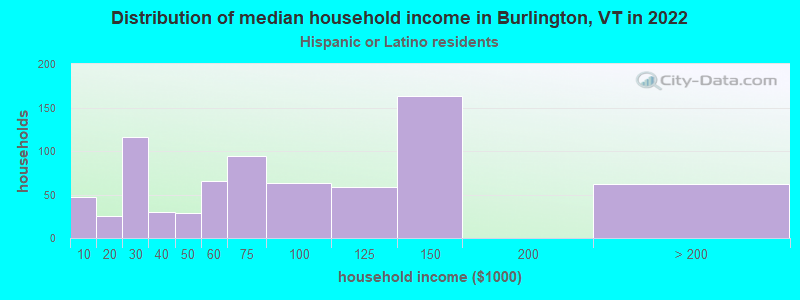
Income and house value in Burlington Median household income in 2022 $65,180 White non-Hispanic householders$35,104 Black householders$52,757 Two or more races householders$90,426 Hispanic or Latino race householdersMedian 2022 house value $440,810 White Non-Hispanic householders$377,693 Black or African American householders$327,334 American Indian or Alaska Native householders $478,075 Asian householders$251,795 Some other race householders$478,411 Two or more races householders$349,827 Hispanic or Latino householders
Median age by race in Burlington
27.8 Median age for White residents28.1 27.5 32.0 Median age for Black or African American residents28.7 25.1 24.8 Median age for American Indian / Alaska Native residents-679,050,566.9 -645,502,644.9 23.2 Median age for Asian residents24.6 23.6 -666,666,666.0 Median age for Native Hawaiian / Pacific Islander residents-668,724,279.2 -666,666,666.0 37.2 Median age for Other race residents58.8 34.7 27.1 Median age for Two or more races residents29.8 22.6 27.8 Median age for White alone residents28.3 27.5 27.9 Median age for Hispanic or Latino residents26.6 29.2
Owner/renter occupied households by race in Burlington
House owners and renters - White residents 6,675 42.7% Owner occupied8,956 57.3% Renter occupiedHouse owners and renters - Black or African American residents 86 21.4% Owner occupied314 78.6% Renter occupiedHouse owners and renters - American Indian / Alaska Native residents 14 100.0% Renter occupiedHouse owners and renters - Asian residents 192 33.0% Owner occupied390 67.0% Renter occupiedHouse owners and renters - Other race residents 44 33.7% Owner occupied87 66.3% Renter occupiedHouse owners and renters - Two or more races residents 475 40.7% Owner occupied693 59.3% Renter occupiedHouse owners and renters - White alone residents 6,631 43.0% Owner occupied8,783 57.0% Renter occupiedHouse owners and renters - Hispanic or Latino residents 148 27.5% Owner occupied388 72.5% Renter occupied
Language usage in Burlington
English speakers - Total 90.0% of residents of Burlington speak English at home.
1.8% of residents speak Spanish at home 641 81.9% Speak English very well142 18.1% Speak English less than very well8.1% of residents speak other language at home 2,396 68.4% Speak English very well1,109 31.6% Speak English less than very well
English speakers - Born in the United States 93.4% of residents of Burlington speak English at home.
1.5% of residents speak Spanish at home 313 73.1% Speak English very well115 26.9% Speak English less than very well5.4% of residents speak other language at home 1,376 89.9% Speak English very well154 10.1% Speak English less than very well
English speakers - Native, born elsewhere 70.3% of residents of Burlington speak English at home.
6.8% of residents speak Spanish at home 17 94.4% Speak English very well1 5.6% Speak English less than very well19.8% of residents speak other language at home 52 100.0% Speak English very well
English speakers - Foreign-born 35.3% of residents of Burlington speak English at home.
6.5% of residents speak Spanish at home 183 87.1% Speak English very well27 12.9% Speak English less than very well57.0% of residents speak other language at home 871 47.6% Speak English very well959 52.4% Speak English less than very well
White (Caucasian) - Speak only English Native:
96.2% (34,924)Foreign-born:
49.4% (625)
White (Caucasian) - Speak another language Native:
4.0% (1,460)Foreign-born:
50.3% (637)
Black or African American - Speak only English Native:
78.9% (385)Foreign-born:
9.0% (46)
Black or African American - Speak another language Native:
22.4% (109)Foreign-born:
88.0% (445)
Asian - Speak only English Native:
53.4% (208)Foreign-born:
27.7% (305)
Asian - Speak another language Native:
47.3% (184)Foreign-born:
72.6% (800)
Other race - Speak only English Native:
65.3% (150)Foreign-born:
94.5% (56)
Other race - Speak another language Native:
25.2% (58)Foreign-born:
32.0% (19)
Two or more races - Speak only English Native:
78.1% (1,997)Foreign-born:
29.8% (62)
Two or more races - Speak another language Native:
24.9% (638)Foreign-born:
68.6% (142)
White alone - Speak only English Native:
96.3% (34,472)Foreign-born:
49.2% (607)
White alone - Speak another language Native:
3.9% (1,392)Foreign-born:
50.6% (623)
Hispanic or Latino - Speak only English Native:
70.1% (827)Foreign-born:
13.7% (36)
Hispanic or Latino - Speak another language Native:
29.8% (351)Foreign-born:
82.4% (216)
Foreign-born residents in Burlington 3,502 residents are foreign born (3.0% Asia , 1.5% Europe , 1.4% Africa , 1.0% Latin America , 0.8% North America ).
This city:
7.8%Vermont:
4.4%
Marital status for residents in Burlington Marital status - White (Caucasian) population 15 years and over
Males 63.5% Never married27.4% Now married0.9% Separated0.6% Widowed7.6% DivorcedFemales 61.6% Never married23.7% Now married0.6% Separated5.3% Widowed8.8% DivorcedWomen who gave birth in the past 12 months Now married:
86.5% (217)Unmarried:
13.5% (34)
Women who did not give birth in the past 12 months Now married:
14.9% (2,010)Unmarried:
85.1% (11,502)
Marital status - Black or African American population 15 years and over
Males 77.0% Never married15.0% Now married0.0% Separated1.1% Widowed6.9% DivorcedFemales 77.6% Never married14.5% Now married1.3% Separated1.9% Widowed4.7% DivorcedWomen who gave birth in the past 12 months Now married:
10.5% (13)Unmarried:
89.5% (110)
Women who did not give birth in the past 12 months Now married:
11.0% (58)Unmarried:
89.0% (473)
Marital status - American Indian / Alaska Native population 15 years and over
Males 100.0% Never married0.0% Now married0.0% Separated0.0% Widowed0.0% DivorcedFemales 100.0% Never married0.0% Now married0.0% Separated0.0% Widowed0.0% DivorcedMarital status - Asian population 15 years and over
Males 71.8% Never married25.8% Now married0.0% Separated0.2% Widowed2.2% DivorcedFemales 72.4% Never married23.4% Now married0.1% Separated1.7% Widowed2.3% DivorcedWomen who gave birth in the past 12 months Now married:
100.0% (7)Unmarried:
0.0% (0)
Women who did not give birth in the past 12 months Now married:
11.5% (50)Unmarried:
88.5% (388)
Marital status - Other race population 15 years and over
Males 18.5% Never married5.6% Now married0.0% Separated0.0% Widowed75.9% DivorcedFemales 76.9% Never married16.2% Now married0.0% Separated0.0% Widowed6.9% DivorcedWomen who gave birth in the past 12 months Now married:
0.0% (0)Unmarried:
100.0% (6)
Women who did not give birth in the past 12 months Now married:
16.1% (28)Unmarried:
83.9% (148)
Marital status - Two or more races population 15 years and over
Males 72.5% Never married12.6% Now married0.0% Separated0.0% Widowed14.9% DivorcedFemales 76.8% Never married7.4% Now married0.0% Separated3.9% Widowed12.0% DivorcedWomen who gave birth in the past 12 months Now married:
0.0% (0)Unmarried:
100.0% (7)
Women who did not give birth in the past 12 months Now married:
4.1% (44)Unmarried:
95.9% (1,030)
Marital status - White alone, not Hispanic / Latino population 15 years and over
Males 63.4% Never married27.3% Now married0.9% Separated0.7% Widowed7.7% DivorcedFemales 61.5% Never married23.7% Now married0.6% Separated5.3% Widowed8.9% DivorcedWomen who gave birth in the past 12 months Now married:
86.5% (217)Unmarried:
13.5% (34)
Women who did not give birth in the past 12 months Now married:
14.7% (1,940)Unmarried:
85.3% (11,293)
Marital status - Hispanic or Latino population 15 years and over
Males 61.0% Never married19.1% Now married0.0% Separated0.0% Widowed19.9% DivorcedFemales 67.2% Never married22.1% Now married0.0% Separated2.4% Widowed8.4% DivorcedWomen who gave birth in the past 12 months Now married:
0.0% (0)Unmarried:
100.0% (5)
Women who did not give birth in the past 12 months Now married:
18.1% (97)Unmarried:
81.9% (438)
Ancestries in Burlington
1,962 12.9% Irish1,810 11.9% English1,058 7.0% American1,028 6.8% French Canadian845 5.6% Italian775 5.1% German622 4.1% French580 3.8% European405 2.7% Scottish329 2.2% Polish297 2.0% Somali224 1.5% Yugoslavian173 1.1% Eastern European131 0.9% British127 0.8% Scandinavian115 0.8% Dutch113 0.7% Canadian103 0.7% Scotch-Irish102 0.7% Armenian86 0.6% Northern European81 0.5% Greek79 0.5% Russian79 0.5% Ukrainian70 0.5% Jamaican69 0.5% Swedish55 0.4% Portuguese51 0.3% Norwegian45 0.3% Hungarian45 0.3% Arab45 0.3% Haitian44 0.3% Nigerian44 0.3% Welsh42 0.3% Albanian37 0.2% Iranian37 0.2% Lebanese31 0.2% Turkish28 0.2% Czech27 0.2% Ghanaian23 0.2% South African22 0.1% Serbian21 0.1% Slovak18 0.1% Sudanese18 0.1% British West Indian17 0.1% Cajun13 0.09% Romanian12 0.08% Lithuanian9 0.06% Barbadian7 0.05% Czechoslovakian5 0.03% Croatian5 0.03% Palestinian5 0.03% Iraqi5 0.03% Finnish5 0.03% Austrian4 0.03% Celtic4 0.03% New Zealander4 0.03% Danish1 0.01% Slovene1 0.01% Swiss
Geographical mobility in Burlington Same house 1 year ago 25,196 65.8% White (Caucasian)727 64.5% Black or African American27 100.0% American Indian / Alaska Native846 57.7% Asian213 74.4% Other race2,360 73.2% Two or more races24,873 66.0% White alone, not Hispanic / Latino1,154 77.5% Hispanic or LatinoMoved within same county 6,011 15.7% White / Caucasian121 10.8% Black or African American197 13.4% Asian11 3.8% Other race490 15.2% Two or more races5,921 15.7% White alone, not Hispanic / Latino87 5.8% Hispanic or LatinoMoved within same state 916 2.4% White / Caucasian176 15.6% Black or African American54 3.7% Asian14 4.8% Other race9 0.3% Two or more races929 2.5% White alone, not Hispanic / Latino5 0.3% Hispanic or LatinoMoved from different state 5,774 15.1% White / Caucasian42 3.7% Black or African American334 22.8% Asian43 15.2% Other race194 6.0% Two or more races5,594 14.8% White alone, not Hispanic / Latino180 12.1% Hispanic or LatinoMoved from abroad 377 1.0% White14 1.2% Black or African American90 6.1% Asian11 0.3% Two or more races358 0.9% White alone, not Hispanic / Latino28 1.9% Hispanic or Latino
Children Nativity (place of birth) in Burlington
Children under 6 years - Living with two parents Both parents native 905 100.0% NativeBoth parents foreign-born 147 93.8% Native10 6.2% Foreign-bornOne native, one foreign-born parent 116 100.0% NativeChildren under 6 years - Living with one parent Native parent 464 100.0% NativeForeign-born parent 122 96.8% Native4 3.2% Foreign-bornChildren 6 to 17 years - Living with two parents Both parents native 1,255 100.0% NativeBoth parents foreign-born 78 48.5% Native83 51.5% Foreign-bornOne native, one foreign-born parent 313 100.0% NativeChildren 6 to 17 years - Living with one parent Native parent 827 98.6% Native12 1.4% Foreign-bornForeign-born parent 88 53.1% Native78 46.9% Foreign-born
Grandparents responsible for own grandchildren in Burlington
Grandparents (30 to 59 years) Black or African American 10 100.0% Not responsible for grandchildrenGrandparents (60 years and over) Black or African American 23 77.4% Responsible for grandchildren7 22.6% Not responsible for grandchildren