Races in Edgewater, New Jersey (NJ) Detailed Stats
Data:
Races - White alone (%)
Races - White alone (% change since 2000)
Races - Black alone (%)
Races - Black alone (% change since 2000)
Races - American Indian alone (%)
Races - American Indian alone (% change since 2000)
Races - Asian alone (%)
Races - Asian alone (% change since 2000)
Races - Hispanic (%)
Races - Hispanic (% change since 2000)
Races - Native Hawaiian and Other Pacific Islander alone (%)
Races - Native Hawaiian and Other Pacific Islander alone (% change since 2000)
Races - Two or more races(%)
Races - Two or more races(% change since 2000)
Races - Other race alone (%)
Races - Other race alone (% change since 2000)
Racial diversity
Place of birth - Born in state of residence (%)
Place of birth - Born in state of residence (%) - White
Place of birth - Born in state of residence (%) - Black or African American
Place of birth - Born in state of residence (%) - Asian
Place of birth - Born in state of residence (%) - Hispanic or Latino
Place of birth - Born in state of residence (%) - American Indian and Alaska Native
Place of birth - Born in state of residence (%) - Multirace
Place of birth - Born in state of residence (%) - Other Race
Place of birth - Born in other state (%)
Place of birth - Born in other state (%) - White
Place of birth - Born in other state (%) - Black or African American
Place of birth - Born in other state (%) - Asian
Place of birth - Born in other state (%) - Hispanic or Latino
Place of birth - Born in other state (%) - American Indian and Alaska Native
Place of birth - Born in other state (%) - Multirace
Place of birth - Born in other state (%) - Other Race
Place of birth - Native, outside of US (%)
Place of birth - Native, outside of US (%) - White
Place of birth - Native, outside of US (%) - Black or African American
Place of birth - Native, outside of US (%) - Asian
Place of birth - Native, outside of US (%) - Hispanic or Latino
Place of birth - Native, outside of US (%) - American Indian and Alaska Native
Place of birth - Native, outside of US (%) - Multirace
Place of birth - Native, outside of US (%) - Other Race
Place of birth - Foreign born (%)
Place of birth - Foreign born (%) - White
Place of birth - Foreign born (%) - Black or African American
Place of birth - Foreign born (%) - Asian
Place of birth - Foreign born (%) - Hispanic or Latino
Place of birth - Foreign born (%) - American Indian and Alaska Native
Place of birth - Foreign born (%) - Multirace
Place of birth - Foreign born (%) - Other Race
Residents speaking English at home (%)
Residents speaking English at home - Born in the United States (%)
Residents speaking English at home - Native, born elsewhere (%)
Residents speaking English at home - Foreign born (%)
Residents speaking Spanish at home (%)
Residents speaking Spanish at home - Born in the United States (%)
Residents speaking Spanish at home - Native, born elsewhere (%)
Residents speaking Spanish at home - Foreign born (%)
Residents speaking other language at home (%)
Residents speaking other language at home - Born in the United States (%)
Residents speaking other language at home - Native, born elsewhere (%)
Residents speaking other language at home - Foreign born (%)
Marital status - Never married (%)
Marital status - Now married (%)
Marital status - Separated (%)
Marital status - Widowed (%)
Marital status - Divorced (%)
Ancestries Reported - Arab (%)
Ancestries Reported - Czech (%)
Ancestries Reported - Danish (%)
Ancestries Reported - Dutch (%)
Ancestries Reported - English (%)
Ancestries Reported - French (%)
Ancestries Reported - French Canadian (%)
Ancestries Reported - German (%)
Ancestries Reported - Greek (%)
Ancestries Reported - Hungarian (%)
Ancestries Reported - Irish (%)
Ancestries Reported - Italian (%)
Ancestries Reported - Lithuanian (%)
Ancestries Reported - Norwegian (%)
Ancestries Reported - Polish (%)
Ancestries Reported - Portuguese (%)
Ancestries Reported - Russian (%)
Ancestries Reported - Scotch-Irish (%)
Ancestries Reported - Scottish (%)
Ancestries Reported - Slovak (%)
Ancestries Reported - Subsaharan African (%)
Ancestries Reported - Swedish (%)
Ancestries Reported - Swiss (%)
Ancestries Reported - Ukrainian (%)
Ancestries Reported - United States (%)
Ancestries Reported - Welsh (%)
Ancestries Reported - West Indian (%)
Ancestries Reported - Other (%)
Geographical mobility - Same house 1 year ago (%)
Geographical mobility - Same house 1 year ago (%) - White
Geographical mobility - Same house 1 year ago (%) - Black or African American
Geographical mobility - Same house 1 year ago (%) - Asian
Geographical mobility - Same house 1 year ago (%) - Hispanic or Latino
Geographical mobility - Same house 1 year ago (%) - American Indian and Alaska Native
Geographical mobility - Same house 1 year ago (%) - Multirace
Geographical mobility - Same house 1 year ago (%) - Other Race
Geographical mobility - Moved within same county (%)
Geographical mobility - Moved within same county (%) - White
Geographical mobility - Moved within same county (%) - Black or African American
Geographical mobility - Moved within same county (%) - Asian
Geographical mobility - Moved within same county (%) - Hispanic or Latino
Geographical mobility - Moved within same county (%) - American Indian and Alaska Native
Geographical mobility - Moved within same county (%) - Multirace
Geographical mobility - Moved within same county (%) - Other Race
Geographical mobility - Moved from different county within same state (%)
Geographical mobility - Moved from different county within same state (%) - White
Geographical mobility - Moved from different county within same state (%) - Black or African American
Geographical mobility - Moved from different county within same state (%) - Asian
Geographical mobility - Moved from different county within same state (%) - Hispanic or Latino
Geographical mobility - Moved from different county within same state (%) - American Indian and Alaska Native
Geographical mobility - Moved from different county within same state (%) - Multirace
Geographical mobility - Moved from different county within same state (%) - Other Race
Geographical mobility - Moved from different state (%)
Geographical mobility - Moved from different state (%) - White
Geographical mobility - Moved from different state (%) - Black or African American
Geographical mobility - Moved from different state (%) - Asian
Geographical mobility - Moved from different state (%) - Hispanic or Latino
Geographical mobility - Moved from different state (%) - American Indian and Alaska Native
Geographical mobility - Moved from different state (%) - Multirace
Geographical mobility - Moved from different state (%) - Other Race
Geographical mobility - Moved from abroad (%)
Geographical mobility - Moved from abroad (%) - White
Geographical mobility - Moved from abroad (%) - Black or African American
Geographical mobility - Moved from abroad (%) - Asian
Geographical mobility - Moved from abroad (%) - Hispanic or Latino
Geographical mobility - Moved from abroad (%) - American Indian and Alaska Native
Geographical mobility - Moved from abroad (%) - Multirace
Geographical mobility - Moved from abroad (%) - Other Race
Place of birth for the foreign-born population - Ireland (%)
Place of birth for the foreign-born population - Denmark (%)
Place of birth for the foreign-born population - Norway (%)
Place of birth for the foreign-born population - Sweden (%)
Place of birth for the foreign-born population - United Kingdom (%)
Place of birth for the foreign-born population - England (%)
Place of birth for the foreign-born population - Scotland (%)
Place of birth for the foreign-born population - Other Northern Europe (%)
Place of birth for the foreign-born population - Austria (%)
Place of birth for the foreign-born population - Belgium (%)
Place of birth for the foreign-born population - France (%)
Place of birth for the foreign-born population - Germany (%)
Place of birth for the foreign-born population - Netherlands (%)
Place of birth for the foreign-born population - Switzerland (%)
Place of birth for the foreign-born population - Other Western Europe (%)
Place of birth for the foreign-born population - Greece (%)
Place of birth for the foreign-born population - Italy (%)
Place of birth for the foreign-born population - Portugal (%)
Place of birth for the foreign-born population - Spain (%)
Place of birth for the foreign-born population - Other Southern Europe (%)
Place of birth for the foreign-born population - Albania (%)
Place of birth for the foreign-born population - Belarus (%)
Place of birth for the foreign-born population - Bosnia and Herzegovina (%)
Place of birth for the foreign-born population - Bulgaria (%)
Place of birth for the foreign-born population - Croatia (%)
Place of birth for the foreign-born population - Czechoslovakia (%)
Place of birth for the foreign-born population - Hungary (%)
Place of birth for the foreign-born population - Latvia (%)
Place of birth for the foreign-born population - Lithuania (%)
Place of birth for the foreign-born population - North Macedonia (Macedonia) (%)
Place of birth for the foreign-born population - Moldova (%)
Place of birth for the foreign-born population - Poland (%)
Place of birth for the foreign-born population - Romania (%)
Place of birth for the foreign-born population - Russia (%)
Place of birth for the foreign-born population - Serbia (%)
Place of birth for the foreign-born population - Ukraine (%)
Place of birth for the foreign-born population - Other Eastern Europe (%)
Place of birth for the foreign-born population - China (%)
Place of birth for the foreign-born population - Hong Kong (%)
Place of birth for the foreign-born population - Taiwan (%)
Place of birth for the foreign-born population - Japan (%)
Place of birth for the foreign-born population - Korea (%)
Place of birth for the foreign-born population - Other Eastern Asia (%)
Place of birth for the foreign-born population - Afghanistan (%)
Place of birth for the foreign-born population - Bangladesh (%)
Place of birth for the foreign-born population - India (%)
Place of birth for the foreign-born population - Iran (%)
Place of birth for the foreign-born population - Kazakhstan (%)
Place of birth for the foreign-born population - Nepal (%)
Place of birth for the foreign-born population - Pakistan (%)
Place of birth for the foreign-born population - Sri Lanka (%)
Place of birth for the foreign-born population - Uzbekistan (%)
Place of birth for the foreign-born population - Other South Central Asia (%)
Place of birth for the foreign-born population - Burma (%)
Place of birth for the foreign-born population - Cambodia (%)
Place of birth for the foreign-born population - Indonesia (%)
Place of birth for the foreign-born population - Laos (%)
Place of birth for the foreign-born population - Malaysia (%)
Place of birth for the foreign-born population - Philippines (%)
Place of birth for the foreign-born population - Singapore (%)
Place of birth for the foreign-born population - Thailand (%)
Place of birth for the foreign-born population - Vietnam (%)
Place of birth for the foreign-born population - Other South Eastern Asia (%)
Place of birth for the foreign-born population - Armenia (%)
Place of birth for the foreign-born population - Iraq (%)
Place of birth for the foreign-born population - Israel (%)
Place of birth for the foreign-born population - Jordan (%)
Place of birth for the foreign-born population - Kuwait (%)
Place of birth for the foreign-born population - Lebanon (%)
Place of birth for the foreign-born population - Saudi Arabia (%)
Place of birth for the foreign-born population - Syria (%)
Place of birth for the foreign-born population - Turkey (%)
Place of birth for the foreign-born population - Yemen (%)
Place of birth for the foreign-born population - Other Western Asia (%)
Place of birth for the foreign-born population - Eritrea (%)
Place of birth for the foreign-born population - Ethiopia (%)
Place of birth for the foreign-born population - Kenya (%)
Place of birth for the foreign-born population - Somalia (%)
Place of birth for the foreign-born population - Uganda (%)
Place of birth for the foreign-born population - Zimbabwe (%)
Place of birth for the foreign-born population - Other Eastern Africa (%)
Place of birth for the foreign-born population - Cameroon (%)
Place of birth for the foreign-born population - Congo (%)
Place of birth for the foreign-born population - Democratic Republic of Congo (Zaire) (%)
Place of birth for the foreign-born population - Other Middle Africa (%)
Place of birth for the foreign-born population - Egypt (%)
Place of birth for the foreign-born population - Morocco (%)
Place of birth for the foreign-born population - Sudan (%)
Place of birth for the foreign-born population - Other Northern Africa (%)
Place of birth for the foreign-born population - South Africa (%)
Place of birth for the foreign-born population - Other Southern Africa (%)
Place of birth for the foreign-born population - Cabo Verde (%)
Place of birth for the foreign-born population - Ghana (%)
Place of birth for the foreign-born population - Liberia (%)
Place of birth for the foreign-born population - Nigeria (%)
Place of birth for the foreign-born population - Senegal (%)
Place of birth for the foreign-born population - Sierra Leone (%)
Place of birth for the foreign-born population - Other Western Africa (%)
Place of birth for the foreign-born population - Australia (%)
Place of birth for the foreign-born population - New Zealand (%)
Place of birth for the foreign-born population - Fiji (%)
Place of birth for the foreign-born population - Micronesia (%)
Place of birth for the foreign-born population - Bahamas (%)
Place of birth for the foreign-born population - Barbados (%)
Place of birth for the foreign-born population - Cuba (%)
Place of birth for the foreign-born population - Dominica (%)
Place of birth for the foreign-born population - Dominican Republic (%)
Place of birth for the foreign-born population - Grenada (%)
Place of birth for the foreign-born population - Haiti (%)
Place of birth for the foreign-born population - Jamaica (%)
Place of birth for the foreign-born population - St. Vincent and the Grenadines (%)
Place of birth for the foreign-born population - Trinidad and Tobago (%)
Place of birth for the foreign-born population - West Indies (%)
Place of birth for the foreign-born population - Other Caribbean (%)
Place of birth for the foreign-born population - Belize (%)
Place of birth for the foreign-born population - Costa Rica (%)
Place of birth for the foreign-born population - El Salvador (%)
Place of birth for the foreign-born population - Guatemala (%)
Place of birth for the foreign-born population - Honduras (%)
Place of birth for the foreign-born population - Mexico (%)
Place of birth for the foreign-born population - Nicaragua (%)
Place of birth for the foreign-born population - Panama (%)
Place of birth for the foreign-born population - Other Central America (%)
Place of birth for the foreign-born population - Argentina (%)
Place of birth for the foreign-born population - Bolivia (%)
Place of birth for the foreign-born population - Brazil (%)
Place of birth for the foreign-born population - Chile (%)
Place of birth for the foreign-born population - Colombia (%)
Place of birth for the foreign-born population - Ecuador (%)
Place of birth for the foreign-born population - Guyana (%)
Place of birth for the foreign-born population - Peru (%)
Place of birth for the foreign-born population - Uruguay (%)
Place of birth for the foreign-born population - Venezuela (%)
Place of birth for the foreign-born population - Other South America (%)
Place of birth for the foreign-born population - Canada (%)
Place of birth for the foreign-born population - Other Northern America (%)
Place of birth for the foreign-born population - Other (%)
Latest news about races in Edgewater, NJ collected exclusively by city-data.com from local newspapers, TV, and radio stations
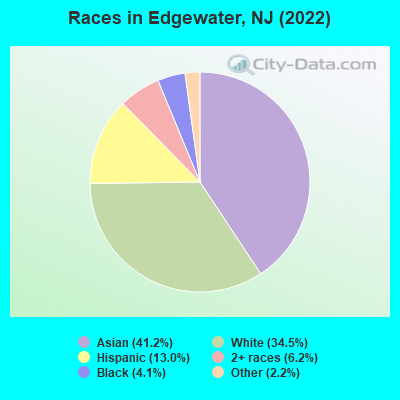
According to 2022 data, the most numerous races in Edgewater, NJ are White alone (4,971 residents), Hispanic (1,865 residents), and Black alone (588 residents). 44.9% of Edgewater residents speak English at home. 52.5% of Edgewater, NJ residents are foreign-born (33.5% born in Asia, 8.5% born in Europe, 5.3% born in Latin America), which is 56.2% greater than the foreign-born rate of 23.0% across the entire state of New Jersey.
Race distribution in Edgewater
2000 2022
5,557,209 66.0% White alone 1,117,191 13.3% Hispanic 1,096,171 13.0% Black alone 477,012 5.7% Asian alone 133,689 1.6% Two or more races 19,565 0.2% Other race alone 11,338 0.1% American Indian alone 2,175 0.03% Native Hawaiian and Other
4,766,476 51.5% White alone 2,028,470 21.9% Hispanic 1,111,632 12.0% Black alone 923,546 10.0% Asian alone 332,237 3.6% Two or more races 89,847 1.0% Other race alone 8,557 0.09% American Indian alone 934 0.01% Native Hawaiian and Other
Income and house value in Edgewater Median household income in 2022 $154,871 White non-Hispanic householders$134,437 Asian householders$41,777 Hispanic or Latino race householdersMedian 2022 house value over $1,000,000 White Non-Hispanic householders$987,999 Black or African American householders over $1,000,000 Asian householders$732,791 Some other race householders$879,350 Two or more races householders$728,102 Hispanic or Latino householders
Median age by race in Edgewater
53.9 Median age for White residents46.9 56.8 38.2 Median age for Black or African American residents48.0 36.9 -766,197,182.3 Median age for American Indian / Alaska Native residents-686,322,685.6 -753,722,794.2 36.3 Median age for Asian residents37.1 35.8 -510,460,250.5 Median age for Native Hawaiian / Pacific Islander residents-514,767,932.0 -713,070,378.3 11.1 Median age for Other race residents6.9 38.8 31.6 Median age for Two or more races residents24.3 32.6 52.2 Median age for White alone residents46.0 54.8 39.2 Median age for Hispanic or Latino residents29.9 41.1
Owner/renter occupied households by race in Edgewater
House owners and renters - White residents 1,439 47.3% Owner occupied1,602 52.7% Renter occupiedHouse owners and renters - Black or African American residents 51 19.0% Owner occupied217 81.0% Renter occupiedHouse owners and renters - Asian residents 1,304 48.0% Owner occupied1,412 52.0% Renter occupiedHouse owners and renters - Other race residents 65 50.8% Owner occupied63 49.2% Renter occupiedHouse owners and renters - Two or more races residents 95 11.7% Owner occupied718 88.3% Renter occupiedHouse owners and renters - White alone residents 1,377 44.8% Owner occupied1,696 55.2% Renter occupiedHouse owners and renters - Hispanic or Latino residents 224 29.8% Owner occupied527 70.2% Renter occupied
Language usage in Edgewater
English speakers - Total 44.9% of residents of Edgewater speak English at home.
10.6% of residents speak Spanish at home 1,062 73.7% Speak English very well379 26.3% Speak English less than very well44.2% of residents speak other language at home 3,874 64.5% Speak English very well2,128 35.5% Speak English less than very well
English speakers - Born in the United States 76.0% of residents of Edgewater speak English at home.
12.8% of residents speak Spanish at home 371 81.0% Speak English very well87 19.0% Speak English less than very well11.9% of residents speak other language at home 416 97.9% Speak English very well9 2.1% Speak English less than very well
English speakers - Native, born elsewhere 45.7% of residents of Edgewater speak English at home.
33.1% of residents speak Spanish at home 113 100.0% Speak English very well16.7% of residents speak other language at home 38 66.7% Speak English very well19 33.3% Speak English less than very well
English speakers - Foreign-born 21.8% of residents of Edgewater speak English at home.
6.0% of residents speak Spanish at home 140 31.1% Speak English very well310 68.9% Speak English less than very well70.9% of residents speak other language at home 3,293 62.1% Speak English very well2,009 37.9% Speak English less than very well
White (Caucasian) - Speak only English Native:
91.3% (3,069)Foreign-born:
53.3% (772)
White (Caucasian) - Speak another language Native:
9.0% (303)Foreign-born:
54.1% (784)
Black or African American - Speak only English Native:
68.0% (121)Foreign-born:
26.7% (108)
Black or African American - Speak another language Native:
32.3% (58)Foreign-born:
65.0% (262)
Asian - Speak only English Native:
57.8% (652)Foreign-born:
11.0% (487)
Asian - Speak another language Native:
42.7% (481)Foreign-born:
89.0% (3,939)
Other race - Speak another language Native:
59.8% (268)Foreign-born:
100.0% (104)
Two or more races - Speak only English Native:
41.0% (527)Foreign-born:
44.3% (298)
Two or more races - Speak another language Native:
61.2% (785)Foreign-born:
50.3% (338)
White alone - Speak only English Native:
93.0% (2,888)Foreign-born:
42.3% (735)
White alone - Speak another language Native:
7.1% (219)Foreign-born:
57.0% (989)
Hispanic or Latino - Speak only English Native:
32.5% (391)Foreign-born:
25.3% (149)
Hispanic or Latino - Speak another language Native:
68.8% (827)Foreign-born:
77.3% (455)
Foreign-born residents in Edgewater 7,556 residents are foreign born (33.5% Asia , 8.5% Europe , 5.3% Latin America ).
This city:
52.5%New Jersey:
23.2%
Marital status for residents in Edgewater Marital status - White (Caucasian) population 15 years and over
Males 35.3% Never married50.9% Now married1.6% Separated1.5% Widowed10.7% DivorcedFemales 24.5% Never married46.1% Now married0.6% Separated6.4% Widowed22.4% DivorcedWomen who gave birth in the past 12 months Now married:
100.0% (28)Unmarried:
0.0% (0)
Women who did not give birth in the past 12 months Now married:
37.7% (299)Unmarried:
62.3% (495)
Marital status - Black or African American population 15 years and over
Males 66.9% Never married7.8% Now married0.0% Separated0.0% Widowed25.3% DivorcedFemales 86.3% Never married13.7% Now married0.0% Separated0.0% Widowed0.0% DivorcedWomen who did not give birth in the past 12 months Now married:
6.2% (20)Unmarried:
93.8% (297)
Marital status - Asian population 15 years and over
Males 28.5% Never married65.6% Now married1.3% Separated0.1% Widowed4.5% DivorcedFemales 21.8% Never married67.7% Now married0.3% Separated4.0% Widowed6.1% DivorcedWomen who gave birth in the past 12 months Now married:
100.0% (70)Unmarried:
0.0% (0)
Women who did not give birth in the past 12 months Now married:
68.0% (1,190)Unmarried:
32.0% (561)
Marital status - Other race population 15 years and over
Males 0.0% Never married100.0% Now married0.0% Separated0.0% Widowed0.0% DivorcedFemales 0.0% Never married72.1% Now married0.0% Separated0.0% Widowed27.9% DivorcedWomen who did not give birth in the past 12 months Now married:
72.1% (173)Unmarried:
27.9% (67)
Marital status - Two or more races population 15 years and over
Males 54.8% Never married39.9% Now married0.0% Separated5.3% Widowed0.0% DivorcedFemales 55.4% Never married13.1% Now married0.0% Separated2.3% Widowed29.2% DivorcedWomen who gave birth in the past 12 months Now married:
95.0% (28)Unmarried:
5.0% (1)
Women who did not give birth in the past 12 months Now married:
14.1% (90)Unmarried:
85.9% (550)
Marital status - White alone, not Hispanic / Latino population 15 years and over
Males 33.5% Never married50.8% Now married1.8% Separated1.7% Widowed12.2% DivorcedFemales 25.3% Never married47.7% Now married0.0% Separated6.3% Widowed20.7% DivorcedWomen who gave birth in the past 12 months Now married:
100.0% (10)Unmarried:
0.0% (0)
Women who did not give birth in the past 12 months Now married:
37.3% (312)Unmarried:
62.7% (526)
Marital status - Hispanic or Latino population 15 years and over
Males 60.4% Never married39.6% Now married0.0% Separated0.0% Widowed0.0% DivorcedFemales 43.8% Never married23.1% Now married1.7% Separated3.7% Widowed27.6% DivorcedWomen who gave birth in the past 12 months Now married:
95.8% (24)Unmarried:
4.2% (1)
Women who did not give birth in the past 12 months Now married:
24.7% (128)Unmarried:
75.3% (389)
Ancestries in Edgewater
522 5.4% Irish240 2.5% American235 2.4% Italian178 1.9% Polish160 1.7% English155 1.6% Ugandan136 1.4% Ethiopian104 1.1% Greek97 1.0% Haitian88 0.9% Dutch81 0.8% Brazilian80 0.8% Russian73 0.8% Welsh67 0.7% British58 0.6% German57 0.6% Hungarian53 0.6% Albanian48 0.5% South African48 0.5% Turkish40 0.4% Iranian36 0.4% Norwegian30 0.3% Eastern European30 0.3% Ukrainian29 0.3% Romanian27 0.3% Syrian26 0.3% Nigerian23 0.2% European22 0.2% Swedish20 0.2% Armenian19 0.2% Maltese14 0.1% Lebanese14 0.1% Canadian13 0.1% French11 0.1% Lithuanian11 0.1% Serbian
Geographical mobility in Edgewater Same house 1 year ago 4,182 82.5% White (Caucasian)426 57.2% Black or African American4,568 77.8% Asian625 100.0% Other race1,622 76.3% Two or more races4,032 81.5% White alone, not Hispanic / Latino1,523 81.2% Hispanic or LatinoMoved within same county 467 9.2% White / Caucasian10 1.3% Black or African American626 10.7% Asian46 2.2% Two or more races457 9.2% White alone, not Hispanic / Latino56 3.0% Hispanic or LatinoMoved within same state 110 2.2% White / Caucasian43 5.7% Black or African American176 3.0% Asian326 15.3% Two or more races129 2.6% White alone, not Hispanic / Latino254 13.5% Hispanic or LatinoMoved from different state 306 6.0% White / Caucasian180 24.1% Black or African American508 8.7% Asian157 7.4% Two or more races314 6.3% White alone, not Hispanic / Latino52 2.8% Hispanic or LatinoMoved from abroad 29 0.6% White122 16.3% Black or African American48 0.8% Asian42 0.9% White alone, not Hispanic / Latino39 2.1% Hispanic or Latino
Children Nativity (place of birth) in Edgewater
Children under 6 years - Living with two parents Both parents native 330 100.0% NativeBoth parents foreign-born 342 77.6% Native99 22.4% Foreign-bornOne native, one foreign-born parent 226 100.0% NativeChildren under 6 years - Living with one parent Foreign-born parent 17 100.0% NativeChildren 6 to 17 years - Living with two parents Both parents native 244 96.3% Native9 3.7% Foreign-bornBoth parents foreign-born 310 72.0% Native120 28.0% Foreign-bornOne native, one foreign-born parent 168 100.0% NativeChildren 6 to 17 years - Living with one parent Native parent 206 100.0% NativeForeign-born parent 121 49.5% Native124 50.5% Foreign-born