Races in Eldorado at Santa Fe, New Mexico (NM) Detailed Stats
Data:
Races - White alone (%)
Races - White alone (% change since 2000)
Races - Black alone (%)
Races - Black alone (% change since 2000)
Races - American Indian alone (%)
Races - American Indian alone (% change since 2000)
Races - Asian alone (%)
Races - Asian alone (% change since 2000)
Races - Hispanic (%)
Races - Hispanic (% change since 2000)
Races - Native Hawaiian and Other Pacific Islander alone (%)
Races - Native Hawaiian and Other Pacific Islander alone (% change since 2000)
Races - Two or more races(%)
Races - Two or more races(% change since 2000)
Races - Other race alone (%)
Races - Other race alone (% change since 2000)
Racial diversity
Place of birth - Born in state of residence (%)
Place of birth - Born in state of residence (%) - White
Place of birth - Born in state of residence (%) - Black or African American
Place of birth - Born in state of residence (%) - Asian
Place of birth - Born in state of residence (%) - Hispanic or Latino
Place of birth - Born in state of residence (%) - American Indian and Alaska Native
Place of birth - Born in state of residence (%) - Multirace
Place of birth - Born in state of residence (%) - Other Race
Place of birth - Born in other state (%)
Place of birth - Born in other state (%) - White
Place of birth - Born in other state (%) - Black or African American
Place of birth - Born in other state (%) - Asian
Place of birth - Born in other state (%) - Hispanic or Latino
Place of birth - Born in other state (%) - American Indian and Alaska Native
Place of birth - Born in other state (%) - Multirace
Place of birth - Born in other state (%) - Other Race
Place of birth - Native, outside of US (%)
Place of birth - Native, outside of US (%) - White
Place of birth - Native, outside of US (%) - Black or African American
Place of birth - Native, outside of US (%) - Asian
Place of birth - Native, outside of US (%) - Hispanic or Latino
Place of birth - Native, outside of US (%) - American Indian and Alaska Native
Place of birth - Native, outside of US (%) - Multirace
Place of birth - Native, outside of US (%) - Other Race
Place of birth - Foreign born (%)
Place of birth - Foreign born (%) - White
Place of birth - Foreign born (%) - Black or African American
Place of birth - Foreign born (%) - Asian
Place of birth - Foreign born (%) - Hispanic or Latino
Place of birth - Foreign born (%) - American Indian and Alaska Native
Place of birth - Foreign born (%) - Multirace
Place of birth - Foreign born (%) - Other Race
Residents speaking English at home (%)
Residents speaking English at home - Born in the United States (%)
Residents speaking English at home - Native, born elsewhere (%)
Residents speaking English at home - Foreign born (%)
Residents speaking Spanish at home (%)
Residents speaking Spanish at home - Born in the United States (%)
Residents speaking Spanish at home - Native, born elsewhere (%)
Residents speaking Spanish at home - Foreign born (%)
Residents speaking other language at home (%)
Residents speaking other language at home - Born in the United States (%)
Residents speaking other language at home - Native, born elsewhere (%)
Residents speaking other language at home - Foreign born (%)
Marital status - Never married (%)
Marital status - Now married (%)
Marital status - Separated (%)
Marital status - Widowed (%)
Marital status - Divorced (%)
Ancestries Reported - Arab (%)
Ancestries Reported - Czech (%)
Ancestries Reported - Danish (%)
Ancestries Reported - Dutch (%)
Ancestries Reported - English (%)
Ancestries Reported - French (%)
Ancestries Reported - French Canadian (%)
Ancestries Reported - German (%)
Ancestries Reported - Greek (%)
Ancestries Reported - Hungarian (%)
Ancestries Reported - Irish (%)
Ancestries Reported - Italian (%)
Ancestries Reported - Lithuanian (%)
Ancestries Reported - Norwegian (%)
Ancestries Reported - Polish (%)
Ancestries Reported - Portuguese (%)
Ancestries Reported - Russian (%)
Ancestries Reported - Scotch-Irish (%)
Ancestries Reported - Scottish (%)
Ancestries Reported - Slovak (%)
Ancestries Reported - Subsaharan African (%)
Ancestries Reported - Swedish (%)
Ancestries Reported - Swiss (%)
Ancestries Reported - Ukrainian (%)
Ancestries Reported - United States (%)
Ancestries Reported - Welsh (%)
Ancestries Reported - West Indian (%)
Ancestries Reported - Other (%)
Geographical mobility - Same house 1 year ago (%)
Geographical mobility - Same house 1 year ago (%) - White
Geographical mobility - Same house 1 year ago (%) - Black or African American
Geographical mobility - Same house 1 year ago (%) - Asian
Geographical mobility - Same house 1 year ago (%) - Hispanic or Latino
Geographical mobility - Same house 1 year ago (%) - American Indian and Alaska Native
Geographical mobility - Same house 1 year ago (%) - Multirace
Geographical mobility - Same house 1 year ago (%) - Other Race
Geographical mobility - Moved within same county (%)
Geographical mobility - Moved within same county (%) - White
Geographical mobility - Moved within same county (%) - Black or African American
Geographical mobility - Moved within same county (%) - Asian
Geographical mobility - Moved within same county (%) - Hispanic or Latino
Geographical mobility - Moved within same county (%) - American Indian and Alaska Native
Geographical mobility - Moved within same county (%) - Multirace
Geographical mobility - Moved within same county (%) - Other Race
Geographical mobility - Moved from different county within same state (%)
Geographical mobility - Moved from different county within same state (%) - White
Geographical mobility - Moved from different county within same state (%) - Black or African American
Geographical mobility - Moved from different county within same state (%) - Asian
Geographical mobility - Moved from different county within same state (%) - Hispanic or Latino
Geographical mobility - Moved from different county within same state (%) - American Indian and Alaska Native
Geographical mobility - Moved from different county within same state (%) - Multirace
Geographical mobility - Moved from different county within same state (%) - Other Race
Geographical mobility - Moved from different state (%)
Geographical mobility - Moved from different state (%) - White
Geographical mobility - Moved from different state (%) - Black or African American
Geographical mobility - Moved from different state (%) - Asian
Geographical mobility - Moved from different state (%) - Hispanic or Latino
Geographical mobility - Moved from different state (%) - American Indian and Alaska Native
Geographical mobility - Moved from different state (%) - Multirace
Geographical mobility - Moved from different state (%) - Other Race
Geographical mobility - Moved from abroad (%)
Geographical mobility - Moved from abroad (%) - White
Geographical mobility - Moved from abroad (%) - Black or African American
Geographical mobility - Moved from abroad (%) - Asian
Geographical mobility - Moved from abroad (%) - Hispanic or Latino
Geographical mobility - Moved from abroad (%) - American Indian and Alaska Native
Geographical mobility - Moved from abroad (%) - Multirace
Geographical mobility - Moved from abroad (%) - Other Race
Place of birth for the foreign-born population - Ireland (%)
Place of birth for the foreign-born population - Denmark (%)
Place of birth for the foreign-born population - Norway (%)
Place of birth for the foreign-born population - Sweden (%)
Place of birth for the foreign-born population - United Kingdom (%)
Place of birth for the foreign-born population - England (%)
Place of birth for the foreign-born population - Scotland (%)
Place of birth for the foreign-born population - Other Northern Europe (%)
Place of birth for the foreign-born population - Austria (%)
Place of birth for the foreign-born population - Belgium (%)
Place of birth for the foreign-born population - France (%)
Place of birth for the foreign-born population - Germany (%)
Place of birth for the foreign-born population - Netherlands (%)
Place of birth for the foreign-born population - Switzerland (%)
Place of birth for the foreign-born population - Other Western Europe (%)
Place of birth for the foreign-born population - Greece (%)
Place of birth for the foreign-born population - Italy (%)
Place of birth for the foreign-born population - Portugal (%)
Place of birth for the foreign-born population - Spain (%)
Place of birth for the foreign-born population - Other Southern Europe (%)
Place of birth for the foreign-born population - Albania (%)
Place of birth for the foreign-born population - Belarus (%)
Place of birth for the foreign-born population - Bosnia and Herzegovina (%)
Place of birth for the foreign-born population - Bulgaria (%)
Place of birth for the foreign-born population - Croatia (%)
Place of birth for the foreign-born population - Czechoslovakia (%)
Place of birth for the foreign-born population - Hungary (%)
Place of birth for the foreign-born population - Latvia (%)
Place of birth for the foreign-born population - Lithuania (%)
Place of birth for the foreign-born population - North Macedonia (Macedonia) (%)
Place of birth for the foreign-born population - Moldova (%)
Place of birth for the foreign-born population - Poland (%)
Place of birth for the foreign-born population - Romania (%)
Place of birth for the foreign-born population - Russia (%)
Place of birth for the foreign-born population - Serbia (%)
Place of birth for the foreign-born population - Ukraine (%)
Place of birth for the foreign-born population - Other Eastern Europe (%)
Place of birth for the foreign-born population - China (%)
Place of birth for the foreign-born population - Hong Kong (%)
Place of birth for the foreign-born population - Taiwan (%)
Place of birth for the foreign-born population - Japan (%)
Place of birth for the foreign-born population - Korea (%)
Place of birth for the foreign-born population - Other Eastern Asia (%)
Place of birth for the foreign-born population - Afghanistan (%)
Place of birth for the foreign-born population - Bangladesh (%)
Place of birth for the foreign-born population - India (%)
Place of birth for the foreign-born population - Iran (%)
Place of birth for the foreign-born population - Kazakhstan (%)
Place of birth for the foreign-born population - Nepal (%)
Place of birth for the foreign-born population - Pakistan (%)
Place of birth for the foreign-born population - Sri Lanka (%)
Place of birth for the foreign-born population - Uzbekistan (%)
Place of birth for the foreign-born population - Other South Central Asia (%)
Place of birth for the foreign-born population - Burma (%)
Place of birth for the foreign-born population - Cambodia (%)
Place of birth for the foreign-born population - Indonesia (%)
Place of birth for the foreign-born population - Laos (%)
Place of birth for the foreign-born population - Malaysia (%)
Place of birth for the foreign-born population - Philippines (%)
Place of birth for the foreign-born population - Singapore (%)
Place of birth for the foreign-born population - Thailand (%)
Place of birth for the foreign-born population - Vietnam (%)
Place of birth for the foreign-born population - Other South Eastern Asia (%)
Place of birth for the foreign-born population - Armenia (%)
Place of birth for the foreign-born population - Iraq (%)
Place of birth for the foreign-born population - Israel (%)
Place of birth for the foreign-born population - Jordan (%)
Place of birth for the foreign-born population - Kuwait (%)
Place of birth for the foreign-born population - Lebanon (%)
Place of birth for the foreign-born population - Saudi Arabia (%)
Place of birth for the foreign-born population - Syria (%)
Place of birth for the foreign-born population - Turkey (%)
Place of birth for the foreign-born population - Yemen (%)
Place of birth for the foreign-born population - Other Western Asia (%)
Place of birth for the foreign-born population - Eritrea (%)
Place of birth for the foreign-born population - Ethiopia (%)
Place of birth for the foreign-born population - Kenya (%)
Place of birth for the foreign-born population - Somalia (%)
Place of birth for the foreign-born population - Uganda (%)
Place of birth for the foreign-born population - Zimbabwe (%)
Place of birth for the foreign-born population - Other Eastern Africa (%)
Place of birth for the foreign-born population - Cameroon (%)
Place of birth for the foreign-born population - Congo (%)
Place of birth for the foreign-born population - Democratic Republic of Congo (Zaire) (%)
Place of birth for the foreign-born population - Other Middle Africa (%)
Place of birth for the foreign-born population - Egypt (%)
Place of birth for the foreign-born population - Morocco (%)
Place of birth for the foreign-born population - Sudan (%)
Place of birth for the foreign-born population - Other Northern Africa (%)
Place of birth for the foreign-born population - South Africa (%)
Place of birth for the foreign-born population - Other Southern Africa (%)
Place of birth for the foreign-born population - Cabo Verde (%)
Place of birth for the foreign-born population - Ghana (%)
Place of birth for the foreign-born population - Liberia (%)
Place of birth for the foreign-born population - Nigeria (%)
Place of birth for the foreign-born population - Senegal (%)
Place of birth for the foreign-born population - Sierra Leone (%)
Place of birth for the foreign-born population - Other Western Africa (%)
Place of birth for the foreign-born population - Australia (%)
Place of birth for the foreign-born population - New Zealand (%)
Place of birth for the foreign-born population - Fiji (%)
Place of birth for the foreign-born population - Micronesia (%)
Place of birth for the foreign-born population - Bahamas (%)
Place of birth for the foreign-born population - Barbados (%)
Place of birth for the foreign-born population - Cuba (%)
Place of birth for the foreign-born population - Dominica (%)
Place of birth for the foreign-born population - Dominican Republic (%)
Place of birth for the foreign-born population - Grenada (%)
Place of birth for the foreign-born population - Haiti (%)
Place of birth for the foreign-born population - Jamaica (%)
Place of birth for the foreign-born population - St. Vincent and the Grenadines (%)
Place of birth for the foreign-born population - Trinidad and Tobago (%)
Place of birth for the foreign-born population - West Indies (%)
Place of birth for the foreign-born population - Other Caribbean (%)
Place of birth for the foreign-born population - Belize (%)
Place of birth for the foreign-born population - Costa Rica (%)
Place of birth for the foreign-born population - El Salvador (%)
Place of birth for the foreign-born population - Guatemala (%)
Place of birth for the foreign-born population - Honduras (%)
Place of birth for the foreign-born population - Mexico (%)
Place of birth for the foreign-born population - Nicaragua (%)
Place of birth for the foreign-born population - Panama (%)
Place of birth for the foreign-born population - Other Central America (%)
Place of birth for the foreign-born population - Argentina (%)
Place of birth for the foreign-born population - Bolivia (%)
Place of birth for the foreign-born population - Brazil (%)
Place of birth for the foreign-born population - Chile (%)
Place of birth for the foreign-born population - Colombia (%)
Place of birth for the foreign-born population - Ecuador (%)
Place of birth for the foreign-born population - Guyana (%)
Place of birth for the foreign-born population - Peru (%)
Place of birth for the foreign-born population - Uruguay (%)
Place of birth for the foreign-born population - Venezuela (%)
Place of birth for the foreign-born population - Other South America (%)
Place of birth for the foreign-born population - Canada (%)
Place of birth for the foreign-born population - Other Northern America (%)
Place of birth for the foreign-born population - Other (%)
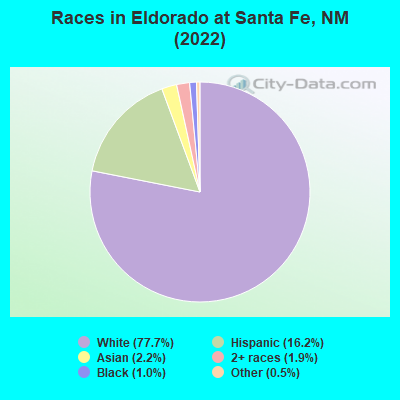
According to 2022 data, the most numerous races in Eldorado at Santa Fe, NM are Hispanic (895 residents), White alone (4,281 residents), and American Indian alone (0 residents). 88.9% of Eldorado at Santa Fe residents speak English at home. 9.9% of Eldorado at Santa Fe, NM residents are foreign-born (5.9% born in Europe, 1.6% born in Asia), which is 9.5% greater than the foreign-born rate of 9.0% across the entire state of New Mexico.
Race distribution in Eldorado at Santa Fe
2000 2022
813,495 44.7% White alone 765,386 42.1% Hispanic 161,460 8.9% American Indian alone 30,654 1.7% Black alone 25,793 1.4% Two or more races 18,257 1.0% Asian alone 3,009 0.2% Other race alone 992 0.05% Native Hawaiian and Other
1,059,867 50.2% Hispanic 735,478 34.8% White alone 171,808 8.1% American Indian alone 65,084 3.1% Two or more races 36,870 1.7% Black alone 35,870 1.7% Asian alone 7,582 0.4% Other race alone 785 0.04% Native Hawaiian and Other
Income and house value in Eldorado at Santa Fe Median household income in 2022 $102,054 White non-Hispanic householders$134,899 Some other race householders$76,318 Hispanic or Latino race householdersMedian 2022 house value $587,583 White Non-Hispanic householders$438,064 Black or African American householders$453,016 American Indian or Alaska Native householders $590,206 Asian householders$548,760 Some other race householders$606,731 Two or more races householders$519,643 Hispanic or Latino householders
Median age by race in Eldorado at Santa Fe
70.5 Median age for White residents71.6 68.4 64.6 Median age for Black or African American residents67.4 -670,719,350.9 -734,126,983.4 Median age for American Indian / Alaska Native residents-612,668,742.9 -796,934,865.1 63.1 Median age for Asian residents61.7 60.1 -658,511,722.1 Median age for Native Hawaiian / Pacific Islander residents-666,666,666.0 -666,666,666.0 34.7 Median age for Other race residents34.8 36.5 53.1 Median age for Two or more races residents56.5 53.8 66.1 Median age for White alone residents67.8 63.9 50.7 Median age for Hispanic or Latino residents34.2 60.2
Owner/renter occupied households by race in Eldorado at Santa Fe
House owners and renters - White residents 1,980 95.2% Owner occupied100 4.8% Renter occupiedHouse owners and renters - Black or African American residents 29 100.0% Owner occupiedHouse owners and renters - Asian residents 35 100.0% Owner occupiedHouse owners and renters - Other race residents 30 67.8% Owner occupied14 32.2% Renter occupiedHouse owners and renters - Two or more races residents 230 91.1% Owner occupied23 8.9% Renter occupiedHouse owners and renters - White alone residents 2,125 94.5% Owner occupied124 5.5% Renter occupiedHouse owners and renters - Hispanic or Latino residents 287 92.7% Owner occupied23 7.3% Renter occupied
Language usage in Eldorado at Santa Fe
English speakers - Total 88.9% of residents of Eldorado at Santa Fe speak English at home.
5.0% of residents speak Spanish at home 219 79.9% Speak English very well55 20.1% Speak English less than very well8.5% of residents speak other language at home 453 96.4% Speak English very well17 3.6% Speak English less than very well
English speakers - Born in the United States 91.6% of residents of Eldorado at Santa Fe speak English at home.
4.2% of residents speak Spanish at home 138 79.3% Speak English very well36 20.7% Speak English less than very well5.4% of residents speak other language at home 223 100.0% Speak English very well
English speakers - Native, born elsewhere 60.7% of residents of Eldorado at Santa Fe speak English at home.
32.1% of residents speak other language at home 8 44.4% Speak English very well10 55.6% Speak English less than very well
English speakers - Foreign-born 66.2% of residents of Eldorado at Santa Fe speak English at home.
3.4% of residents speak Spanish at home 18 100.0% Speak English very well44.6% of residents speak other language at home 230 97.5% Speak English very well6 2.5% Speak English less than very well
White (Caucasian) - Speak only English Native:
99.8% (3,562)Foreign-born:
100.0% (191)
White (Caucasian) - Speak another language Native:
4.8% (172)Foreign-born:
71.5% (137)
Asian - Speak only English Native:
87.0% (23)Foreign-born:
50.5% (49)
Other race - Speak another language Native:
81.2% (100)Foreign-born:
100.0% (29)
Two or more races - Speak only English Native:
97.9% (688)Foreign-born:
55.1% (19)
Two or more races - Speak another language Native:
8.8% (62)Foreign-born:
41.1% (14)
White alone - Speak only English Native:
94.0% (3,622)Foreign-born:
48.9% (231)
White alone - Speak another language Native:
5.8% (224)Foreign-born:
47.6% (225)
Hispanic or Latino - Speak only English Native:
77.7% (665)Foreign-born:
63.5% (23)
Hispanic or Latino - Speak another language Native:
24.8% (212)Foreign-born:
64.1% (23)
Foreign-born residents in Eldorado at Santa Fe 548 residents are foreign born (5.9% Europe , 1.6% Asia ).
This city:
9.9%New Mexico:
9.2%
Marital status for residents in Eldorado at Santa Fe Marital status - White (Caucasian) population 15 years and over
Males 12.8% Never married69.4% Now married0.0% Separated3.9% Widowed13.9% DivorcedFemales 11.5% Never married61.9% Now married0.4% Separated5.3% Widowed20.9% DivorcedWomen who did not give birth in the past 12 months Now married:
66.7% (234)Unmarried:
33.3% (117)
Marital status - Black or African American population 15 years and over
Males 30.0% Never married70.0% Now married0.0% Separated0.0% Widowed0.0% DivorcedFemales 0.0% Never married100.0% Now married0.0% Separated0.0% Widowed0.0% DivorcedMarital status - Asian population 15 years and over
Males 14.5% Never married0.0% Now married0.0% Separated0.0% Widowed85.5% DivorcedFemales 25.5% Never married59.6% Now married0.0% Separated0.0% Widowed14.9% DivorcedWomen who did not give birth in the past 12 months Now married:
0.0% (0)Unmarried:
100.0% (14)
Marital status - Other race population 15 years and over
Males 23.4% Never married76.6% Now married0.0% Separated0.0% Widowed0.0% DivorcedFemales 68.8% Never married31.2% Now married0.0% Separated0.0% Widowed0.0% DivorcedWomen who did not give birth in the past 12 months Now married:
45.5% (14)Unmarried:
54.5% (17)
Marital status - Two or more races population 15 years and over
Males 56.7% Never married25.1% Now married0.0% Separated0.0% Widowed18.1% DivorcedFemales 27.5% Never married61.5% Now married0.0% Separated0.0% Widowed11.0% DivorcedWomen who did not give birth in the past 12 months Now married:
33.8% (39)Unmarried:
66.2% (76)
Marital status - White alone, not Hispanic / Latino population 15 years and over
Males 10.4% Never married70.1% Now married0.0% Separated4.3% Widowed15.3% DivorcedFemales 11.8% Never married59.7% Now married0.4% Separated5.4% Widowed22.6% DivorcedWomen who did not give birth in the past 12 months Now married:
65.3% (295)Unmarried:
34.7% (157)
Marital status - Hispanic or Latino population 15 years and over
Males 46.0% Never married44.6% Now married0.0% Separated0.0% Widowed9.4% DivorcedFemales 20.6% Never married71.6% Now married0.0% Separated2.1% Widowed5.7% DivorcedWomen who did not give birth in the past 12 months Now married:
52.8% (74)Unmarried:
47.2% (67)
Ancestries in Eldorado at Santa Fe
275 9.9% Serbian257 9.3% English242 8.7% European222 8.0% American206 7.4% Irish163 5.9% German138 5.0% Italian80 2.9% Eastern European63 2.3% Scottish35 1.3% Norwegian35 1.3% Scotch-Irish30 1.1% Scandinavian28 1.0% Polish22 0.8% Lebanese21 0.8% Northern European19 0.7% Swedish15 0.5% French14 0.5% Greek13 0.5% Swiss11 0.4% British11 0.4% Dutch9 0.3% Canadian9 0.3% Danish9 0.3% French Canadian7 0.3% Austrian7 0.3% Russian6 0.2% Bulgarian6 0.2% Finnish
Children Nativity (place of birth) in Eldorado at Santa Fe
Children under 6 years - Living with two parents Both parents native 14 50.8% Native13 49.2% Foreign-bornOne native, one foreign-born parent 13 100.0% Foreign-born
Children 6 to 17 years - Living with two parents Both parents native 241 100.0% NativeBoth parents foreign-born 134 100.0% NativeOne native, one foreign-born parent 29 100.0% NativeChildren 6 to 17 years - Living with one parent Native parent 62 100.0% Native