Races in Fond du Lac, Wisconsin (WI) Detailed Stats
Data:
Races - White alone (%)
Races - White alone (% change since 2000)
Races - Black alone (%)
Races - Black alone (% change since 2000)
Races - American Indian alone (%)
Races - American Indian alone (% change since 2000)
Races - Asian alone (%)
Races - Asian alone (% change since 2000)
Races - Hispanic (%)
Races - Hispanic (% change since 2000)
Races - Native Hawaiian and Other Pacific Islander alone (%)
Races - Native Hawaiian and Other Pacific Islander alone (% change since 2000)
Races - Two or more races(%)
Races - Two or more races(% change since 2000)
Races - Other race alone (%)
Races - Other race alone (% change since 2000)
Racial diversity
Place of birth - Born in state of residence (%)
Place of birth - Born in state of residence (%) - White
Place of birth - Born in state of residence (%) - Black or African American
Place of birth - Born in state of residence (%) - Asian
Place of birth - Born in state of residence (%) - Hispanic or Latino
Place of birth - Born in state of residence (%) - American Indian and Alaska Native
Place of birth - Born in state of residence (%) - Multirace
Place of birth - Born in state of residence (%) - Other Race
Place of birth - Born in other state (%)
Place of birth - Born in other state (%) - White
Place of birth - Born in other state (%) - Black or African American
Place of birth - Born in other state (%) - Asian
Place of birth - Born in other state (%) - Hispanic or Latino
Place of birth - Born in other state (%) - American Indian and Alaska Native
Place of birth - Born in other state (%) - Multirace
Place of birth - Born in other state (%) - Other Race
Place of birth - Native, outside of US (%)
Place of birth - Native, outside of US (%) - White
Place of birth - Native, outside of US (%) - Black or African American
Place of birth - Native, outside of US (%) - Asian
Place of birth - Native, outside of US (%) - Hispanic or Latino
Place of birth - Native, outside of US (%) - American Indian and Alaska Native
Place of birth - Native, outside of US (%) - Multirace
Place of birth - Native, outside of US (%) - Other Race
Place of birth - Foreign born (%)
Place of birth - Foreign born (%) - White
Place of birth - Foreign born (%) - Black or African American
Place of birth - Foreign born (%) - Asian
Place of birth - Foreign born (%) - Hispanic or Latino
Place of birth - Foreign born (%) - American Indian and Alaska Native
Place of birth - Foreign born (%) - Multirace
Place of birth - Foreign born (%) - Other Race
Residents speaking English at home (%)
Residents speaking English at home - Born in the United States (%)
Residents speaking English at home - Native, born elsewhere (%)
Residents speaking English at home - Foreign born (%)
Residents speaking Spanish at home (%)
Residents speaking Spanish at home - Born in the United States (%)
Residents speaking Spanish at home - Native, born elsewhere (%)
Residents speaking Spanish at home - Foreign born (%)
Residents speaking other language at home (%)
Residents speaking other language at home - Born in the United States (%)
Residents speaking other language at home - Native, born elsewhere (%)
Residents speaking other language at home - Foreign born (%)
Marital status - Never married (%)
Marital status - Now married (%)
Marital status - Separated (%)
Marital status - Widowed (%)
Marital status - Divorced (%)
Ancestries Reported - Arab (%)
Ancestries Reported - Czech (%)
Ancestries Reported - Danish (%)
Ancestries Reported - Dutch (%)
Ancestries Reported - English (%)
Ancestries Reported - French (%)
Ancestries Reported - French Canadian (%)
Ancestries Reported - German (%)
Ancestries Reported - Greek (%)
Ancestries Reported - Hungarian (%)
Ancestries Reported - Irish (%)
Ancestries Reported - Italian (%)
Ancestries Reported - Lithuanian (%)
Ancestries Reported - Norwegian (%)
Ancestries Reported - Polish (%)
Ancestries Reported - Portuguese (%)
Ancestries Reported - Russian (%)
Ancestries Reported - Scotch-Irish (%)
Ancestries Reported - Scottish (%)
Ancestries Reported - Slovak (%)
Ancestries Reported - Subsaharan African (%)
Ancestries Reported - Swedish (%)
Ancestries Reported - Swiss (%)
Ancestries Reported - Ukrainian (%)
Ancestries Reported - United States (%)
Ancestries Reported - Welsh (%)
Ancestries Reported - West Indian (%)
Ancestries Reported - Other (%)
Geographical mobility - Same house 1 year ago (%)
Geographical mobility - Same house 1 year ago (%) - White
Geographical mobility - Same house 1 year ago (%) - Black or African American
Geographical mobility - Same house 1 year ago (%) - Asian
Geographical mobility - Same house 1 year ago (%) - Hispanic or Latino
Geographical mobility - Same house 1 year ago (%) - American Indian and Alaska Native
Geographical mobility - Same house 1 year ago (%) - Multirace
Geographical mobility - Same house 1 year ago (%) - Other Race
Geographical mobility - Moved within same county (%)
Geographical mobility - Moved within same county (%) - White
Geographical mobility - Moved within same county (%) - Black or African American
Geographical mobility - Moved within same county (%) - Asian
Geographical mobility - Moved within same county (%) - Hispanic or Latino
Geographical mobility - Moved within same county (%) - American Indian and Alaska Native
Geographical mobility - Moved within same county (%) - Multirace
Geographical mobility - Moved within same county (%) - Other Race
Geographical mobility - Moved from different county within same state (%)
Geographical mobility - Moved from different county within same state (%) - White
Geographical mobility - Moved from different county within same state (%) - Black or African American
Geographical mobility - Moved from different county within same state (%) - Asian
Geographical mobility - Moved from different county within same state (%) - Hispanic or Latino
Geographical mobility - Moved from different county within same state (%) - American Indian and Alaska Native
Geographical mobility - Moved from different county within same state (%) - Multirace
Geographical mobility - Moved from different county within same state (%) - Other Race
Geographical mobility - Moved from different state (%)
Geographical mobility - Moved from different state (%) - White
Geographical mobility - Moved from different state (%) - Black or African American
Geographical mobility - Moved from different state (%) - Asian
Geographical mobility - Moved from different state (%) - Hispanic or Latino
Geographical mobility - Moved from different state (%) - American Indian and Alaska Native
Geographical mobility - Moved from different state (%) - Multirace
Geographical mobility - Moved from different state (%) - Other Race
Geographical mobility - Moved from abroad (%)
Geographical mobility - Moved from abroad (%) - White
Geographical mobility - Moved from abroad (%) - Black or African American
Geographical mobility - Moved from abroad (%) - Asian
Geographical mobility - Moved from abroad (%) - Hispanic or Latino
Geographical mobility - Moved from abroad (%) - American Indian and Alaska Native
Geographical mobility - Moved from abroad (%) - Multirace
Geographical mobility - Moved from abroad (%) - Other Race
Place of birth for the foreign-born population - Ireland (%)
Place of birth for the foreign-born population - Denmark (%)
Place of birth for the foreign-born population - Norway (%)
Place of birth for the foreign-born population - Sweden (%)
Place of birth for the foreign-born population - United Kingdom (%)
Place of birth for the foreign-born population - England (%)
Place of birth for the foreign-born population - Scotland (%)
Place of birth for the foreign-born population - Other Northern Europe (%)
Place of birth for the foreign-born population - Austria (%)
Place of birth for the foreign-born population - Belgium (%)
Place of birth for the foreign-born population - France (%)
Place of birth for the foreign-born population - Germany (%)
Place of birth for the foreign-born population - Netherlands (%)
Place of birth for the foreign-born population - Switzerland (%)
Place of birth for the foreign-born population - Other Western Europe (%)
Place of birth for the foreign-born population - Greece (%)
Place of birth for the foreign-born population - Italy (%)
Place of birth for the foreign-born population - Portugal (%)
Place of birth for the foreign-born population - Spain (%)
Place of birth for the foreign-born population - Other Southern Europe (%)
Place of birth for the foreign-born population - Albania (%)
Place of birth for the foreign-born population - Belarus (%)
Place of birth for the foreign-born population - Bosnia and Herzegovina (%)
Place of birth for the foreign-born population - Bulgaria (%)
Place of birth for the foreign-born population - Croatia (%)
Place of birth for the foreign-born population - Czechoslovakia (%)
Place of birth for the foreign-born population - Hungary (%)
Place of birth for the foreign-born population - Latvia (%)
Place of birth for the foreign-born population - Lithuania (%)
Place of birth for the foreign-born population - North Macedonia (Macedonia) (%)
Place of birth for the foreign-born population - Moldova (%)
Place of birth for the foreign-born population - Poland (%)
Place of birth for the foreign-born population - Romania (%)
Place of birth for the foreign-born population - Russia (%)
Place of birth for the foreign-born population - Serbia (%)
Place of birth for the foreign-born population - Ukraine (%)
Place of birth for the foreign-born population - Other Eastern Europe (%)
Place of birth for the foreign-born population - China (%)
Place of birth for the foreign-born population - Hong Kong (%)
Place of birth for the foreign-born population - Taiwan (%)
Place of birth for the foreign-born population - Japan (%)
Place of birth for the foreign-born population - Korea (%)
Place of birth for the foreign-born population - Other Eastern Asia (%)
Place of birth for the foreign-born population - Afghanistan (%)
Place of birth for the foreign-born population - Bangladesh (%)
Place of birth for the foreign-born population - India (%)
Place of birth for the foreign-born population - Iran (%)
Place of birth for the foreign-born population - Kazakhstan (%)
Place of birth for the foreign-born population - Nepal (%)
Place of birth for the foreign-born population - Pakistan (%)
Place of birth for the foreign-born population - Sri Lanka (%)
Place of birth for the foreign-born population - Uzbekistan (%)
Place of birth for the foreign-born population - Other South Central Asia (%)
Place of birth for the foreign-born population - Burma (%)
Place of birth for the foreign-born population - Cambodia (%)
Place of birth for the foreign-born population - Indonesia (%)
Place of birth for the foreign-born population - Laos (%)
Place of birth for the foreign-born population - Malaysia (%)
Place of birth for the foreign-born population - Philippines (%)
Place of birth for the foreign-born population - Singapore (%)
Place of birth for the foreign-born population - Thailand (%)
Place of birth for the foreign-born population - Vietnam (%)
Place of birth for the foreign-born population - Other South Eastern Asia (%)
Place of birth for the foreign-born population - Armenia (%)
Place of birth for the foreign-born population - Iraq (%)
Place of birth for the foreign-born population - Israel (%)
Place of birth for the foreign-born population - Jordan (%)
Place of birth for the foreign-born population - Kuwait (%)
Place of birth for the foreign-born population - Lebanon (%)
Place of birth for the foreign-born population - Saudi Arabia (%)
Place of birth for the foreign-born population - Syria (%)
Place of birth for the foreign-born population - Turkey (%)
Place of birth for the foreign-born population - Yemen (%)
Place of birth for the foreign-born population - Other Western Asia (%)
Place of birth for the foreign-born population - Eritrea (%)
Place of birth for the foreign-born population - Ethiopia (%)
Place of birth for the foreign-born population - Kenya (%)
Place of birth for the foreign-born population - Somalia (%)
Place of birth for the foreign-born population - Uganda (%)
Place of birth for the foreign-born population - Zimbabwe (%)
Place of birth for the foreign-born population - Other Eastern Africa (%)
Place of birth for the foreign-born population - Cameroon (%)
Place of birth for the foreign-born population - Congo (%)
Place of birth for the foreign-born population - Democratic Republic of Congo (Zaire) (%)
Place of birth for the foreign-born population - Other Middle Africa (%)
Place of birth for the foreign-born population - Egypt (%)
Place of birth for the foreign-born population - Morocco (%)
Place of birth for the foreign-born population - Sudan (%)
Place of birth for the foreign-born population - Other Northern Africa (%)
Place of birth for the foreign-born population - South Africa (%)
Place of birth for the foreign-born population - Other Southern Africa (%)
Place of birth for the foreign-born population - Cabo Verde (%)
Place of birth for the foreign-born population - Ghana (%)
Place of birth for the foreign-born population - Liberia (%)
Place of birth for the foreign-born population - Nigeria (%)
Place of birth for the foreign-born population - Senegal (%)
Place of birth for the foreign-born population - Sierra Leone (%)
Place of birth for the foreign-born population - Other Western Africa (%)
Place of birth for the foreign-born population - Australia (%)
Place of birth for the foreign-born population - New Zealand (%)
Place of birth for the foreign-born population - Fiji (%)
Place of birth for the foreign-born population - Micronesia (%)
Place of birth for the foreign-born population - Bahamas (%)
Place of birth for the foreign-born population - Barbados (%)
Place of birth for the foreign-born population - Cuba (%)
Place of birth for the foreign-born population - Dominica (%)
Place of birth for the foreign-born population - Dominican Republic (%)
Place of birth for the foreign-born population - Grenada (%)
Place of birth for the foreign-born population - Haiti (%)
Place of birth for the foreign-born population - Jamaica (%)
Place of birth for the foreign-born population - St. Vincent and the Grenadines (%)
Place of birth for the foreign-born population - Trinidad and Tobago (%)
Place of birth for the foreign-born population - West Indies (%)
Place of birth for the foreign-born population - Other Caribbean (%)
Place of birth for the foreign-born population - Belize (%)
Place of birth for the foreign-born population - Costa Rica (%)
Place of birth for the foreign-born population - El Salvador (%)
Place of birth for the foreign-born population - Guatemala (%)
Place of birth for the foreign-born population - Honduras (%)
Place of birth for the foreign-born population - Mexico (%)
Place of birth for the foreign-born population - Nicaragua (%)
Place of birth for the foreign-born population - Panama (%)
Place of birth for the foreign-born population - Other Central America (%)
Place of birth for the foreign-born population - Argentina (%)
Place of birth for the foreign-born population - Bolivia (%)
Place of birth for the foreign-born population - Brazil (%)
Place of birth for the foreign-born population - Chile (%)
Place of birth for the foreign-born population - Colombia (%)
Place of birth for the foreign-born population - Ecuador (%)
Place of birth for the foreign-born population - Guyana (%)
Place of birth for the foreign-born population - Peru (%)
Place of birth for the foreign-born population - Uruguay (%)
Place of birth for the foreign-born population - Venezuela (%)
Place of birth for the foreign-born population - Other South America (%)
Place of birth for the foreign-born population - Canada (%)
Place of birth for the foreign-born population - Other Northern America (%)
Place of birth for the foreign-born population - Other (%)
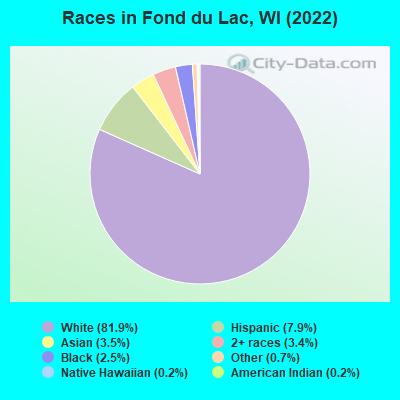
According to 2022 data, the most numerous races in Fond du Lac, WI are White alone (36,422 residents), Hispanic (3,533 residents), and Black alone (1,100 residents). 90.9% of Fond du Lac residents speak English at home. 5.0% of Fond du Lac, WI residents are foreign-born (2.1% born in Latin America, 2.0% born in Asia), which is about the same as the foreign-born rate of 5.0% across the entire state of Wisconsin.
Race distribution in Fond du Lac
2000 2022
4,681,630 87.3% White alone 300,245 5.6% Black alone 192,921 3.6% Hispanic 87,995 1.6% Asian alone 51,921 1.0% Two or more races 43,980 0.8% American Indian alone 3,637 0.07% Other race alone 1,346 0.03% Native Hawaiian and Other
4,654,031 79.0% White alone 447,022 7.6% Hispanic 345,678 5.9% Black alone 217,532 3.7% Two or more races 172,242 2.9% Asian alone 33,762 0.6% American Indian alone 19,680 0.3% Other race alone 2,592 0.04% Native Hawaiian and Other
Income and house value in Fond du Lac Median household income in 2022 $58,212 White non-Hispanic householders$102,224 Asian householders$81,490 Some other race householders$40,219 Two or more races householders$51,529 Hispanic or Latino race householdersMedian 2022 house value $170,254 White Non-Hispanic householders$838,234 Black or African American householders$176,960 American Indian or Alaska Native householders $128,156 Asian householders$168,392 Some other race householders$108,970 Two or more races householders$151,254 Hispanic or Latino householders
Median age by race in Fond du Lac
40.3 Median age for White residents39.5 41.2 38.2 Median age for Black or African American residents38.2 38.0 14.4 Median age for American Indian / Alaska Native residents15.4 21.5 40.9 Median age for Asian residents41.6 40.5 61.1 Median age for Native Hawaiian / Pacific Islander residents-666,666,666.0 -666,666,666.0 29.4 Median age for Other race residents27.8 31.6 24.6 Median age for Two or more races residents21.0 32.0 41.6 Median age for White alone residents41.0 41.8 22.4 Median age for Hispanic or Latino residents21.9 22.1
Owner/renter occupied households by race in Fond du Lac
House owners and renters - White residents 9,935 55.6% Owner occupied7,931 44.4% Renter occupiedHouse owners and renters - Black or African American residents 39 10.9% Owner occupied320 89.1% Renter occupiedHouse owners and renters - American Indian / Alaska Native residents 3 100.0% Owner occupiedHouse owners and renters - Asian residents 128 46.7% Owner occupied146 53.3% Renter occupiedHouse owners and renters - Native Hawaiian / Pacific Islander residents 37 100.0% Owner occupiedHouse owners and renters - Other race residents 57 26.4% Owner occupied159 73.6% Renter occupiedHouse owners and renters - Two or more races residents 521 59.8% Owner occupied351 40.2% Renter occupiedHouse owners and renters - White alone residents 9,819 55.6% Owner occupied7,834 44.4% Renter occupiedHouse owners and renters - Hispanic or Latino residents 517 62.9% Owner occupied305 37.1% Renter occupied
Language usage in Fond du Lac
English speakers - Total 90.9% of residents of Fond du Lac speak English at home.
4.8% of residents speak Spanish at home 960 47.7% Speak English very well1,052 52.3% Speak English less than very well5.0% of residents speak other language at home 684 32.5% Speak English very well1,420 67.5% Speak English less than very well
English speakers - Born in the United States 90.3% of residents of Fond du Lac speak English at home.
7.1% of residents speak Spanish at home 370 69.4% Speak English very well163 30.6% Speak English less than very well2.9% of residents speak other language at home 208 94.1% Speak English very well13 5.9% Speak English less than very well
English speakers - Native, born elsewhere 58.8% of residents of Fond du Lac speak English at home.
6.9% of residents speak Spanish at home 18 100.0% Speak English very well10.8% of residents speak other language at home 28 100.0% Speak English very well
English speakers - Foreign-born 8.1% of residents of Fond du Lac speak English at home.
30.2% of residents speak Spanish at home 234 28.8% Speak English very well579 71.2% Speak English less than very well70.1% of residents speak other language at home 463 24.5% Speak English very well1,424 75.5% Speak English less than very well
White (Caucasian) - Speak only English Native:
97.9% (34,460)Foreign-born:
12.7% (69)
White (Caucasian) - Speak another language Native:
1.8% (625)Foreign-born:
95.2% (520)
Black or African American - Speak only English Native:
97.6% (1,082)Foreign-born:
31.6% (65)
Black or African American - Speak another language Native:
2.0% (23)Foreign-born:
68.5% (140)
Asian - Speak only English Native:
66.5% (238)Foreign-born:
12.8% (106)
Asian - Speak another language Native:
36.0% (129)Foreign-born:
87.8% (729)
Other race - Speak only English Native:
87.2% (381)Foreign-born:
2.8% (10)
Other race - Speak another language Native:
24.9% (108)Foreign-born:
96.4% (346)
Two or more races - Speak another language Native:
19.8% (402)Foreign-born:
100.0% (340)
White alone - Speak only English Native:
98.7% (33,971)Foreign-born:
16.4% (62)
White alone - Speak another language Native:
1.2% (407)Foreign-born:
100.0% (379)
Hispanic or Latino - Speak only English Native:
60.2% (1,386)Foreign-born:
4.8% (38)
Hispanic or Latino - Speak another language Native:
39.7% (914)Foreign-born:
99.3% (784)
Foreign-born residents in Fond du Lac 2,212 residents are foreign born (2.1% Latin America , 2.0% Asia ).
This city:
5.0%Wisconsin:
5.0%
Marital status for residents in Fond du Lac Marital status - White (Caucasian) population 15 years and over
Males 35.7% Never married48.3% Now married0.5% Separated2.8% Widowed12.7% DivorcedFemales 31.8% Never married41.7% Now married1.4% Separated10.5% Widowed14.5% DivorcedWomen who gave birth in the past 12 months Now married:
45.1% (288)Unmarried:
54.9% (350)
Women who did not give birth in the past 12 months Now married:
38.6% (3,169)Unmarried:
61.4% (5,046)
Marital status - Black or African American population 15 years and over
Males 57.7% Never married27.8% Now married1.2% Separated0.9% Widowed12.3% DivorcedFemales 72.3% Never married25.8% Now married0.0% Separated1.9% Widowed0.0% DivorcedWomen who did not give birth in the past 12 months Now married:
23.2% (115)Unmarried:
76.8% (380)
Marital status - American Indian / Alaska Native population 15 years and over
Males 100.0% Never married0.0% Now married0.0% Separated0.0% Widowed0.0% DivorcedFemales 88.8% Never married3.1% Now married3.1% Separated0.0% Widowed5.1% DivorcedWomen who gave birth in the past 12 months Now married:
0.0% (0)Unmarried:
100.0% (26)
Women who did not give birth in the past 12 months Now married:
4.4% (3)Unmarried:
95.6% (62)
Marital status - Asian population 15 years and over
Males 18.7% Never married54.7% Now married26.7% Separated0.0% Widowed0.0% DivorcedFemales 15.0% Never married62.6% Now married4.2% Separated17.5% Widowed0.7% DivorcedWomen who gave birth in the past 12 months Now married:
100.0% (26)Unmarried:
0.0% (0)
Women who did not give birth in the past 12 months Now married:
80.1% (242)Unmarried:
19.9% (60)
Marital status - Native Hawaiian / Pacific Islander population 15 years and over
Males 100.0% Never married0.0% Now married0.0% Separated0.0% Widowed0.0% DivorcedFemales 100.0% Never married0.0% Now married0.0% Separated0.0% Widowed0.0% DivorcedWomen who did not give birth in the past 12 months Now married:
0.0% (0)Unmarried:
100.0% (41)
Marital status - Other race population 15 years and over
Males 49.4% Never married36.2% Now married0.0% Separated0.0% Widowed14.5% DivorcedFemales 63.3% Never married30.7% Now married0.0% Separated0.0% Widowed6.0% DivorcedWomen who gave birth in the past 12 months Now married:
76.9% (9)Unmarried:
23.1% (3)
Women who did not give birth in the past 12 months Now married:
25.9% (73)Unmarried:
74.1% (208)
Marital status - Two or more races population 15 years and over
Males 58.4% Never married21.5% Now married0.0% Separated0.0% Widowed20.2% DivorcedFemales 55.6% Never married29.3% Now married0.0% Separated8.5% Widowed6.6% DivorcedWomen who did not give birth in the past 12 months Now married:
26.9% (194)Unmarried:
73.1% (526)
Marital status - White alone, not Hispanic / Latino population 15 years and over
Males 35.9% Never married48.0% Now married0.5% Separated2.9% Widowed12.8% DivorcedFemales 31.8% Never married41.4% Now married1.3% Separated10.8% Widowed14.7% DivorcedWomen who gave birth in the past 12 months Now married:
46.5% (284)Unmarried:
53.5% (327)
Women who did not give birth in the past 12 months Now married:
37.7% (3,034)Unmarried:
62.3% (5,019)
Marital status - Hispanic or Latino population 15 years and over
Males 32.7% Never married45.6% Now married0.0% Separated0.0% Widowed21.7% DivorcedFemales 54.7% Never married37.9% Now married2.5% Separated0.0% Widowed4.9% DivorcedWomen who gave birth in the past 12 months Now married:
20.0% (9)Unmarried:
80.0% (35)
Women who did not give birth in the past 12 months Now married:
37.9% (336)Unmarried:
62.1% (552)
Ancestries in Fond du Lac
9,577 45.6% German2,085 9.9% American901 4.3% Irish581 2.8% English446 2.1% Polish416 2.0% European368 1.8% Dutch344 1.6% Norwegian294 1.4% Italian183 0.9% French172 0.8% Scotch-Irish113 0.5% Swedish99 0.5% African92 0.4% Liberian90 0.4% Scottish75 0.4% Czech74 0.4% Eastern European72 0.3% Greek53 0.3% Brazilian50 0.2% Russian43 0.2% French Canadian42 0.2% Scandinavian40 0.2% Luxembourger32 0.2% Hungarian29 0.1% Yugoslavian28 0.1% Turkish23 0.1% Finnish21 0.1% Northern European17 0.08% Canadian15 0.07% Danish13 0.06% Croatian12 0.06% Austrian8 0.04% Portuguese8 0.04% Welsh7 0.03% Ukrainian4 0.02% British
Geographical mobility in Fond du Lac Same house 1 year ago 31,420 84.2% White (Caucasian)944 71.0% Black or African American96 72.2% American Indian / Alaska Native618 49.6% Asian95 100.0% Native Hawaiian / Pacific Islander712 87.2% Other race1,918 67.3% Two or more races30,910 85.6% White alone, not Hispanic / Latino2,059 59.0% Hispanic or LatinoMoved within same county 3,313 8.9% White / Caucasian259 19.5% Black or African American342 27.5% Asian17 2.1% Other race302 10.6% Two or more races2,673 7.4% White alone, not Hispanic / Latino714 20.5% Hispanic or LatinoMoved within same state 2,088 5.6% White / Caucasian115 8.6% Black or African American36 26.8% American Indian / Alaska Native20 1.6% Asian62 7.6% Other race651 22.8% Two or more races1,914 5.3% White alone, not Hispanic / Latino701 20.1% Hispanic or LatinoMoved from different state 280 0.8% White / Caucasian12 0.9% Black or African American208 16.7% Asian55 1.9% Two or more races320 0.9% White alone, not Hispanic / Latino72 2.1% Hispanic or LatinoMoved from abroad 50 0.1% White3 0.2% Asian13 0.5% Two or more races53 0.1% White alone, not Hispanic / Latino20 0.6% Hispanic or Latino
Children Nativity (place of birth) in Fond du Lac
Children under 6 years - Living with two parents Both parents native 1,309 100.0% NativeBoth parents foreign-born 144 90.3% Native15 9.7% Foreign-bornOne native, one foreign-born parent 168 100.0% NativeChildren under 6 years - Living with one parent Native parent 1,066 100.0% NativeForeign-born parent 13 100.0% NativeChildren 6 to 17 years - Living with two parents Both parents native 2,813 99.3% Native19 0.7% Foreign-bornBoth parents foreign-born 460 70.3% Native194 29.7% Foreign-bornOne native, one foreign-born parent 582 100.0% NativeChildren 6 to 17 years - Living with one parent Native parent 2,037 100.0% NativeForeign-born parent 132 48.4% Native141 51.6% Foreign-born
Grandparents responsible for own grandchildren in Fond du Lac
Grandparents (30 to 59 years) White / Caucasian 186 64.7% Responsible for grandchildren102 35.3% Not responsible for grandchildrenWhite alone, not Hispanic / Latino 193 65.4% Responsible for grandchildren102 34.6% Not responsible for grandchildrenGrandparents (60 years and over) White / Caucasian 46 16.2% Responsible for grandchildren239 83.8% Not responsible for grandchildrenWhite alone, not Hispanic / Latino 47 16.4% Responsible for grandchildren239 83.6% Not responsible for grandchildren