Races in Four Corners, Texas (TX) Detailed Stats
Data:
Races - White alone (%)
Races - White alone (% change since 2000)
Races - Black alone (%)
Races - Black alone (% change since 2000)
Races - American Indian alone (%)
Races - American Indian alone (% change since 2000)
Races - Asian alone (%)
Races - Asian alone (% change since 2000)
Races - Hispanic (%)
Races - Hispanic (% change since 2000)
Races - Native Hawaiian and Other Pacific Islander alone (%)
Races - Native Hawaiian and Other Pacific Islander alone (% change since 2000)
Races - Two or more races(%)
Races - Two or more races(% change since 2000)
Races - Other race alone (%)
Races - Other race alone (% change since 2000)
Racial diversity
Place of birth - Born in state of residence (%)
Place of birth - Born in state of residence (%) - White
Place of birth - Born in state of residence (%) - Black or African American
Place of birth - Born in state of residence (%) - Asian
Place of birth - Born in state of residence (%) - Hispanic or Latino
Place of birth - Born in state of residence (%) - American Indian and Alaska Native
Place of birth - Born in state of residence (%) - Multirace
Place of birth - Born in state of residence (%) - Other Race
Place of birth - Born in other state (%)
Place of birth - Born in other state (%) - White
Place of birth - Born in other state (%) - Black or African American
Place of birth - Born in other state (%) - Asian
Place of birth - Born in other state (%) - Hispanic or Latino
Place of birth - Born in other state (%) - American Indian and Alaska Native
Place of birth - Born in other state (%) - Multirace
Place of birth - Born in other state (%) - Other Race
Place of birth - Native, outside of US (%)
Place of birth - Native, outside of US (%) - White
Place of birth - Native, outside of US (%) - Black or African American
Place of birth - Native, outside of US (%) - Asian
Place of birth - Native, outside of US (%) - Hispanic or Latino
Place of birth - Native, outside of US (%) - American Indian and Alaska Native
Place of birth - Native, outside of US (%) - Multirace
Place of birth - Native, outside of US (%) - Other Race
Place of birth - Foreign born (%)
Place of birth - Foreign born (%) - White
Place of birth - Foreign born (%) - Black or African American
Place of birth - Foreign born (%) - Asian
Place of birth - Foreign born (%) - Hispanic or Latino
Place of birth - Foreign born (%) - American Indian and Alaska Native
Place of birth - Foreign born (%) - Multirace
Place of birth - Foreign born (%) - Other Race
Residents speaking English at home (%)
Residents speaking English at home - Born in the United States (%)
Residents speaking English at home - Native, born elsewhere (%)
Residents speaking English at home - Foreign born (%)
Residents speaking Spanish at home (%)
Residents speaking Spanish at home - Born in the United States (%)
Residents speaking Spanish at home - Native, born elsewhere (%)
Residents speaking Spanish at home - Foreign born (%)
Residents speaking other language at home (%)
Residents speaking other language at home - Born in the United States (%)
Residents speaking other language at home - Native, born elsewhere (%)
Residents speaking other language at home - Foreign born (%)
Marital status - Never married (%)
Marital status - Now married (%)
Marital status - Separated (%)
Marital status - Widowed (%)
Marital status - Divorced (%)
Ancestries Reported - Arab (%)
Ancestries Reported - Czech (%)
Ancestries Reported - Danish (%)
Ancestries Reported - Dutch (%)
Ancestries Reported - English (%)
Ancestries Reported - French (%)
Ancestries Reported - French Canadian (%)
Ancestries Reported - German (%)
Ancestries Reported - Greek (%)
Ancestries Reported - Hungarian (%)
Ancestries Reported - Irish (%)
Ancestries Reported - Italian (%)
Ancestries Reported - Lithuanian (%)
Ancestries Reported - Norwegian (%)
Ancestries Reported - Polish (%)
Ancestries Reported - Portuguese (%)
Ancestries Reported - Russian (%)
Ancestries Reported - Scotch-Irish (%)
Ancestries Reported - Scottish (%)
Ancestries Reported - Slovak (%)
Ancestries Reported - Subsaharan African (%)
Ancestries Reported - Swedish (%)
Ancestries Reported - Swiss (%)
Ancestries Reported - Ukrainian (%)
Ancestries Reported - United States (%)
Ancestries Reported - Welsh (%)
Ancestries Reported - West Indian (%)
Ancestries Reported - Other (%)
Geographical mobility - Same house 1 year ago (%)
Geographical mobility - Same house 1 year ago (%) - White
Geographical mobility - Same house 1 year ago (%) - Black or African American
Geographical mobility - Same house 1 year ago (%) - Asian
Geographical mobility - Same house 1 year ago (%) - Hispanic or Latino
Geographical mobility - Same house 1 year ago (%) - American Indian and Alaska Native
Geographical mobility - Same house 1 year ago (%) - Multirace
Geographical mobility - Same house 1 year ago (%) - Other Race
Geographical mobility - Moved within same county (%)
Geographical mobility - Moved within same county (%) - White
Geographical mobility - Moved within same county (%) - Black or African American
Geographical mobility - Moved within same county (%) - Asian
Geographical mobility - Moved within same county (%) - Hispanic or Latino
Geographical mobility - Moved within same county (%) - American Indian and Alaska Native
Geographical mobility - Moved within same county (%) - Multirace
Geographical mobility - Moved within same county (%) - Other Race
Geographical mobility - Moved from different county within same state (%)
Geographical mobility - Moved from different county within same state (%) - White
Geographical mobility - Moved from different county within same state (%) - Black or African American
Geographical mobility - Moved from different county within same state (%) - Asian
Geographical mobility - Moved from different county within same state (%) - Hispanic or Latino
Geographical mobility - Moved from different county within same state (%) - American Indian and Alaska Native
Geographical mobility - Moved from different county within same state (%) - Multirace
Geographical mobility - Moved from different county within same state (%) - Other Race
Geographical mobility - Moved from different state (%)
Geographical mobility - Moved from different state (%) - White
Geographical mobility - Moved from different state (%) - Black or African American
Geographical mobility - Moved from different state (%) - Asian
Geographical mobility - Moved from different state (%) - Hispanic or Latino
Geographical mobility - Moved from different state (%) - American Indian and Alaska Native
Geographical mobility - Moved from different state (%) - Multirace
Geographical mobility - Moved from different state (%) - Other Race
Geographical mobility - Moved from abroad (%)
Geographical mobility - Moved from abroad (%) - White
Geographical mobility - Moved from abroad (%) - Black or African American
Geographical mobility - Moved from abroad (%) - Asian
Geographical mobility - Moved from abroad (%) - Hispanic or Latino
Geographical mobility - Moved from abroad (%) - American Indian and Alaska Native
Geographical mobility - Moved from abroad (%) - Multirace
Geographical mobility - Moved from abroad (%) - Other Race
Place of birth for the foreign-born population - Ireland (%)
Place of birth for the foreign-born population - Denmark (%)
Place of birth for the foreign-born population - Norway (%)
Place of birth for the foreign-born population - Sweden (%)
Place of birth for the foreign-born population - United Kingdom (%)
Place of birth for the foreign-born population - England (%)
Place of birth for the foreign-born population - Scotland (%)
Place of birth for the foreign-born population - Other Northern Europe (%)
Place of birth for the foreign-born population - Austria (%)
Place of birth for the foreign-born population - Belgium (%)
Place of birth for the foreign-born population - France (%)
Place of birth for the foreign-born population - Germany (%)
Place of birth for the foreign-born population - Netherlands (%)
Place of birth for the foreign-born population - Switzerland (%)
Place of birth for the foreign-born population - Other Western Europe (%)
Place of birth for the foreign-born population - Greece (%)
Place of birth for the foreign-born population - Italy (%)
Place of birth for the foreign-born population - Portugal (%)
Place of birth for the foreign-born population - Spain (%)
Place of birth for the foreign-born population - Other Southern Europe (%)
Place of birth for the foreign-born population - Albania (%)
Place of birth for the foreign-born population - Belarus (%)
Place of birth for the foreign-born population - Bosnia and Herzegovina (%)
Place of birth for the foreign-born population - Bulgaria (%)
Place of birth for the foreign-born population - Croatia (%)
Place of birth for the foreign-born population - Czechoslovakia (%)
Place of birth for the foreign-born population - Hungary (%)
Place of birth for the foreign-born population - Latvia (%)
Place of birth for the foreign-born population - Lithuania (%)
Place of birth for the foreign-born population - North Macedonia (Macedonia) (%)
Place of birth for the foreign-born population - Moldova (%)
Place of birth for the foreign-born population - Poland (%)
Place of birth for the foreign-born population - Romania (%)
Place of birth for the foreign-born population - Russia (%)
Place of birth for the foreign-born population - Serbia (%)
Place of birth for the foreign-born population - Ukraine (%)
Place of birth for the foreign-born population - Other Eastern Europe (%)
Place of birth for the foreign-born population - China (%)
Place of birth for the foreign-born population - Hong Kong (%)
Place of birth for the foreign-born population - Taiwan (%)
Place of birth for the foreign-born population - Japan (%)
Place of birth for the foreign-born population - Korea (%)
Place of birth for the foreign-born population - Other Eastern Asia (%)
Place of birth for the foreign-born population - Afghanistan (%)
Place of birth for the foreign-born population - Bangladesh (%)
Place of birth for the foreign-born population - India (%)
Place of birth for the foreign-born population - Iran (%)
Place of birth for the foreign-born population - Kazakhstan (%)
Place of birth for the foreign-born population - Nepal (%)
Place of birth for the foreign-born population - Pakistan (%)
Place of birth for the foreign-born population - Sri Lanka (%)
Place of birth for the foreign-born population - Uzbekistan (%)
Place of birth for the foreign-born population - Other South Central Asia (%)
Place of birth for the foreign-born population - Burma (%)
Place of birth for the foreign-born population - Cambodia (%)
Place of birth for the foreign-born population - Indonesia (%)
Place of birth for the foreign-born population - Laos (%)
Place of birth for the foreign-born population - Malaysia (%)
Place of birth for the foreign-born population - Philippines (%)
Place of birth for the foreign-born population - Singapore (%)
Place of birth for the foreign-born population - Thailand (%)
Place of birth for the foreign-born population - Vietnam (%)
Place of birth for the foreign-born population - Other South Eastern Asia (%)
Place of birth for the foreign-born population - Armenia (%)
Place of birth for the foreign-born population - Iraq (%)
Place of birth for the foreign-born population - Israel (%)
Place of birth for the foreign-born population - Jordan (%)
Place of birth for the foreign-born population - Kuwait (%)
Place of birth for the foreign-born population - Lebanon (%)
Place of birth for the foreign-born population - Saudi Arabia (%)
Place of birth for the foreign-born population - Syria (%)
Place of birth for the foreign-born population - Turkey (%)
Place of birth for the foreign-born population - Yemen (%)
Place of birth for the foreign-born population - Other Western Asia (%)
Place of birth for the foreign-born population - Eritrea (%)
Place of birth for the foreign-born population - Ethiopia (%)
Place of birth for the foreign-born population - Kenya (%)
Place of birth for the foreign-born population - Somalia (%)
Place of birth for the foreign-born population - Uganda (%)
Place of birth for the foreign-born population - Zimbabwe (%)
Place of birth for the foreign-born population - Other Eastern Africa (%)
Place of birth for the foreign-born population - Cameroon (%)
Place of birth for the foreign-born population - Congo (%)
Place of birth for the foreign-born population - Democratic Republic of Congo (Zaire) (%)
Place of birth for the foreign-born population - Other Middle Africa (%)
Place of birth for the foreign-born population - Egypt (%)
Place of birth for the foreign-born population - Morocco (%)
Place of birth for the foreign-born population - Sudan (%)
Place of birth for the foreign-born population - Other Northern Africa (%)
Place of birth for the foreign-born population - South Africa (%)
Place of birth for the foreign-born population - Other Southern Africa (%)
Place of birth for the foreign-born population - Cabo Verde (%)
Place of birth for the foreign-born population - Ghana (%)
Place of birth for the foreign-born population - Liberia (%)
Place of birth for the foreign-born population - Nigeria (%)
Place of birth for the foreign-born population - Senegal (%)
Place of birth for the foreign-born population - Sierra Leone (%)
Place of birth for the foreign-born population - Other Western Africa (%)
Place of birth for the foreign-born population - Australia (%)
Place of birth for the foreign-born population - New Zealand (%)
Place of birth for the foreign-born population - Fiji (%)
Place of birth for the foreign-born population - Micronesia (%)
Place of birth for the foreign-born population - Bahamas (%)
Place of birth for the foreign-born population - Barbados (%)
Place of birth for the foreign-born population - Cuba (%)
Place of birth for the foreign-born population - Dominica (%)
Place of birth for the foreign-born population - Dominican Republic (%)
Place of birth for the foreign-born population - Grenada (%)
Place of birth for the foreign-born population - Haiti (%)
Place of birth for the foreign-born population - Jamaica (%)
Place of birth for the foreign-born population - St. Vincent and the Grenadines (%)
Place of birth for the foreign-born population - Trinidad and Tobago (%)
Place of birth for the foreign-born population - West Indies (%)
Place of birth for the foreign-born population - Other Caribbean (%)
Place of birth for the foreign-born population - Belize (%)
Place of birth for the foreign-born population - Costa Rica (%)
Place of birth for the foreign-born population - El Salvador (%)
Place of birth for the foreign-born population - Guatemala (%)
Place of birth for the foreign-born population - Honduras (%)
Place of birth for the foreign-born population - Mexico (%)
Place of birth for the foreign-born population - Nicaragua (%)
Place of birth for the foreign-born population - Panama (%)
Place of birth for the foreign-born population - Other Central America (%)
Place of birth for the foreign-born population - Argentina (%)
Place of birth for the foreign-born population - Bolivia (%)
Place of birth for the foreign-born population - Brazil (%)
Place of birth for the foreign-born population - Chile (%)
Place of birth for the foreign-born population - Colombia (%)
Place of birth for the foreign-born population - Ecuador (%)
Place of birth for the foreign-born population - Guyana (%)
Place of birth for the foreign-born population - Peru (%)
Place of birth for the foreign-born population - Uruguay (%)
Place of birth for the foreign-born population - Venezuela (%)
Place of birth for the foreign-born population - Other South America (%)
Place of birth for the foreign-born population - Canada (%)
Place of birth for the foreign-born population - Other Northern America (%)
Place of birth for the foreign-born population - Other (%)
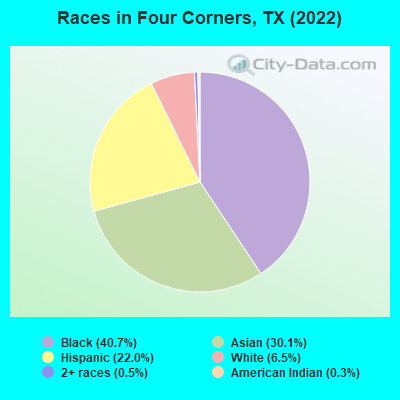
According to 2022 data, the most numerous races in Four Corners, TX are Hispanic (2,707 residents), White alone (801 residents), and Black alone (4,994 residents). 38.4% of Four Corners residents speak English at home. 42.9% of Four Corners, TX residents are foreign-born (20.1% born in Asia, 12.0% born in Africa, 11.3% born in Latin America), which is 60.4% greater than the foreign-born rate of 17.0% across the entire state of Texas.
Race distribution in Four Corners
2000 2022
10,933,313 52.4% White alone 6,669,666 32.0% Hispanic 2,364,255 11.3% Black alone 554,445 2.7% Asian alone 230,567 1.1% Two or more races 68,859 0.3% American Indian alone 19,958 0.10% Other race alone 10,757 0.05% Native Hawaiian and Other
12,070,642 40.2% Hispanic 11,683,430 38.9% White alone 3,508,706 11.7% Black alone 1,608,173 5.4% Asian alone 956,560 3.2% Two or more races 125,763 0.4% Other race alone 47,023 0.2% American Indian alone 29,275 0.10% Native Hawaiian and Other
Income and house value in Four Corners Median household income in 2022 $49,221 White non-Hispanic householders$64,591 Black householders$81,565 Asian householders$74,697 Some other race householders$69,398 Two or more races householders$67,997 Hispanic or Latino race householdersMedian 2022 house value $297,823 White Non-Hispanic householders$245,460 Black or African American householders $286,533 Asian householders$364,979 Some other race householders$316,315 Two or more races householders$182,586 Hispanic or Latino householders
Median age by race in Four Corners
42.5 Median age for White residents45.3 38.3 30.1 Median age for Black or African American residents29.2 33.5 -823,170,730.9 Median age for American Indian / Alaska Native residents-811,501,596.6 -762,172,283.9 33.0 Median age for Asian residents44.8 30.0 -581,560,283.1 Median age for Native Hawaiian / Pacific Islander residents-612,729,233.5 -577,777,777.2 36.2 Median age for Other race residents23.9 50.1 24.7 Median age for Two or more races residents27.2 24.6 27.5 Median age for White alone residents22.8 28.0 34.4 Median age for Hispanic or Latino residents31.5 36.3
Owner/renter occupied households by race in Four Corners
House owners and renters - White residents 258 81.8% Owner occupied57 18.2% Renter occupiedHouse owners and renters - Black or African American residents 886 63.3% Owner occupied514 36.7% Renter occupiedHouse owners and renters - Asian residents 756 75.5% Owner occupied245 24.5% Renter occupiedHouse owners and renters - Other race residents 307 65.5% Owner occupied162 34.5% Renter occupiedHouse owners and renters - Two or more races residents 238 75.3% Owner occupied78 24.7% Renter occupiedHouse owners and renters - White alone residents 128 63.5% Owner occupied73 36.5% Renter occupiedHouse owners and renters - Hispanic or Latino residents 602 78.4% Owner occupied166 21.6% Renter occupied
Language usage in Four Corners
English speakers - Total 38.4% of residents of Four Corners speak English at home.
19.6% of residents speak Spanish at home 1,261 54.6% Speak English very well1,047 45.4% Speak English less than very well41.8% of residents speak other language at home 2,762 56.1% Speak English very well2,162 43.9% Speak English less than very well
English speakers - Born in the United States 43.2% of residents of Four Corners speak English at home.
4.9% of residents speak Spanish at home 86 100.0% Speak English very well44.4% of residents speak other language at home 453 58.5% Speak English very well321 41.5% Speak English less than very well
English speakers - Native, born elsewhere 39.4% of residents of Four Corners speak English at home.
77.2% of residents speak other language at home 149 100.0% Speak English very well
English speakers - Foreign-born 15.0% of residents of Four Corners speak English at home.
20.5% of residents speak Spanish at home 291 26.0% Speak English very well829 74.0% Speak English less than very well64.5% of residents speak other language at home 1,840 52.1% Speak English very well1,694 47.9% Speak English less than very well
White (Caucasian) - Speak only English Native:
85.6% (427)Foreign-born:
19.7% (76)
White (Caucasian) - Speak another language Native:
11.7% (58)Foreign-born:
76.2% (293)
Black or African American - Speak only English Native:
97.6% (2,935)Foreign-born:
32.1% (435)
Black or African American - Speak another language Native:
2.4% (72)Foreign-born:
67.7% (918)
Asian - Speak only English Native:
14.5% (216)Foreign-born:
5.3% (114)
Asian - Speak another language Native:
85.1% (1,275)Foreign-born:
94.2% (2,022)
Other race - Speak another language Native:
93.9% (1,000)Foreign-born:
93.1% (708)
Two or more races - Speak only English Native:
23.6% (183)Foreign-born:
6.0% (33)
Two or more races - Speak another language Native:
83.5% (647)Foreign-born:
88.2% (482)
White alone - Speak only English Native:
93.5% (410)Foreign-born:
22.5% (82)
White alone - Speak another language Native:
6.4% (28)Foreign-born:
76.8% (280)
Hispanic or Latino - Speak only English Native:
18.6% (263)Foreign-born:
3.3% (39)
Hispanic or Latino - Speak another language Native:
85.1% (1,202)Foreign-born:
93.7% (1,118)
Foreign-born residents in Four Corners 5,270 residents are foreign born (20.1% Asia , 12.0% Africa , 11.3% Latin America ).
This city:
42.9%Texas:
17.1%
Marital status for residents in Four Corners Marital status - White (Caucasian) population 15 years and over
Males 38.0% Never married52.1% Now married6.1% Separated2.0% Widowed1.8% DivorcedFemales 34.5% Never married53.6% Now married2.1% Separated2.0% Widowed7.8% DivorcedWomen who gave birth in the past 12 months Now married:
100.0% (26)Unmarried:
0.0% (0)
Women who did not give birth in the past 12 months Now married:
46.2% (126)Unmarried:
53.8% (147)
Marital status - Black or African American population 15 years and over
Males 35.2% Never married57.1% Now married2.9% Separated0.0% Widowed4.7% DivorcedFemales 30.4% Never married42.9% Now married0.0% Separated10.7% Widowed16.0% DivorcedWomen who did not give birth in the past 12 months Now married:
41.6% (630)Unmarried:
58.4% (884)
Marital status - Asian population 15 years and over
Males 39.1% Never married56.9% Now married0.0% Separated2.0% Widowed2.0% DivorcedFemales 30.1% Never married48.6% Now married3.2% Separated6.3% Widowed11.9% DivorcedWomen who did not give birth in the past 12 months Now married:
28.7% (265)Unmarried:
71.3% (660)
Marital status - Other race population 15 years and over
Males 40.7% Never married56.1% Now married0.0% Separated0.0% Widowed3.2% DivorcedFemales 41.0% Never married29.3% Now married8.3% Separated21.5% Widowed0.0% DivorcedWomen who did not give birth in the past 12 months Now married:
43.7% (201)Unmarried:
56.3% (259)
Marital status - Two or more races population 15 years and over
Males 34.7% Never married65.3% Now married0.0% Separated0.0% Widowed0.0% DivorcedFemales 48.0% Never married29.0% Now married0.0% Separated0.0% Widowed22.9% DivorcedWomen who did not give birth in the past 12 months Now married:
26.9% (175)Unmarried:
73.1% (476)
Marital status - White alone, not Hispanic / Latino population 15 years and over
Males 43.9% Never married50.2% Now married0.0% Separated3.1% Widowed2.8% DivorcedFemales 48.3% Never married48.0% Now married3.0% Separated0.7% Widowed0.0% DivorcedWomen who did not give birth in the past 12 months Now married:
46.2% (155)Unmarried:
53.8% (180)
Marital status - Hispanic or Latino population 15 years and over
Males 35.4% Never married59.3% Now married3.2% Separated0.0% Widowed2.0% DivorcedFemales 36.1% Never married35.5% Now married4.3% Separated11.9% Widowed12.3% DivorcedWomen who gave birth in the past 12 months Now married:
100.0% (34)Unmarried:
0.0% (0)
Women who did not give birth in the past 12 months Now married:
35.6% (260)Unmarried:
64.4% (470)
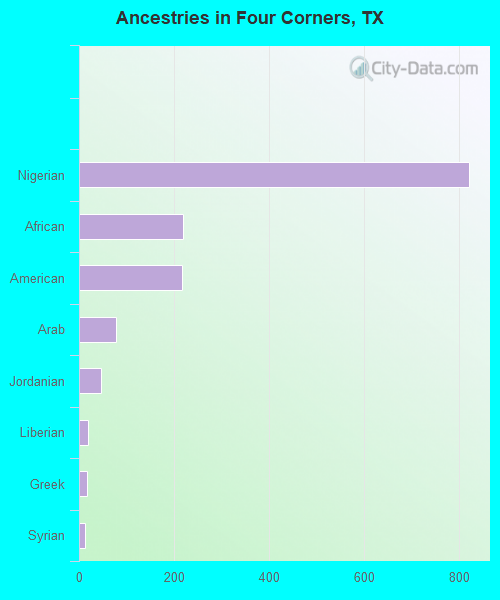
Ancestries in Four Corners
823 9.5% Nigerian220 2.5% African217 2.5% American79 0.9% Arab47 0.5% Jordanian18 0.2% Liberian16 0.2% Greek12 0.1% Syrian
Children Nativity (place of birth) in Four Corners
Children under 6 years - Living with two parents Both parents native 97 100.0% NativeBoth parents foreign-born 155 100.0% NativeOne native, one foreign-born parent 51 100.0% NativeChildren under 6 years - Living with one parent Native parent 364 100.0% NativeForeign-born parent 513 100.0% NativeChildren 6 to 17 years - Living with two parents Both parents native 328 100.0% NativeBoth parents foreign-born 880 87.5% Native126 12.5% Foreign-bornOne native, one foreign-born parent 92 100.0% NativeChildren 6 to 17 years - Living with one parent Native parent 470 100.0% NativeForeign-born parent 693 53.4% Native605 46.6% Foreign-born
Grandparents responsible for own grandchildren in Four Corners
Grandparents (30 to 59 years) Black or African American 28 47.4% Responsible for grandchildren31 52.6% Not responsible for grandchildrenAsian 49 100.0% Responsible for grandchildrenTwo or more races 20 100.0% Responsible for grandchildrenHispanic or Latino 18 100.0% Responsible for grandchildrenGrandparents (60 years and over) Black or African American 32 16.9% Responsible for grandchildren158 83.1% Not responsible for grandchildrenAsian 42 22.9% Responsible for grandchildren142 77.1% Not responsible for grandchildrenHispanic or Latino 141 100.0% Not responsible for grandchildren