Races in Metairie, Louisiana (LA) Detailed Stats
Data:
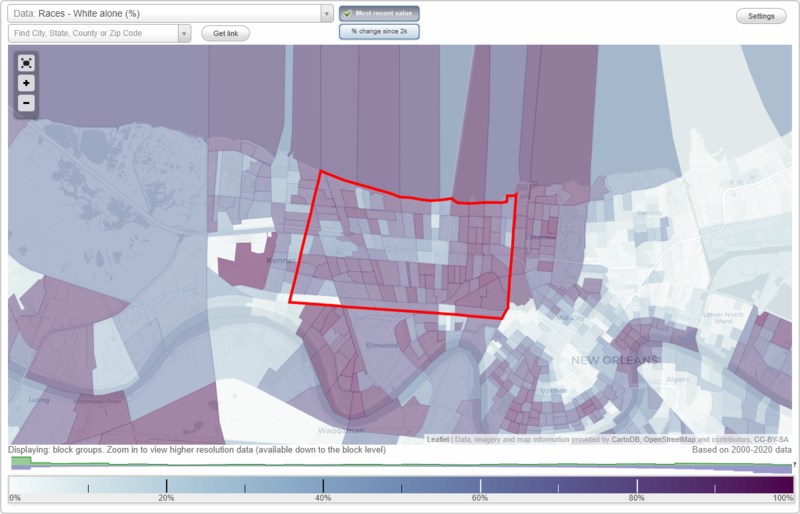
Races - White alone (%)
Races - White alone (% change since 2000)
Races - Black alone (%)
Races - Black alone (% change since 2000)
Races - American Indian alone (%)
Races - American Indian alone (% change since 2000)
Races - Asian alone (%)
Races - Asian alone (% change since 2000)
Races - Hispanic (%)
Races - Hispanic (% change since 2000)
Races - Native Hawaiian and Other Pacific Islander alone (%)
Races - Native Hawaiian and Other Pacific Islander alone (% change since 2000)
Races - Two or more races(%)
Races - Two or more races(% change since 2000)
Races - Other race alone (%)
Races - Other race alone (% change since 2000)
Racial diversity
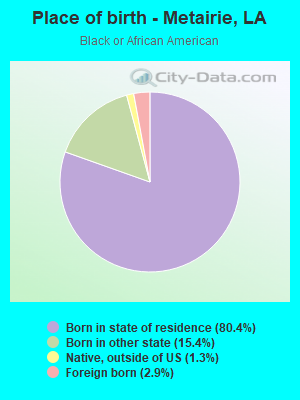
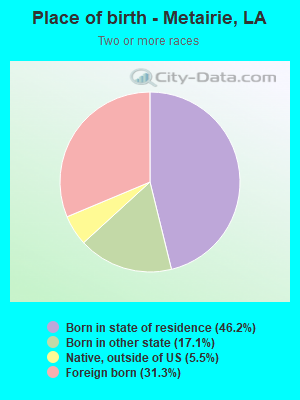
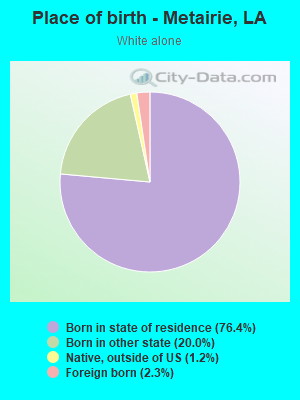
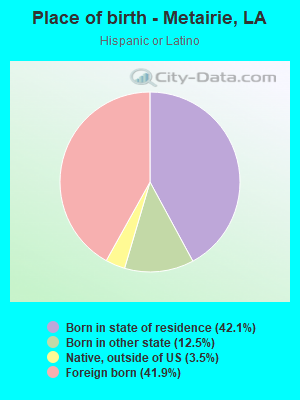
Place of birth - Born in state of residence (%)
Place of birth - Born in state of residence (%) - White
Place of birth - Born in state of residence (%) - Black or African American
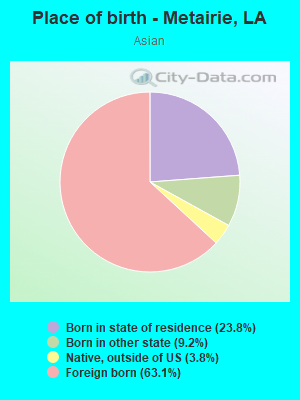
Place of birth - Born in state of residence (%) - Asian
Place of birth - Born in state of residence (%) - Hispanic or Latino
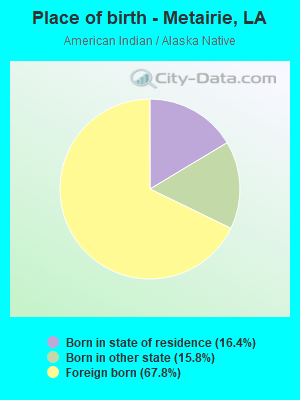
Place of birth - Born in state of residence (%) - American Indian and Alaska Native
Place of birth - Born in state of residence (%) - Multirace
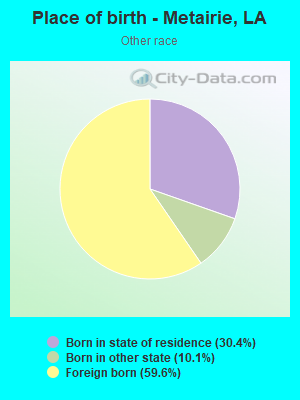
Place of birth - Born in state of residence (%) - Other Race
Place of birth - Born in other state (%)
Place of birth - Born in other state (%) - White
Place of birth - Born in other state (%) - Black or African American
Place of birth - Born in other state (%) - Asian
Place of birth - Born in other state (%) - Hispanic or Latino
Place of birth - Born in other state (%) - American Indian and Alaska Native
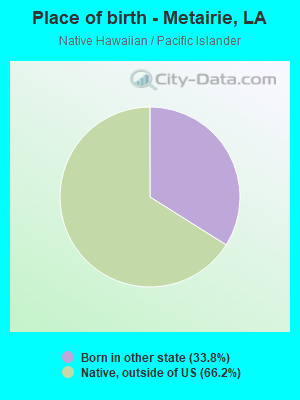
Place of birth - Born in other state (%) - Multirace
Place of birth - Born in other state (%) - Other Race
Place of birth - Native, outside of US (%)
Place of birth - Native, outside of US (%) - White
Place of birth - Native, outside of US (%) - Black or African American
Place of birth - Native, outside of US (%) - Asian
Place of birth - Native, outside of US (%) - Hispanic or Latino
Place of birth - Native, outside of US (%) - American Indian and Alaska Native
Place of birth - Native, outside of US (%) - Multirace
Place of birth - Native, outside of US (%) - Other Race
Place of birth - Foreign born (%)
Place of birth - Foreign born (%) - White
Place of birth - Foreign born (%) - Black or African American
Place of birth - Foreign born (%) - Asian
Place of birth - Foreign born (%) - Hispanic or Latino
Place of birth - Foreign born (%) - American Indian and Alaska Native
Place of birth - Foreign born (%) - Multirace
Place of birth - Foreign born (%) - Other Race
Residents speaking English at home (%)
Residents speaking English at home - Born in the United States (%)
Residents speaking English at home - Native, born elsewhere (%)
Residents speaking English at home - Foreign born (%)
Residents speaking Spanish at home (%)
Residents speaking Spanish at home - Born in the United States (%)
Residents speaking Spanish at home - Native, born elsewhere (%)
Residents speaking Spanish at home - Foreign born (%)
Residents speaking other language at home (%)
Residents speaking other language at home - Born in the United States (%)
Residents speaking other language at home - Native, born elsewhere (%)
Residents speaking other language at home - Foreign born (%)
Marital status - Never married (%)
Marital status - Now married (%)
Marital status - Separated (%)
Marital status - Widowed (%)
Marital status - Divorced (%)
Ancestries Reported - Arab (%)
Ancestries Reported - Czech (%)
Ancestries Reported - Danish (%)
Ancestries Reported - Dutch (%)
Ancestries Reported - English (%)
Ancestries Reported - French (%)
Ancestries Reported - French Canadian (%)
Ancestries Reported - German (%)
Ancestries Reported - Greek (%)
Ancestries Reported - Hungarian (%)
Ancestries Reported - Irish (%)
Ancestries Reported - Italian (%)
Ancestries Reported - Lithuanian (%)
Ancestries Reported - Norwegian (%)
Ancestries Reported - Polish (%)
Ancestries Reported - Portuguese (%)
Ancestries Reported - Russian (%)
Ancestries Reported - Scotch-Irish (%)
Ancestries Reported - Scottish (%)
Ancestries Reported - Slovak (%)
Ancestries Reported - Subsaharan African (%)
Ancestries Reported - Swedish (%)
Ancestries Reported - Swiss (%)
Ancestries Reported - Ukrainian (%)
Ancestries Reported - United States (%)
Ancestries Reported - Welsh (%)
Ancestries Reported - West Indian (%)
Ancestries Reported - Other (%)
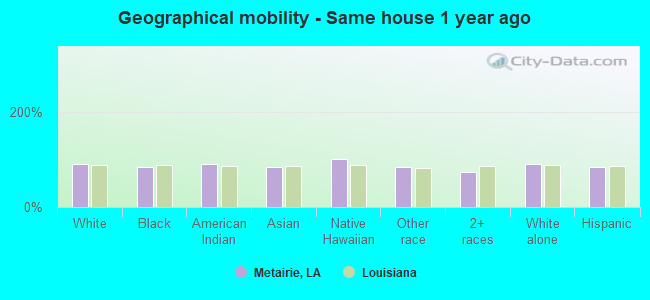
Geographical mobility - Same house 1 year ago (%)
Geographical mobility - Same house 1 year ago (%) - White
Geographical mobility - Same house 1 year ago (%) - Black or African American
Geographical mobility - Same house 1 year ago (%) - Asian
Geographical mobility - Same house 1 year ago (%) - Hispanic or Latino
Geographical mobility - Same house 1 year ago (%) - American Indian and Alaska Native
Geographical mobility - Same house 1 year ago (%) - Multirace
Geographical mobility - Same house 1 year ago (%) - Other Race
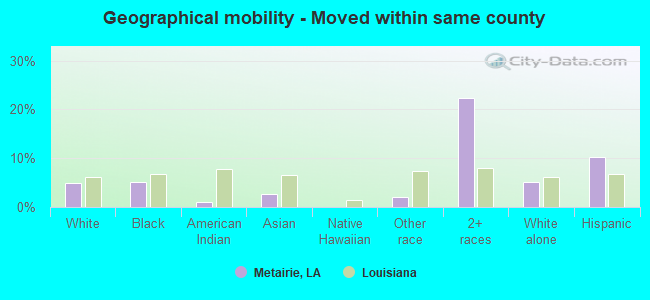
Geographical mobility - Moved within same county (%)
Geographical mobility - Moved within same county (%) - White
Geographical mobility - Moved within same county (%) - Black or African American
Geographical mobility - Moved within same county (%) - Asian
Geographical mobility - Moved within same county (%) - Hispanic or Latino
Geographical mobility - Moved within same county (%) - American Indian and Alaska Native
Geographical mobility - Moved within same county (%) - Multirace
Geographical mobility - Moved within same county (%) - Other Race
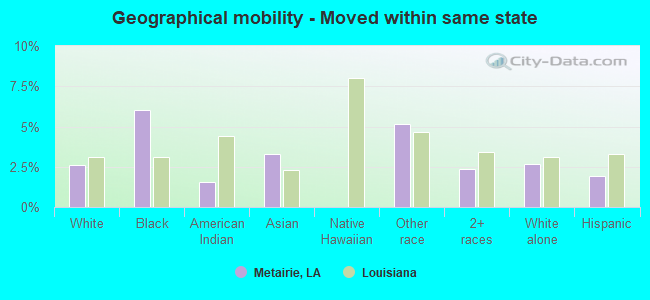
Geographical mobility - Moved from different county within same state (%)
Geographical mobility - Moved from different county within same state (%) - White
Geographical mobility - Moved from different county within same state (%) - Black or African American
Geographical mobility - Moved from different county within same state (%) - Asian
Geographical mobility - Moved from different county within same state (%) - Hispanic or Latino
Geographical mobility - Moved from different county within same state (%) - American Indian and Alaska Native
Geographical mobility - Moved from different county within same state (%) - Multirace
Geographical mobility - Moved from different county within same state (%) - Other Race
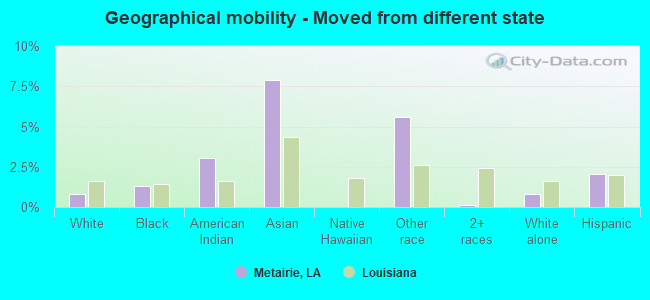
Geographical mobility - Moved from different state (%)
Geographical mobility - Moved from different state (%) - White
Geographical mobility - Moved from different state (%) - Black or African American
Geographical mobility - Moved from different state (%) - Asian
Geographical mobility - Moved from different state (%) - Hispanic or Latino
Geographical mobility - Moved from different state (%) - American Indian and Alaska Native
Geographical mobility - Moved from different state (%) - Multirace
Geographical mobility - Moved from different state (%) - Other Race
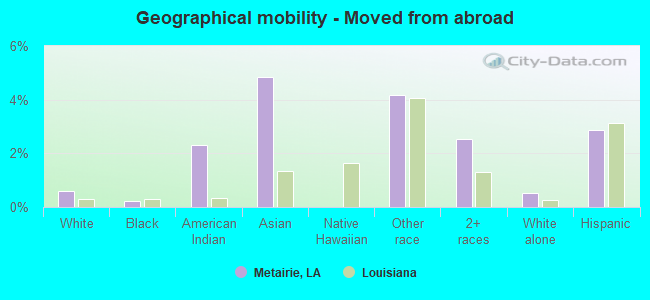
Geographical mobility - Moved from abroad (%)
Geographical mobility - Moved from abroad (%) - White
Geographical mobility - Moved from abroad (%) - Black or African American
Geographical mobility - Moved from abroad (%) - Asian
Geographical mobility - Moved from abroad (%) - Hispanic or Latino
Geographical mobility - Moved from abroad (%) - American Indian and Alaska Native
Geographical mobility - Moved from abroad (%) - Multirace
Geographical mobility - Moved from abroad (%) - Other Race
Place of birth for the foreign-born population - Ireland (%)
Place of birth for the foreign-born population - Denmark (%)
Place of birth for the foreign-born population - Norway (%)
Place of birth for the foreign-born population - Sweden (%)
Place of birth for the foreign-born population - United Kingdom (%)
Place of birth for the foreign-born population - England (%)
Place of birth for the foreign-born population - Scotland (%)
Place of birth for the foreign-born population - Other Northern Europe (%)
Place of birth for the foreign-born population - Austria (%)
Place of birth for the foreign-born population - Belgium (%)
Place of birth for the foreign-born population - France (%)
Place of birth for the foreign-born population - Germany (%)
Place of birth for the foreign-born population - Netherlands (%)
Place of birth for the foreign-born population - Switzerland (%)
Place of birth for the foreign-born population - Other Western Europe (%)
Place of birth for the foreign-born population - Greece (%)
Place of birth for the foreign-born population - Italy (%)
Place of birth for the foreign-born population - Portugal (%)
Place of birth for the foreign-born population - Spain (%)
Place of birth for the foreign-born population - Other Southern Europe (%)
Place of birth for the foreign-born population - Albania (%)
Place of birth for the foreign-born population - Belarus (%)
Place of birth for the foreign-born population - Bosnia and Herzegovina (%)
Place of birth for the foreign-born population - Bulgaria (%)
Place of birth for the foreign-born population - Croatia (%)
Place of birth for the foreign-born population - Czechoslovakia (%)
Place of birth for the foreign-born population - Hungary (%)
Place of birth for the foreign-born population - Latvia (%)
Place of birth for the foreign-born population - Lithuania (%)
Place of birth for the foreign-born population - North Macedonia (Macedonia) (%)
Place of birth for the foreign-born population - Moldova (%)
Place of birth for the foreign-born population - Poland (%)
Place of birth for the foreign-born population - Romania (%)
Place of birth for the foreign-born population - Russia (%)
Place of birth for the foreign-born population - Serbia (%)
Place of birth for the foreign-born population - Ukraine (%)
Place of birth for the foreign-born population - Other Eastern Europe (%)
Place of birth for the foreign-born population - China (%)
Place of birth for the foreign-born population - Hong Kong (%)
Place of birth for the foreign-born population - Taiwan (%)
Place of birth for the foreign-born population - Japan (%)
Place of birth for the foreign-born population - Korea (%)
Place of birth for the foreign-born population - Other Eastern Asia (%)
Place of birth for the foreign-born population - Afghanistan (%)
Place of birth for the foreign-born population - Bangladesh (%)
Place of birth for the foreign-born population - India (%)
Place of birth for the foreign-born population - Iran (%)
Place of birth for the foreign-born population - Kazakhstan (%)
Place of birth for the foreign-born population - Nepal (%)
Place of birth for the foreign-born population - Pakistan (%)
Place of birth for the foreign-born population - Sri Lanka (%)
Place of birth for the foreign-born population - Uzbekistan (%)
Place of birth for the foreign-born population - Other South Central Asia (%)
Place of birth for the foreign-born population - Burma (%)
Place of birth for the foreign-born population - Cambodia (%)
Place of birth for the foreign-born population - Indonesia (%)
Place of birth for the foreign-born population - Laos (%)
Place of birth for the foreign-born population - Malaysia (%)
Place of birth for the foreign-born population - Philippines (%)
Place of birth for the foreign-born population - Singapore (%)
Place of birth for the foreign-born population - Thailand (%)
Place of birth for the foreign-born population - Vietnam (%)
Place of birth for the foreign-born population - Other South Eastern Asia (%)
Place of birth for the foreign-born population - Armenia (%)
Place of birth for the foreign-born population - Iraq (%)
Place of birth for the foreign-born population - Israel (%)
Place of birth for the foreign-born population - Jordan (%)
Place of birth for the foreign-born population - Kuwait (%)
Place of birth for the foreign-born population - Lebanon (%)
Place of birth for the foreign-born population - Saudi Arabia (%)
Place of birth for the foreign-born population - Syria (%)
Place of birth for the foreign-born population - Turkey (%)
Place of birth for the foreign-born population - Yemen (%)
Place of birth for the foreign-born population - Other Western Asia (%)
Place of birth for the foreign-born population - Eritrea (%)
Place of birth for the foreign-born population - Ethiopia (%)
Place of birth for the foreign-born population - Kenya (%)
Place of birth for the foreign-born population - Somalia (%)
Place of birth for the foreign-born population - Uganda (%)
Place of birth for the foreign-born population - Zimbabwe (%)
Place of birth for the foreign-born population - Other Eastern Africa (%)
Place of birth for the foreign-born population - Cameroon (%)
Place of birth for the foreign-born population - Congo (%)
Place of birth for the foreign-born population - Democratic Republic of Congo (Zaire) (%)
Place of birth for the foreign-born population - Other Middle Africa (%)
Place of birth for the foreign-born population - Egypt (%)
Place of birth for the foreign-born population - Morocco (%)
Place of birth for the foreign-born population - Sudan (%)
Place of birth for the foreign-born population - Other Northern Africa (%)
Place of birth for the foreign-born population - South Africa (%)
Place of birth for the foreign-born population - Other Southern Africa (%)
Place of birth for the foreign-born population - Cabo Verde (%)
Place of birth for the foreign-born population - Ghana (%)
Place of birth for the foreign-born population - Liberia (%)
Place of birth for the foreign-born population - Nigeria (%)
Place of birth for the foreign-born population - Senegal (%)
Place of birth for the foreign-born population - Sierra Leone (%)
Place of birth for the foreign-born population - Other Western Africa (%)
Place of birth for the foreign-born population - Australia (%)
Place of birth for the foreign-born population - New Zealand (%)
Place of birth for the foreign-born population - Fiji (%)
Place of birth for the foreign-born population - Micronesia (%)
Place of birth for the foreign-born population - Bahamas (%)
Place of birth for the foreign-born population - Barbados (%)
Place of birth for the foreign-born population - Cuba (%)
Place of birth for the foreign-born population - Dominica (%)
Place of birth for the foreign-born population - Dominican Republic (%)
Place of birth for the foreign-born population - Grenada (%)
Place of birth for the foreign-born population - Haiti (%)
Place of birth for the foreign-born population - Jamaica (%)
Place of birth for the foreign-born population - St. Vincent and the Grenadines (%)
Place of birth for the foreign-born population - Trinidad and Tobago (%)
Place of birth for the foreign-born population - West Indies (%)
Place of birth for the foreign-born population - Other Caribbean (%)
Place of birth for the foreign-born population - Belize (%)
Place of birth for the foreign-born population - Costa Rica (%)
Place of birth for the foreign-born population - El Salvador (%)
Place of birth for the foreign-born population - Guatemala (%)
Place of birth for the foreign-born population - Honduras (%)
Place of birth for the foreign-born population - Mexico (%)
Place of birth for the foreign-born population - Nicaragua (%)
Place of birth for the foreign-born population - Panama (%)
Place of birth for the foreign-born population - Other Central America (%)
Place of birth for the foreign-born population - Argentina (%)
Place of birth for the foreign-born population - Bolivia (%)
Place of birth for the foreign-born population - Brazil (%)
Place of birth for the foreign-born population - Chile (%)
Place of birth for the foreign-born population - Colombia (%)
Place of birth for the foreign-born population - Ecuador (%)
Place of birth for the foreign-born population - Guyana (%)
Place of birth for the foreign-born population - Peru (%)
Place of birth for the foreign-born population - Uruguay (%)
Place of birth for the foreign-born population - Venezuela (%)
Place of birth for the foreign-born population - Other South America (%)
Place of birth for the foreign-born population - Canada (%)
Place of birth for the foreign-born population - Other Northern America (%)
Place of birth for the foreign-born population - Other (%)
Latest news about races in Metairie, LA collected exclusively by city-data.com from local newspapers, TV, and radio stations
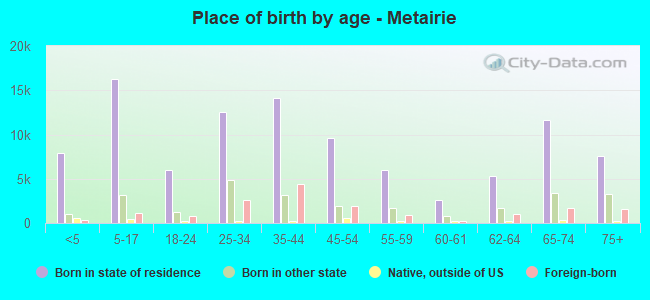
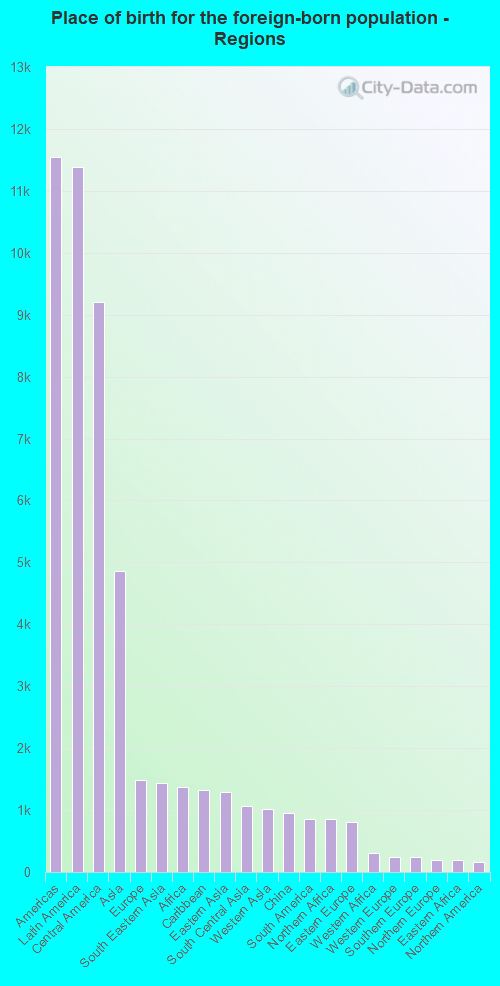
According to 2022 data, the most numerous races in Metairie, LA are White alone (94,828 residents), Black alone (14,219 residents), and Hispanic (21,009 residents). 82.7% of Metairie residents speak English at home. 14.1% of Metairie, LA residents are foreign-born (8.0% born in Latin America, 3.4% born in Asia), which is 71.6% greater than the foreign-born rate of 4.0% across the entire state of Louisiana.
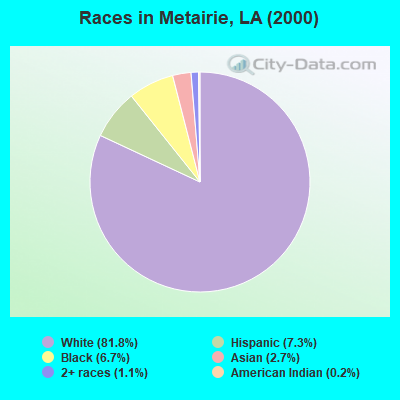
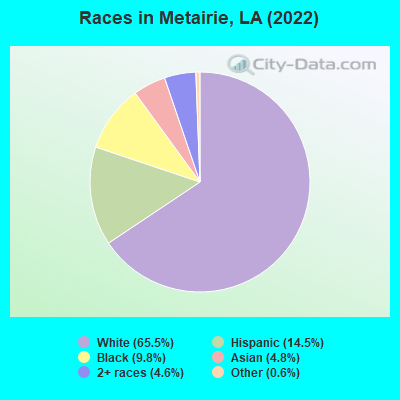
Race distribution in Metairie
2000 2022
119,535 81.8% White alone 10,595 7.3% Hispanic 9,860 6.7% Black alone 4,002 2.7% Asian alone 1,648 1.1% Two or more races 336 0.2% American Indian alone 129 0.09% Other race alone 31 0.02% Native Hawaiian and Other
94,828 65.5% White alone 21,009 14.5% Hispanic 14,219 9.8% Black alone 6,942 4.8% Asian alone 6,729 4.6% Two or more races 909 0.6% Other race alone 93 0.06% American Indian alone
2000 2022
2,794,391 62.5% White alone 1,443,390 32.3% Black alone 107,738 2.4% Hispanic 54,256 1.2% Asian alone 39,260 0.9% Two or more races 24,129 0.5% American Indian alone 4,736 0.1% Other race alone 1,076 0.02% Native Hawaiian and Other
2,603,221 56.7% White alone 1,420,055 30.9% Black alone 262,213 5.7% Hispanic 183,270 4.0% Two or more races 81,169 1.8% Asian alone 19,991 0.4% American Indian alone 18,043 0.4% Other race alone 2,279 0.05% Native Hawaiian and Other
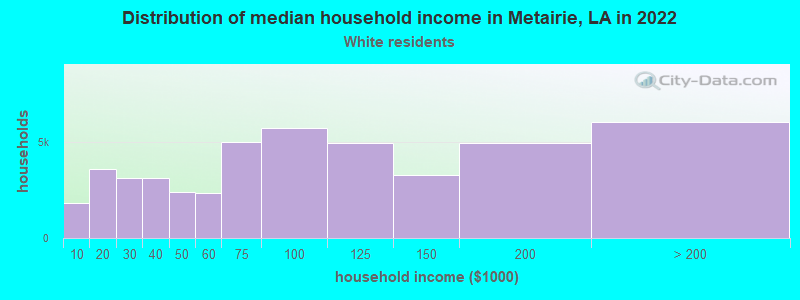
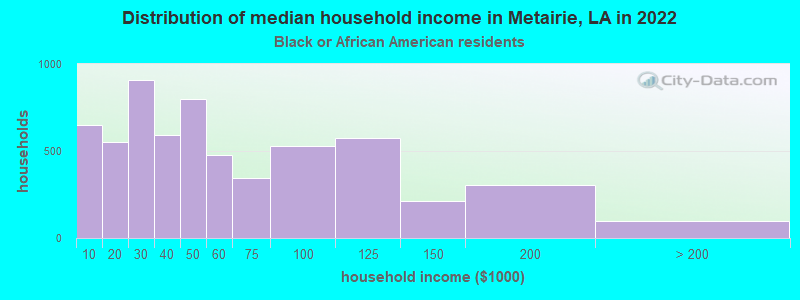
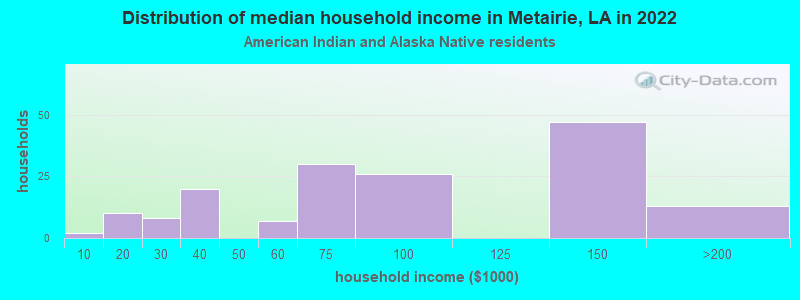
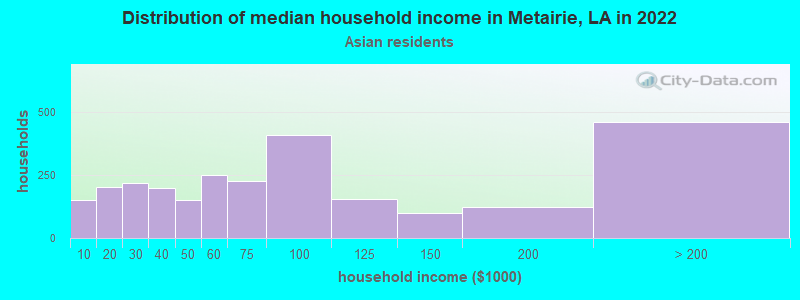
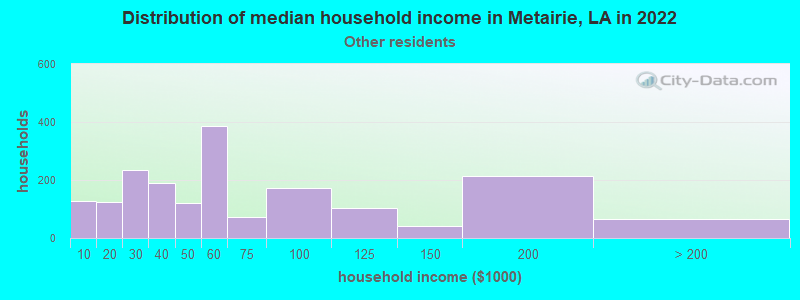
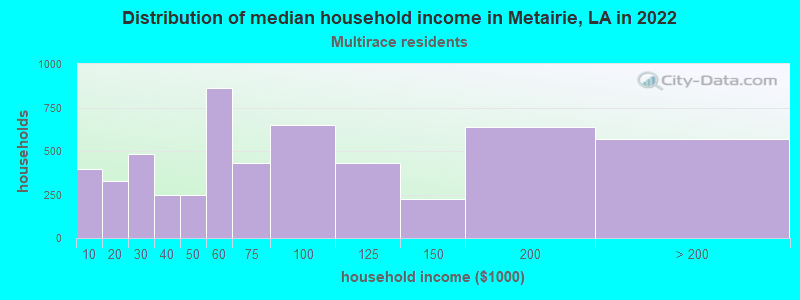
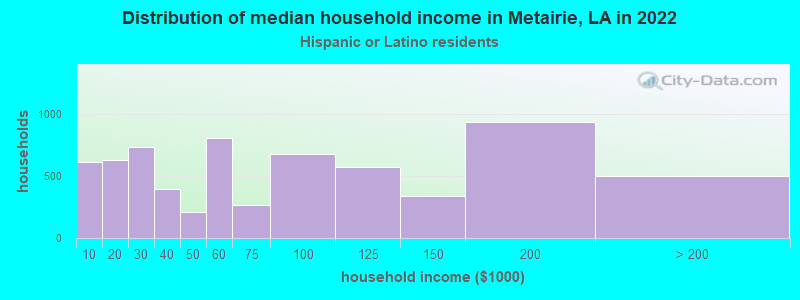
Income and house value in Metairie Median household income in 2022 $82,088 White non-Hispanic householders$44,261 Black householders$64,099 Asian householders$55,443 Some other race householders$65,880 Two or more races householders$58,691 Hispanic or Latino race householdersMedian 2022 house value $330,624 White Non-Hispanic householders$136,526 Black or African American householders$319,345 American Indian or Alaska Native householders $360,232 Asian householders$263,888 Some other race householders$294,436 Two or more races householders$303,366 Hispanic or Latino householders
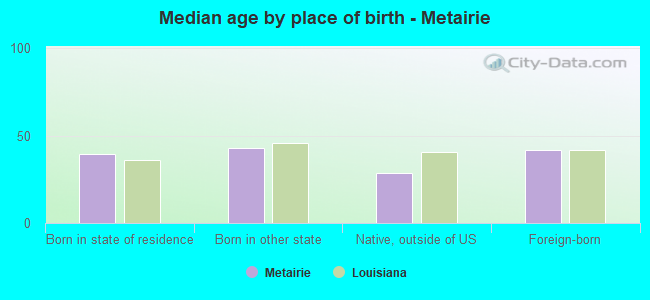
Median age by race in Metairie
44.5 Median age for White residents40.3 49.9 36.8 Median age for Black or African American residents35.3 38.4 63.7 Median age for American Indian / Alaska Native residents-666,666,666.0 63.4 42.5 Median age for Asian residents45.5 40.5 -666,666,666.0 Median age for Native Hawaiian / Pacific Islander residents-666,666,666.0 -666,666,666.0 27.7 Median age for Other race residents23.6 34.8 34.2 Median age for Two or more races residents34.5 34.1 45.5 Median age for White alone residents41.0 51.0 34.3 Median age for Hispanic or Latino residents31.9 36.3
Owner/renter occupied households by race in Metairie
House owners and renters - White residents 32,905 70.8% Owner occupied13,578 29.2% Renter occupiedHouse owners and renters - Black or African American residents 1,150 17.6% Owner occupied5,394 82.4% Renter occupiedHouse owners and renters - American Indian / Alaska Native residents 44 20.7% Owner occupied168 79.3% Renter occupiedHouse owners and renters - Asian residents 2,061 67.3% Owner occupied1,003 32.7% Renter occupiedHouse owners and renters - Native Hawaiian / Pacific Islander residents 3 100.0% Owner occupiedHouse owners and renters - Other race residents 922 45.8% Owner occupied1,092 54.2% Renter occupiedHouse owners and renters - Two or more races residents 2,714 49.3% Owner occupied2,791 50.7% Renter occupiedHouse owners and renters - White alone residents 32,348 70.9% Owner occupied13,273 29.1% Renter occupiedHouse owners and renters - Hispanic or Latino residents 3,315 49.7% Owner occupied3,360 50.3% Renter occupied
Language usage in Metairie
English speakers - Total 82.7% of residents of Metairie speak English at home.
8.6% of residents speak Spanish at home 7,277 62.4% Speak English very well4,390 37.6% Speak English less than very well8.6% of residents speak other language at home 6,465 55.6% Speak English very well5,159 44.4% Speak English less than very well
English speakers - Born in the United States 89.2% of residents of Metairie speak English at home.
6.3% of residents speak Spanish at home 1,574 100.0% Speak English very well4.6% of residents speak other language at home 1,003 87.3% Speak English very well146 12.7% Speak English less than very well
English speakers - Native, born elsewhere 43.4% of residents of Metairie speak English at home.
9.2% of residents speak Spanish at home 125 75.8% Speak English very well40 24.2% Speak English less than very well47.4% of residents speak other language at home 793 93.3% Speak English very well57 6.7% Speak English less than very well
English speakers - Foreign-born 11.4% of residents of Metairie speak English at home.
46.2% of residents speak Spanish at home 3,483 46.1% Speak English very well4,075 53.9% Speak English less than very well42.4% of residents speak other language at home 2,635 38.0% Speak English very well4,304 62.0% Speak English less than very well
White (Caucasian) - Speak only English Native:
95.6% (86,687)Foreign-born:
11.4% (278)
White (Caucasian) - Speak another language Native:
4.4% (4,032)Foreign-born:
88.6% (2,163)
Black or African American - Speak only English Native:
96.4% (12,877)Foreign-born:
39.2% (160)
Black or African American - Speak another language Native:
3.6% (486)Foreign-born:
60.5% (247)
American Indian / Alaska Native - Speak only English Native:
76.5% (155)Foreign-born:
4.6% (26)
American Indian / Alaska Native - Speak another language Native:
24.8% (50)Foreign-born:
99.0% (556)
Asian - Speak only English Native:
44.7% (1,119)Foreign-born:
11.9% (521)
Asian - Speak another language Native:
55.3% (1,384)Foreign-born:
88.1% (3,862)
Other race - Speak only English Native:
59.9% (1,237)Foreign-born:
14.4% (593)
Other race - Speak another language Native:
40.1% (829)Foreign-born:
85.6% (3,514)
Two or more races - Speak only English Native:
73.5% (6,708)Foreign-born:
9.1% (477)
Two or more races - Speak another language Native:
26.5% (2,418)Foreign-born:
90.9% (4,793)
White alone - Speak only English Native:
96.2% (83,948)Foreign-born:
12.5% (278)
White alone - Speak another language Native:
3.8% (3,352)Foreign-born:
87.5% (1,944)
Hispanic or Latino - Speak only English Native:
66.1% (6,525)Foreign-born:
11.0% (930)
Hispanic or Latino - Speak another language Native:
33.9% (3,350)Foreign-born:
89.0% (7,558)
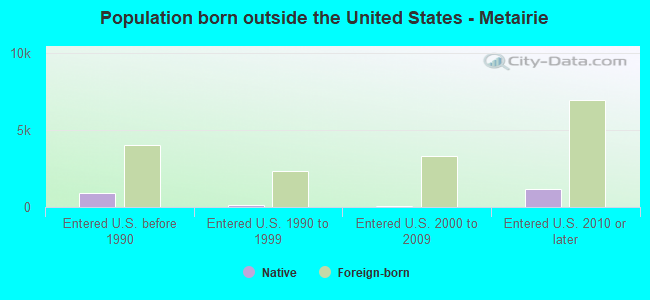
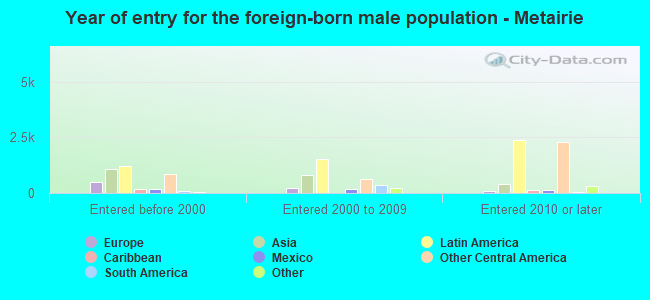
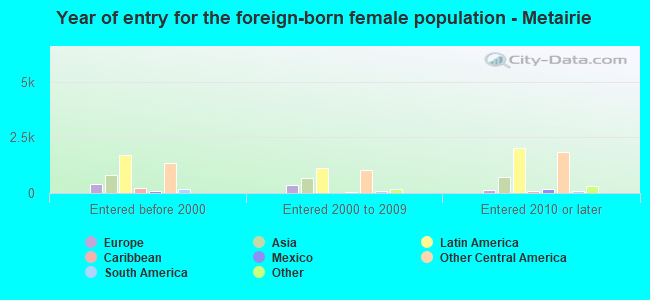
Foreign-born residents in Metairie 19,254 residents are foreign born (8.0% Latin America , 3.4% Asia ).
This city:
14.1%Louisiana:
4.2%
Marital status for residents in Metairie Marital status - White (Caucasian) population 15 years and over
Males 34.7% Never married50.9% Now married1.4% Separated1.6% Widowed11.4% DivorcedFemales 24.4% Never married43.7% Now married1.8% Separated13.2% Widowed16.9% DivorcedWomen who gave birth in the past 12 months Now married:
67.6% (989)Unmarried:
32.4% (475)
Women who did not give birth in the past 12 months Now married:
41.5% (6,997)Unmarried:
58.5% (9,868)
Marital status - Black or African American population 15 years and over
Males 59.3% Never married27.9% Now married2.7% Separated0.5% Widowed9.7% DivorcedFemales 52.3% Never married13.4% Now married8.5% Separated10.0% Widowed15.9% DivorcedWomen who gave birth in the past 12 months Now married:
67.8% (140)Unmarried:
32.2% (67)
Women who did not give birth in the past 12 months Now married:
25.2% (982)Unmarried:
74.8% (2,915)
Marital status - American Indian / Alaska Native population 15 years and over
Males 60.8% Never married27.9% Now married0.0% Separated2.8% Widowed8.5% DivorcedFemales 50.2% Never married35.0% Now married0.0% Separated11.7% Widowed3.1% DivorcedWomen who gave birth in the past 12 months Now married:
40.0% (13)Unmarried:
60.0% (20)
Women who did not give birth in the past 12 months Now married:
41.4% (30)Unmarried:
58.6% (42)
Marital status - Asian population 15 years and over
Males 28.3% Never married66.0% Now married0.0% Separated0.8% Widowed4.9% DivorcedFemales 36.5% Never married49.8% Now married0.8% Separated8.5% Widowed4.4% DivorcedWomen who gave birth in the past 12 months Now married:
72.3% (94)Unmarried:
27.7% (36)
Women who did not give birth in the past 12 months Now married:
53.8% (781)Unmarried:
46.2% (671)
Marital status - Other race population 15 years and over
Males 47.7% Never married31.2% Now married9.6% Separated2.5% Widowed9.1% DivorcedFemales 41.3% Never married40.3% Now married2.9% Separated2.0% Widowed13.6% DivorcedWomen who gave birth in the past 12 months Now married:
63.2% (53)Unmarried:
36.8% (31)
Women who did not give birth in the past 12 months Now married:
28.9% (294)Unmarried:
71.1% (723)
Marital status - Two or more races population 15 years and over
Males 38.3% Never married45.4% Now married0.0% Separated2.3% Widowed14.0% DivorcedFemales 27.8% Never married54.8% Now married1.9% Separated4.7% Widowed10.8% DivorcedWomen who gave birth in the past 12 months Now married:
66.1% (186)Unmarried:
33.9% (95)
Women who did not give birth in the past 12 months Now married:
45.2% (1,777)Unmarried:
54.8% (2,155)
Marital status - White alone, not Hispanic / Latino population 15 years and over
Males 34.3% Never married50.9% Now married1.4% Separated1.7% Widowed11.7% DivorcedFemales 24.0% Never married45.2% Now married1.9% Separated13.3% Widowed15.5% DivorcedWomen who gave birth in the past 12 months Now married:
67.6% (989)Unmarried:
32.4% (475)
Women who did not give birth in the past 12 months Now married:
44.6% (6,971)Unmarried:
55.4% (8,662)
Marital status - Hispanic or Latino population 15 years and over
Males 48.2% Never married39.0% Now married0.0% Separated1.7% Widowed11.1% DivorcedFemales 38.0% Never married36.8% Now married1.9% Separated6.4% Widowed16.9% DivorcedWomen who gave birth in the past 12 months Now married:
38.2% (150)Unmarried:
61.8% (243)
Women who did not give birth in the past 12 months Now married:
32.1% (1,537)Unmarried:
67.9% (3,249)
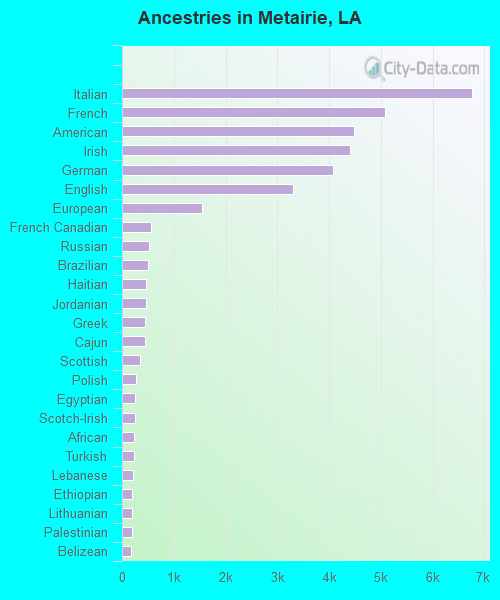
Ancestries in Metairie
6,751 10.2% Italian5,084 7.7% French4,480 6.7% American4,410 6.6% Irish4,078 6.1% German3,310 5.0% English1,552 2.3% European563 0.8% French Canadian515 0.8% Russian498 0.8% Brazilian455 0.7% Haitian454 0.7% Jordanian450 0.7% Greek440 0.7% Cajun346 0.5% Scottish278 0.4% Polish253 0.4% Egyptian246 0.4% Scotch-Irish228 0.3% African226 0.3% Turkish220 0.3% Lebanese201 0.3% Ethiopian194 0.3% Lithuanian189 0.3% Palestinian183 0.3% Belizean182 0.3% Romanian164 0.2% Arab162 0.2% Eastern European155 0.2% British155 0.2% Hungarian134 0.2% Norwegian113 0.2% Dutch107 0.2% Iraqi99 0.1% Scandinavian89 0.1% Croatian79 0.1% Swedish65 0.10% Northern European51 0.08% Ukrainian41 0.06% Austrian41 0.06% Czech38 0.06% Yugoslavian34 0.05% Danish30 0.05% Trinidadian and Tobagonian29 0.04% Portuguese28 0.04% Canadian26 0.04% Welsh23 0.03% Syrian23 0.03% South African23 0.03% Cape Verdean22 0.03% Moroccan19 0.03% Basque18 0.03% Slavic16 0.02% Nigerian14 0.02% Belgian12 0.02% Kenyan11 0.02% Iranian8 0.01% Serbian7 0.01% Slovak5 0.01% Guyanese5 0.01% West Indian4 0.01% Armenian
Geographical mobility in Metairie Same house 1 year ago 88,519 91.0% White (Caucasian)12,259 83.2% Black or African American610 90.5% American Indian / Alaska Native4,800 84.0% Asian17 100.0% Native Hawaiian / Pacific Islander3,742 83.1% Other race12,147 72.7% Two or more races84,918 90.8% White alone, not Hispanic / Latino17,052 82.9% Hispanic or LatinoMoved within same county 4,860 5.0% White / Caucasian766 5.2% Black or African American7 1.1% American Indian / Alaska Native147 2.6% Asian92 2.0% Other race3,720 22.3% Two or more races4,797 5.1% White alone, not Hispanic / Latino2,101 10.2% Hispanic or LatinoMoved within same state 2,507 2.6% White / Caucasian890 6.0% Black or African American10 1.5% American Indian / Alaska Native189 3.3% Asian231 5.1% Other race396 2.4% Two or more races2,507 2.7% White alone, not Hispanic / Latino401 1.9% Hispanic or LatinoMoved from different state 776 0.8% White / Caucasian192 1.3% Black or African American20 3.0% American Indian / Alaska Native452 7.9% Asian251 5.6% Other race21 0.1% Two or more races776 0.8% White alone, not Hispanic / Latino427 2.1% Hispanic or LatinoMoved from abroad 595 0.6% White33 0.2% Black or African American16 2.3% American Indian / Alaska Native277 4.8% Asian188 4.2% Other race422 2.5% Two or more races503 0.5% White alone, not Hispanic / Latino591 2.9% Hispanic or Latino
Children Nativity (place of birth) in Metairie
Children under 6 years - Living with two parents Both parents native 6,023 100.0% NativeBoth parents foreign-born 1,513 89.5% Native178 10.5% Foreign-bornOne native, one foreign-born parent 253 100.0% NativeChildren under 6 years - Living with one parent Native parent 1,576 100.0% NativeForeign-born parent 1,197 83.5% Native237 16.5% Foreign-bornChildren 6 to 17 years - Living with two parents Both parents native 9,403 100.0% NativeBoth parents foreign-born 743 67.4% Native359 32.6% Foreign-bornOne native, one foreign-born parent 1,115 88.1% Native151 11.9% Foreign-bornChildren 6 to 17 years - Living with one parent Native parent 5,061 100.0% NativeForeign-born parent 1,385 57.2% Native1,038 42.8% Foreign-born
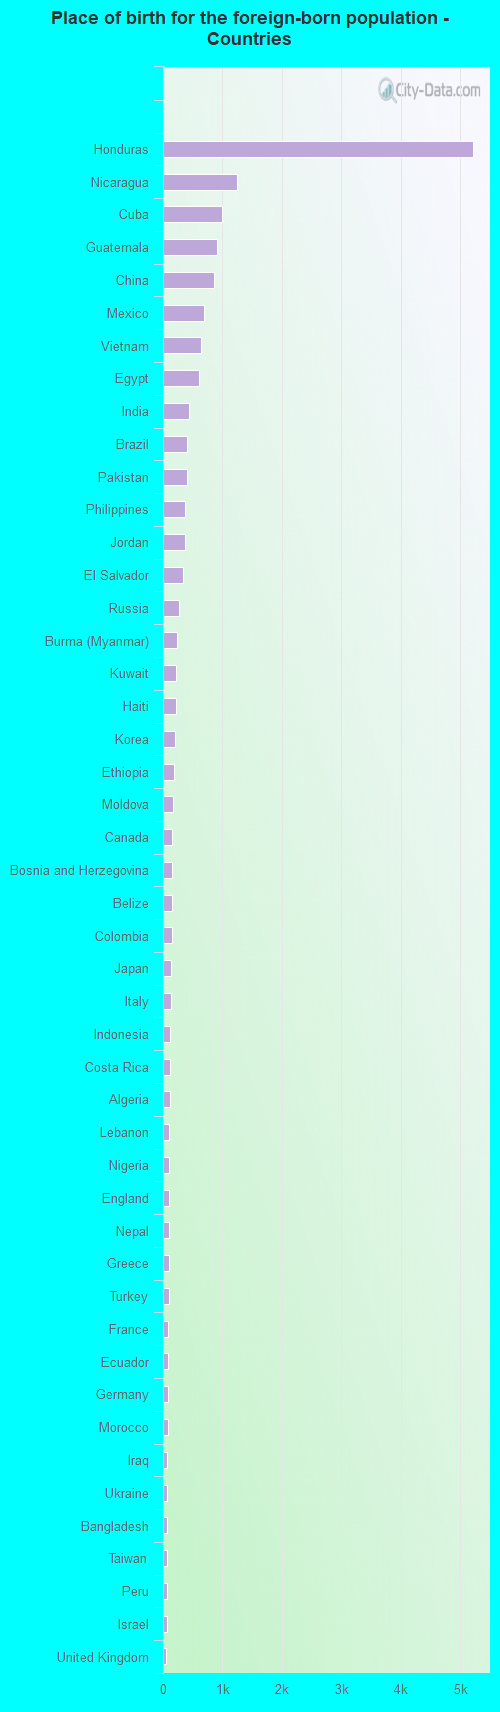
Place of birth for residents in Metairie 11,541 Americas11,382 Latin America9,212 Central America4,854 Asia1,486 Europe1,435 South Eastern Asia1,367 Africa1,319 Caribbean1,289 Eastern Asia1,065 South Central Asia1,015 Western Asia949 China849 South America848 Northern Africa802 Eastern Europe306 Western Africa246 Western Europe245 Southern Europe190 Northern Europe187 Eastern Africa159 Northern America19 Middle Africa5 Southern Africa5 Oceania5,220 Honduras1,252 Nicaragua996 Cuba900 Guatemala859 China695 Mexico647 Vietnam598 Egypt437 India403 Brazil396 Pakistan378 Philippines362 Jordan333 El Salvador262 Russia235 Burma (Myanmar)223 Kuwait220 Haiti198 Korea187 Ethiopia160 Moldova159 Canada158 Bosnia and Herzegovina148 Belize144 Colombia140 Japan131 Italy124 Indonesia119 Costa Rica113 Algeria106 Lebanon105 Nigeria103 England98 Nepal97 Greece95 Turkey92 France87 Ecuador85 Germany77 Morocco75 Iraq75 Ukraine73 Bangladesh69 Taiwan69 Peru65 Israel49 United Kingdom45 Venezuela44 Panama42 Poland39 Netherlands37 Trinidad and Tobago36 Dominican Republic35 Syria34 Bolivia28 Hungary28 Bahamas25 Romania21 Ireland20 Hong Kong19 Congo19 Belgium17 Albania16 Spain16 Norway16 Malaysia16 Cambodia16 Thailand14 United Arab Emirates13 Iran11 Lithuania11 Saudi Arabia10 Sri Lanka9 Belarus9 Austria9 Uruguay8 Bulgaria5 South Africa5 Marshall Islands5 Chile4 Croatia
Grandparents responsible for own grandchildren in Metairie
Grandparents (30 to 59 years) White / Caucasian 248 35.3% Responsible for grandchildren455 64.7% Not responsible for grandchildrenBlack or African American 7 4.3% Responsible for grandchildren157 95.7% Not responsible for grandchildrenOther race 11 100.0% Not responsible for grandchildrenTwo or more races 19 43.6% Responsible for grandchildren24 56.4% Not responsible for grandchildrenWhite alone, not Hispanic / Latino 294 43.8% Responsible for grandchildren378 56.2% Not responsible for grandchildrenHispanic or Latino 25 10.7% Responsible for grandchildren212 89.3% Not responsible for grandchildrenGrandparents (60 years and over) White / Caucasian 292 35.5% Responsible for grandchildren530 64.5% Not responsible for grandchildrenBlack or African American 43 22.6% Responsible for grandchildren146 77.4% Not responsible for grandchildrenOther race 37 100.0% Not responsible for grandchildrenTwo or more races 31 26.0% Responsible for grandchildren88 74.0% Not responsible for grandchildrenWhite alone, not Hispanic / Latino 309 39.2% Responsible for grandchildren479 60.8% Not responsible for grandchildrenHispanic or Latino 23 10.0% Responsible for grandchildren202 90.0% Not responsible for grandchildren