Races in Murphy, Texas (TX) Detailed Stats
Data:
Races - White alone (%)
Races - White alone (% change since 2000)
Races - Black alone (%)
Races - Black alone (% change since 2000)
Races - American Indian alone (%)
Races - American Indian alone (% change since 2000)
Races - Asian alone (%)
Races - Asian alone (% change since 2000)
Races - Hispanic (%)
Races - Hispanic (% change since 2000)
Races - Native Hawaiian and Other Pacific Islander alone (%)
Races - Native Hawaiian and Other Pacific Islander alone (% change since 2000)
Races - Two or more races(%)
Races - Two or more races(% change since 2000)
Races - Other race alone (%)
Races - Other race alone (% change since 2000)
Racial diversity
Place of birth - Born in state of residence (%)
Place of birth - Born in state of residence (%) - White
Place of birth - Born in state of residence (%) - Black or African American
Place of birth - Born in state of residence (%) - Asian
Place of birth - Born in state of residence (%) - Hispanic or Latino
Place of birth - Born in state of residence (%) - American Indian and Alaska Native
Place of birth - Born in state of residence (%) - Multirace
Place of birth - Born in state of residence (%) - Other Race
Place of birth - Born in other state (%)
Place of birth - Born in other state (%) - White
Place of birth - Born in other state (%) - Black or African American
Place of birth - Born in other state (%) - Asian
Place of birth - Born in other state (%) - Hispanic or Latino
Place of birth - Born in other state (%) - American Indian and Alaska Native
Place of birth - Born in other state (%) - Multirace
Place of birth - Born in other state (%) - Other Race
Place of birth - Native, outside of US (%)
Place of birth - Native, outside of US (%) - White
Place of birth - Native, outside of US (%) - Black or African American
Place of birth - Native, outside of US (%) - Asian
Place of birth - Native, outside of US (%) - Hispanic or Latino
Place of birth - Native, outside of US (%) - American Indian and Alaska Native
Place of birth - Native, outside of US (%) - Multirace
Place of birth - Native, outside of US (%) - Other Race
Place of birth - Foreign born (%)
Place of birth - Foreign born (%) - White
Place of birth - Foreign born (%) - Black or African American
Place of birth - Foreign born (%) - Asian
Place of birth - Foreign born (%) - Hispanic or Latino
Place of birth - Foreign born (%) - American Indian and Alaska Native
Place of birth - Foreign born (%) - Multirace
Place of birth - Foreign born (%) - Other Race
Residents speaking English at home (%)
Residents speaking English at home - Born in the United States (%)
Residents speaking English at home - Native, born elsewhere (%)
Residents speaking English at home - Foreign born (%)
Residents speaking Spanish at home (%)
Residents speaking Spanish at home - Born in the United States (%)
Residents speaking Spanish at home - Native, born elsewhere (%)
Residents speaking Spanish at home - Foreign born (%)
Residents speaking other language at home (%)
Residents speaking other language at home - Born in the United States (%)
Residents speaking other language at home - Native, born elsewhere (%)
Residents speaking other language at home - Foreign born (%)
Marital status - Never married (%)
Marital status - Now married (%)
Marital status - Separated (%)
Marital status - Widowed (%)
Marital status - Divorced (%)
Ancestries Reported - Arab (%)
Ancestries Reported - Czech (%)
Ancestries Reported - Danish (%)
Ancestries Reported - Dutch (%)
Ancestries Reported - English (%)
Ancestries Reported - French (%)
Ancestries Reported - French Canadian (%)
Ancestries Reported - German (%)
Ancestries Reported - Greek (%)
Ancestries Reported - Hungarian (%)
Ancestries Reported - Irish (%)
Ancestries Reported - Italian (%)
Ancestries Reported - Lithuanian (%)
Ancestries Reported - Norwegian (%)
Ancestries Reported - Polish (%)
Ancestries Reported - Portuguese (%)
Ancestries Reported - Russian (%)
Ancestries Reported - Scotch-Irish (%)
Ancestries Reported - Scottish (%)
Ancestries Reported - Slovak (%)
Ancestries Reported - Subsaharan African (%)
Ancestries Reported - Swedish (%)
Ancestries Reported - Swiss (%)
Ancestries Reported - Ukrainian (%)
Ancestries Reported - United States (%)
Ancestries Reported - Welsh (%)
Ancestries Reported - West Indian (%)
Ancestries Reported - Other (%)
Geographical mobility - Same house 1 year ago (%)
Geographical mobility - Same house 1 year ago (%) - White
Geographical mobility - Same house 1 year ago (%) - Black or African American
Geographical mobility - Same house 1 year ago (%) - Asian
Geographical mobility - Same house 1 year ago (%) - Hispanic or Latino
Geographical mobility - Same house 1 year ago (%) - American Indian and Alaska Native
Geographical mobility - Same house 1 year ago (%) - Multirace
Geographical mobility - Same house 1 year ago (%) - Other Race
Geographical mobility - Moved within same county (%)
Geographical mobility - Moved within same county (%) - White
Geographical mobility - Moved within same county (%) - Black or African American
Geographical mobility - Moved within same county (%) - Asian
Geographical mobility - Moved within same county (%) - Hispanic or Latino
Geographical mobility - Moved within same county (%) - American Indian and Alaska Native
Geographical mobility - Moved within same county (%) - Multirace
Geographical mobility - Moved within same county (%) - Other Race
Geographical mobility - Moved from different county within same state (%)
Geographical mobility - Moved from different county within same state (%) - White
Geographical mobility - Moved from different county within same state (%) - Black or African American
Geographical mobility - Moved from different county within same state (%) - Asian
Geographical mobility - Moved from different county within same state (%) - Hispanic or Latino
Geographical mobility - Moved from different county within same state (%) - American Indian and Alaska Native
Geographical mobility - Moved from different county within same state (%) - Multirace
Geographical mobility - Moved from different county within same state (%) - Other Race
Geographical mobility - Moved from different state (%)
Geographical mobility - Moved from different state (%) - White
Geographical mobility - Moved from different state (%) - Black or African American
Geographical mobility - Moved from different state (%) - Asian
Geographical mobility - Moved from different state (%) - Hispanic or Latino
Geographical mobility - Moved from different state (%) - American Indian and Alaska Native
Geographical mobility - Moved from different state (%) - Multirace
Geographical mobility - Moved from different state (%) - Other Race
Geographical mobility - Moved from abroad (%)
Geographical mobility - Moved from abroad (%) - White
Geographical mobility - Moved from abroad (%) - Black or African American
Geographical mobility - Moved from abroad (%) - Asian
Geographical mobility - Moved from abroad (%) - Hispanic or Latino
Geographical mobility - Moved from abroad (%) - American Indian and Alaska Native
Geographical mobility - Moved from abroad (%) - Multirace
Geographical mobility - Moved from abroad (%) - Other Race
Place of birth for the foreign-born population - Ireland (%)
Place of birth for the foreign-born population - Denmark (%)
Place of birth for the foreign-born population - Norway (%)
Place of birth for the foreign-born population - Sweden (%)
Place of birth for the foreign-born population - United Kingdom (%)
Place of birth for the foreign-born population - England (%)
Place of birth for the foreign-born population - Scotland (%)
Place of birth for the foreign-born population - Other Northern Europe (%)
Place of birth for the foreign-born population - Austria (%)
Place of birth for the foreign-born population - Belgium (%)
Place of birth for the foreign-born population - France (%)
Place of birth for the foreign-born population - Germany (%)
Place of birth for the foreign-born population - Netherlands (%)
Place of birth for the foreign-born population - Switzerland (%)
Place of birth for the foreign-born population - Other Western Europe (%)
Place of birth for the foreign-born population - Greece (%)
Place of birth for the foreign-born population - Italy (%)
Place of birth for the foreign-born population - Portugal (%)
Place of birth for the foreign-born population - Spain (%)
Place of birth for the foreign-born population - Other Southern Europe (%)
Place of birth for the foreign-born population - Albania (%)
Place of birth for the foreign-born population - Belarus (%)
Place of birth for the foreign-born population - Bosnia and Herzegovina (%)
Place of birth for the foreign-born population - Bulgaria (%)
Place of birth for the foreign-born population - Croatia (%)
Place of birth for the foreign-born population - Czechoslovakia (%)
Place of birth for the foreign-born population - Hungary (%)
Place of birth for the foreign-born population - Latvia (%)
Place of birth for the foreign-born population - Lithuania (%)
Place of birth for the foreign-born population - North Macedonia (Macedonia) (%)
Place of birth for the foreign-born population - Moldova (%)
Place of birth for the foreign-born population - Poland (%)
Place of birth for the foreign-born population - Romania (%)
Place of birth for the foreign-born population - Russia (%)
Place of birth for the foreign-born population - Serbia (%)
Place of birth for the foreign-born population - Ukraine (%)
Place of birth for the foreign-born population - Other Eastern Europe (%)
Place of birth for the foreign-born population - China (%)
Place of birth for the foreign-born population - Hong Kong (%)
Place of birth for the foreign-born population - Taiwan (%)
Place of birth for the foreign-born population - Japan (%)
Place of birth for the foreign-born population - Korea (%)
Place of birth for the foreign-born population - Other Eastern Asia (%)
Place of birth for the foreign-born population - Afghanistan (%)
Place of birth for the foreign-born population - Bangladesh (%)
Place of birth for the foreign-born population - India (%)
Place of birth for the foreign-born population - Iran (%)
Place of birth for the foreign-born population - Kazakhstan (%)
Place of birth for the foreign-born population - Nepal (%)
Place of birth for the foreign-born population - Pakistan (%)
Place of birth for the foreign-born population - Sri Lanka (%)
Place of birth for the foreign-born population - Uzbekistan (%)
Place of birth for the foreign-born population - Other South Central Asia (%)
Place of birth for the foreign-born population - Burma (%)
Place of birth for the foreign-born population - Cambodia (%)
Place of birth for the foreign-born population - Indonesia (%)
Place of birth for the foreign-born population - Laos (%)
Place of birth for the foreign-born population - Malaysia (%)
Place of birth for the foreign-born population - Philippines (%)
Place of birth for the foreign-born population - Singapore (%)
Place of birth for the foreign-born population - Thailand (%)
Place of birth for the foreign-born population - Vietnam (%)
Place of birth for the foreign-born population - Other South Eastern Asia (%)
Place of birth for the foreign-born population - Armenia (%)
Place of birth for the foreign-born population - Iraq (%)
Place of birth for the foreign-born population - Israel (%)
Place of birth for the foreign-born population - Jordan (%)
Place of birth for the foreign-born population - Kuwait (%)
Place of birth for the foreign-born population - Lebanon (%)
Place of birth for the foreign-born population - Saudi Arabia (%)
Place of birth for the foreign-born population - Syria (%)
Place of birth for the foreign-born population - Turkey (%)
Place of birth for the foreign-born population - Yemen (%)
Place of birth for the foreign-born population - Other Western Asia (%)
Place of birth for the foreign-born population - Eritrea (%)
Place of birth for the foreign-born population - Ethiopia (%)
Place of birth for the foreign-born population - Kenya (%)
Place of birth for the foreign-born population - Somalia (%)
Place of birth for the foreign-born population - Uganda (%)
Place of birth for the foreign-born population - Zimbabwe (%)
Place of birth for the foreign-born population - Other Eastern Africa (%)
Place of birth for the foreign-born population - Cameroon (%)
Place of birth for the foreign-born population - Congo (%)
Place of birth for the foreign-born population - Democratic Republic of Congo (Zaire) (%)
Place of birth for the foreign-born population - Other Middle Africa (%)
Place of birth for the foreign-born population - Egypt (%)
Place of birth for the foreign-born population - Morocco (%)
Place of birth for the foreign-born population - Sudan (%)
Place of birth for the foreign-born population - Other Northern Africa (%)
Place of birth for the foreign-born population - South Africa (%)
Place of birth for the foreign-born population - Other Southern Africa (%)
Place of birth for the foreign-born population - Cabo Verde (%)
Place of birth for the foreign-born population - Ghana (%)
Place of birth for the foreign-born population - Liberia (%)
Place of birth for the foreign-born population - Nigeria (%)
Place of birth for the foreign-born population - Senegal (%)
Place of birth for the foreign-born population - Sierra Leone (%)
Place of birth for the foreign-born population - Other Western Africa (%)
Place of birth for the foreign-born population - Australia (%)
Place of birth for the foreign-born population - New Zealand (%)
Place of birth for the foreign-born population - Fiji (%)
Place of birth for the foreign-born population - Micronesia (%)
Place of birth for the foreign-born population - Bahamas (%)
Place of birth for the foreign-born population - Barbados (%)
Place of birth for the foreign-born population - Cuba (%)
Place of birth for the foreign-born population - Dominica (%)
Place of birth for the foreign-born population - Dominican Republic (%)
Place of birth for the foreign-born population - Grenada (%)
Place of birth for the foreign-born population - Haiti (%)
Place of birth for the foreign-born population - Jamaica (%)
Place of birth for the foreign-born population - St. Vincent and the Grenadines (%)
Place of birth for the foreign-born population - Trinidad and Tobago (%)
Place of birth for the foreign-born population - West Indies (%)
Place of birth for the foreign-born population - Other Caribbean (%)
Place of birth for the foreign-born population - Belize (%)
Place of birth for the foreign-born population - Costa Rica (%)
Place of birth for the foreign-born population - El Salvador (%)
Place of birth for the foreign-born population - Guatemala (%)
Place of birth for the foreign-born population - Honduras (%)
Place of birth for the foreign-born population - Mexico (%)
Place of birth for the foreign-born population - Nicaragua (%)
Place of birth for the foreign-born population - Panama (%)
Place of birth for the foreign-born population - Other Central America (%)
Place of birth for the foreign-born population - Argentina (%)
Place of birth for the foreign-born population - Bolivia (%)
Place of birth for the foreign-born population - Brazil (%)
Place of birth for the foreign-born population - Chile (%)
Place of birth for the foreign-born population - Colombia (%)
Place of birth for the foreign-born population - Ecuador (%)
Place of birth for the foreign-born population - Guyana (%)
Place of birth for the foreign-born population - Peru (%)
Place of birth for the foreign-born population - Uruguay (%)
Place of birth for the foreign-born population - Venezuela (%)
Place of birth for the foreign-born population - Other South America (%)
Place of birth for the foreign-born population - Canada (%)
Place of birth for the foreign-born population - Other Northern America (%)
Place of birth for the foreign-born population - Other (%)
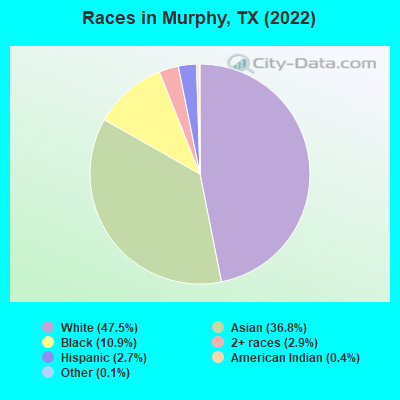
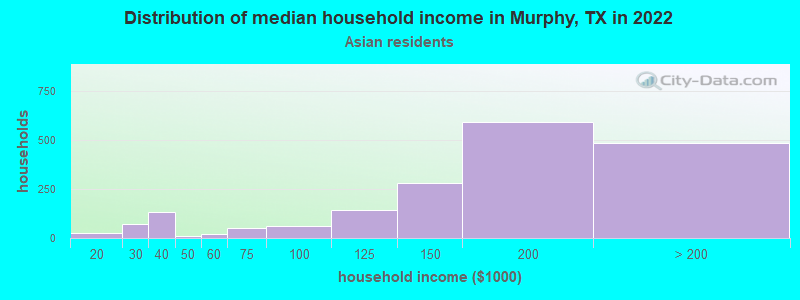
According to 2022 data, the most numerous races in Murphy, TX are Hispanic (612 residents), White alone (10,649 residents), and Black alone (2,437 residents). 65.1% of Murphy residents speak English at home. 23.9% of Murphy, TX residents are foreign-born (20.5% born in Asia), which is 28.9% greater than the foreign-born rate of 17.0% across the entire state of Texas.
Race distribution in Murphy
2000 2022
10,933,313 52.4% White alone 6,669,666 32.0% Hispanic 2,364,255 11.3% Black alone 554,445 2.7% Asian alone 230,567 1.1% Two or more races 68,859 0.3% American Indian alone 19,958 0.10% Other race alone 10,757 0.05% Native Hawaiian and Other
12,070,642 40.2% Hispanic 11,683,430 38.9% White alone 3,508,706 11.7% Black alone 1,608,173 5.4% Asian alone 956,560 3.2% Two or more races 125,763 0.4% Other race alone 47,023 0.2% American Indian alone 29,275 0.10% Native Hawaiian and Other
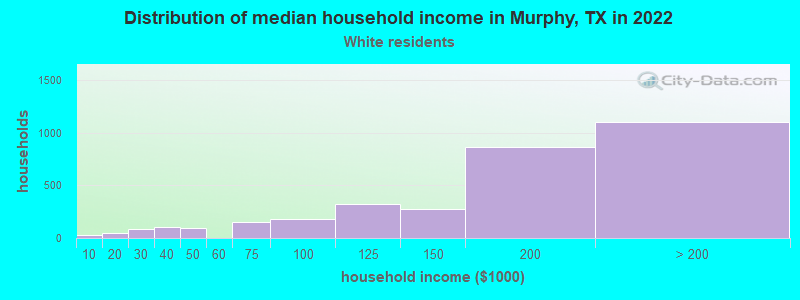
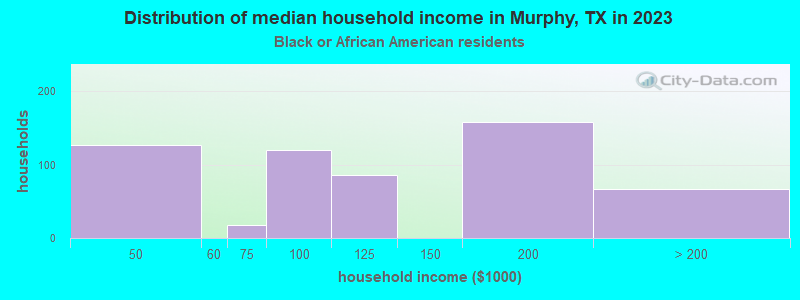
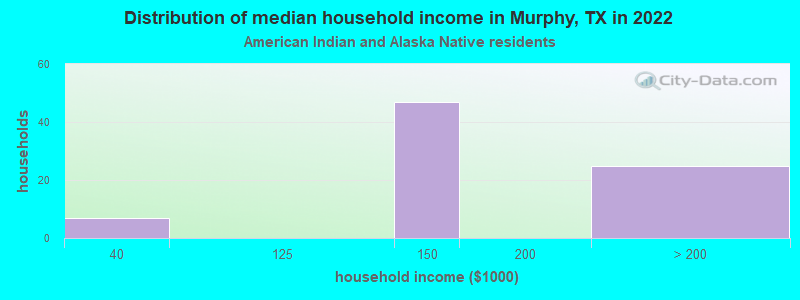
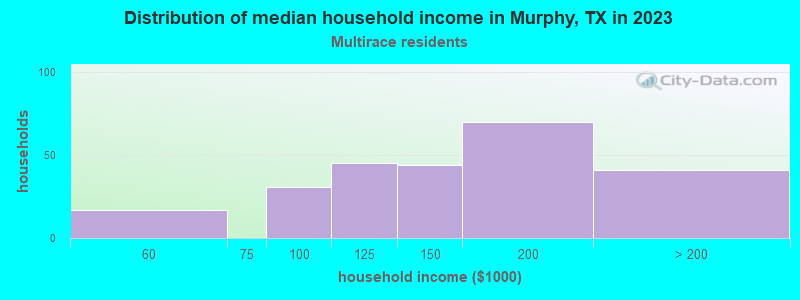
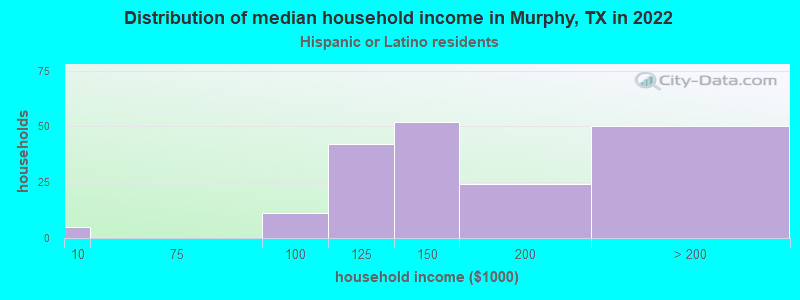
Income and house value in Murphy Median household income in 2022 $156,925 White non-Hispanic householders$84,320 Black householders$84,171 American Indian and Alaska Native householders$160,073 Asian householdersover $200,000 Some other race householders$169,495 Two or more races householders$139,849 Hispanic or Latino race householdersMedian 2022 house value $520,543 White Non-Hispanic householders$579,738 Black or African American householders$574,100 American Indian or Alaska Native householders $572,847 Asian householders$499,245 Some other race householders$534,950 Two or more races householders$545,286 Hispanic or Latino householders
Median age by race in Murphy
41.6 Median age for White residents40.5 42.1 42.2 Median age for Black or African American residents17.2 42.3 57.7 Median age for American Indian / Alaska Native residents77.3 17.5 38.8 Median age for Asian residents45.5 36.3 -819,226,749.4 Median age for Native Hawaiian / Pacific Islander residents-770,894,787.8 -577,777,777.2 21.4 Median age for Other race residents35.4 17.8 18.7 Median age for Two or more races residents21.1 17.4 41.0 Median age for White alone residents40.1 41.4 25.7 Median age for Hispanic or Latino residents23.6 30.9
Owner/renter occupied households by race in Murphy
House owners and renters - White residents 3,058 92.0% Owner occupied266 8.0% Renter occupiedHouse owners and renters - Black or African American residents 431 75.0% Owner occupied144 25.0% Renter occupiedHouse owners and renters - American Indian / Alaska Native residents 27 74.2% Owner occupied9 25.8% Renter occupiedHouse owners and renters - Asian residents 1,833 96.8% Owner occupied61 3.2% Renter occupiedHouse owners and renters - Other race residents 43 100.0% Owner occupiedHouse owners and renters - Two or more races residents 298 91.9% Owner occupied26 8.1% Renter occupiedHouse owners and renters - White alone residents 3,104 92.0% Owner occupied270 8.0% Renter occupiedHouse owners and renters - Hispanic or Latino residents 171 100.0% Owner occupied
Language usage in Murphy
English speakers - Total 65.1% of residents of Murphy speak English at home.
1.2% of residents speak Spanish at home 234 91.4% Speak English very well22 8.6% Speak English less than very well34.9% of residents speak other language at home 5,214 69.2% Speak English very well2,317 30.8% Speak English less than very well
English speakers - Born in the United States 83.3% of residents of Murphy speak English at home.
1.2% of residents speak Spanish at home 48 71.6% Speak English very well19 28.4% Speak English less than very well17.0% of residents speak other language at home 932 94.1% Speak English very well58 5.9% Speak English less than very well
English speakers - Native, born elsewhere 22.9% of residents of Murphy speak English at home.
4.2% of residents speak Spanish at home 17 100.0% Speak English very well52.6% of residents speak other language at home 211 100.0% Speak English very well
English speakers - Foreign-born 9.3% of residents of Murphy speak English at home.
0.6% of residents speak Spanish at home 25 75.8% Speak English very well8 24.2% Speak English less than very well90.5% of residents speak other language at home 3,023 58.6% Speak English very well2,134 41.4% Speak English less than very well
White (Caucasian) - Speak only English Native:
97.4% (9,631)Foreign-born:
53.9% (157)
White (Caucasian) - Speak another language Native:
3.2% (317)Foreign-born:
50.8% (148)
Black or African American - Speak only English Native:
100.0% (1,819)Foreign-born:
5.9% (27)
Asian - Speak only English Native:
37.9% (1,233)Foreign-born:
6.6% (319)
Asian - Speak another language Native:
62.6% (2,035)Foreign-born:
92.6% (4,497)
Other race - Speak another language Native:
35.6% (53)Foreign-born:
100.0% (12)
Two or more races - Speak only English Native:
64.7% (538)Foreign-born:
19.1% (55)
Two or more races - Speak another language Native:
35.5% (296)Foreign-born:
80.5% (233)
White alone - Speak only English Native:
97.0% (9,670)Foreign-born:
44.2% (152)
White alone - Speak another language Native:
3.0% (300)Foreign-born:
54.0% (186)
Hispanic or Latino - Speak only English Native:
62.8% (335)Foreign-born:
23.3% (9)
Hispanic or Latino - Speak another language Native:
39.0% (208)Foreign-born:
80.2% (32)
Foreign-born residents in Murphy 5,363 residents are foreign born (20.5% Asia ).
This city:
23.9%Texas:
17.1%
Marital status for residents in Murphy Marital status - White (Caucasian) population 15 years and over
Males 28.1% Never married67.0% Now married0.0% Separated2.1% Widowed2.8% DivorcedFemales 24.0% Never married62.2% Now married0.0% Separated4.4% Widowed9.4% DivorcedWomen who gave birth in the past 12 months Now married:
100.0% (21)Unmarried:
0.0% (0)
Women who did not give birth in the past 12 months Now married:
56.1% (1,443)Unmarried:
43.9% (1,129)
Marital status - Black or African American population 15 years and over
Males 38.1% Never married58.5% Now married0.0% Separated0.0% Widowed3.4% DivorcedFemales 47.1% Never married31.4% Now married2.5% Separated2.4% Widowed16.5% DivorcedWomen who did not give birth in the past 12 months Now married:
21.2% (180)Unmarried:
78.8% (668)
Marital status - American Indian / Alaska Native population 15 years and over
Males 10.0% Never married90.0% Now married0.0% Separated0.0% Widowed0.0% DivorcedFemales 75.9% Never married24.1% Now married0.0% Separated0.0% Widowed0.0% DivorcedWomen who did not give birth in the past 12 months Now married:
0.0% (0)Unmarried:
100.0% (59)
Marital status - Asian population 15 years and over
Males 28.5% Never married60.8% Now married0.0% Separated9.3% Widowed1.5% DivorcedFemales 29.3% Never married64.6% Now married0.9% Separated4.0% Widowed1.2% DivorcedWomen who gave birth in the past 12 months Now married:
100.0% (119)Unmarried:
0.0% (0)
Women who did not give birth in the past 12 months Now married:
64.0% (1,252)Unmarried:
36.0% (703)
Marital status - Other race population 15 years and over
Males 37.5% Never married62.5% Now married0.0% Separated0.0% Widowed0.0% DivorcedFemales 50.0% Never married25.0% Now married0.0% Separated25.0% Widowed0.0% DivorcedWomen who did not give birth in the past 12 months Now married:
25.0% (6)Unmarried:
75.0% (18)
Marital status - Two or more races population 15 years and over
Males 23.2% Never married73.6% Now married0.0% Separated0.0% Widowed3.2% DivorcedFemales 26.0% Never married69.3% Now married0.0% Separated0.0% Widowed4.7% DivorcedWomen who gave birth in the past 12 months Now married:
28.6% (5)Unmarried:
71.4% (13)
Women who did not give birth in the past 12 months Now married:
61.1% (115)Unmarried:
38.9% (73)
Marital status - White alone, not Hispanic / Latino population 15 years and over
Males 27.9% Never married67.2% Now married0.0% Separated2.1% Widowed2.8% DivorcedFemales 23.9% Never married62.4% Now married0.0% Separated4.3% Widowed9.5% DivorcedWomen who gave birth in the past 12 months Now married:
100.0% (21)Unmarried:
0.0% (0)
Women who did not give birth in the past 12 months Now married:
56.2% (1,477)Unmarried:
43.8% (1,150)
Marital status - Hispanic or Latino population 15 years and over
Males 41.1% Never married55.1% Now married0.0% Separated0.0% Widowed3.8% DivorcedFemales 28.2% Never married62.1% Now married0.0% Separated9.8% Widowed0.0% DivorcedWomen who gave birth in the past 12 months Now married:
100.0% (4)Unmarried:
0.0% (0)
Women who did not give birth in the past 12 months Now married:
42.7% (45)Unmarried:
57.3% (60)
Ancestries in Murphy
1,143 9.3% English1,141 9.2% American788 6.4% Irish470 3.8% European413 3.3% German203 1.6% Iranian161 1.3% Lebanese161 1.3% Scottish144 1.2% Romanian133 1.1% African126 1.0% Nigerian116 0.9% Ethiopian96 0.8% Dutch87 0.7% French84 0.7% Ukrainian83 0.7% Italian75 0.6% Russian71 0.6% Norwegian57 0.5% Scotch-Irish54 0.4% Welsh47 0.4% Danish43 0.3% Polish42 0.3% Portuguese39 0.3% Austrian31 0.3% Canadian22 0.2% Czech18 0.1% Scandinavian16 0.1% Eastern European15 0.1% Swiss14 0.1% Egyptian8 0.06% Syrian7 0.06% British
Geographical mobility in Murphy Same house 1 year ago 10,134 98.1% White (Caucasian)2,014 82.0% Black or African American171 100.0% American Indian / Alaska Native7,718 94.1% Asian156 100.0% Other race1,034 86.7% Two or more races10,369 97.9% White alone, not Hispanic / Latino568 100.0% Hispanic or LatinoMoved within same county 291 2.8% White / Caucasian152 6.2% Black or African American136 1.7% Asian110 9.2% Two or more races312 2.9% White alone, not Hispanic / LatinoMoved within same state 30 0.3% White / Caucasian65 2.7% Black or African American34 0.4% Asian13 1.1% Two or more races31 0.3% White alone, not Hispanic / LatinoMoved from different state 23 0.2% White / Caucasian149 6.0% Black or African American32 0.4% Asian23 0.2% White alone, not Hispanic / LatinoMoved from abroad 8 0.1% White53 0.6% Asian11 0.1% White alone, not Hispanic / Latino
Children Nativity (place of birth) in Murphy
Children under 6 years - Living with two parents Both parents native 561 100.0% NativeBoth parents foreign-born 386 100.0% NativeOne native, one foreign-born parent 52 100.0% NativeChildren under 6 years - Living with one parent Native parent 58 100.0% NativeForeign-born parent 64 100.0% NativeChildren 6 to 17 years - Living with two parents Both parents native 2,765 99.2% Native23 0.8% Foreign-bornBoth parents foreign-born 1,452 94.3% Native88 5.7% Foreign-bornOne native, one foreign-born parent 829 100.0% NativeChildren 6 to 17 years - Living with one parent Native parent 177 100.0% NativeForeign-born parent 125 51.7% Native117 48.3% Foreign-born
Grandparents responsible for own grandchildren in Murphy
Grandparents (30 to 59 years) White / Caucasian 45 100.0% Responsible for grandchildrenBlack or African American 23 100.0% Responsible for grandchildrenAsian 34 39.2% Responsible for grandchildren53 60.8% Not responsible for grandchildrenWhite alone, not Hispanic / Latino 44 100.0% Responsible for grandchildrenGrandparents (60 years and over) White / Caucasian 60 100.0% Not responsible for grandchildrenBlack or African American 56 100.0% Not responsible for grandchildrenAsian 76 18.7% Responsible for grandchildren329 81.3% Not responsible for grandchildrenWhite alone, not Hispanic / Latino 63 100.0% Not responsible for grandchildren