Races in Niles, Ohio (OH) Detailed Stats
Data:
Races - White alone (%)
Races - White alone (% change since 2000)
Races - Black alone (%)
Races - Black alone (% change since 2000)
Races - American Indian alone (%)
Races - American Indian alone (% change since 2000)
Races - Asian alone (%)
Races - Asian alone (% change since 2000)
Races - Hispanic (%)
Races - Hispanic (% change since 2000)
Races - Native Hawaiian and Other Pacific Islander alone (%)
Races - Native Hawaiian and Other Pacific Islander alone (% change since 2000)
Races - Two or more races(%)
Races - Two or more races(% change since 2000)
Races - Other race alone (%)
Races - Other race alone (% change since 2000)
Racial diversity
Place of birth - Born in state of residence (%)
Place of birth - Born in state of residence (%) - White
Place of birth - Born in state of residence (%) - Black or African American
Place of birth - Born in state of residence (%) - Asian
Place of birth - Born in state of residence (%) - Hispanic or Latino
Place of birth - Born in state of residence (%) - American Indian and Alaska Native
Place of birth - Born in state of residence (%) - Multirace
Place of birth - Born in state of residence (%) - Other Race
Place of birth - Born in other state (%)
Place of birth - Born in other state (%) - White
Place of birth - Born in other state (%) - Black or African American
Place of birth - Born in other state (%) - Asian
Place of birth - Born in other state (%) - Hispanic or Latino
Place of birth - Born in other state (%) - American Indian and Alaska Native
Place of birth - Born in other state (%) - Multirace
Place of birth - Born in other state (%) - Other Race
Place of birth - Native, outside of US (%)
Place of birth - Native, outside of US (%) - White
Place of birth - Native, outside of US (%) - Black or African American
Place of birth - Native, outside of US (%) - Asian
Place of birth - Native, outside of US (%) - Hispanic or Latino
Place of birth - Native, outside of US (%) - American Indian and Alaska Native
Place of birth - Native, outside of US (%) - Multirace
Place of birth - Native, outside of US (%) - Other Race
Place of birth - Foreign born (%)
Place of birth - Foreign born (%) - White
Place of birth - Foreign born (%) - Black or African American
Place of birth - Foreign born (%) - Asian
Place of birth - Foreign born (%) - Hispanic or Latino
Place of birth - Foreign born (%) - American Indian and Alaska Native
Place of birth - Foreign born (%) - Multirace
Place of birth - Foreign born (%) - Other Race
Residents speaking English at home (%)
Residents speaking English at home - Born in the United States (%)
Residents speaking English at home - Native, born elsewhere (%)
Residents speaking English at home - Foreign born (%)
Residents speaking Spanish at home (%)
Residents speaking Spanish at home - Born in the United States (%)
Residents speaking Spanish at home - Native, born elsewhere (%)
Residents speaking Spanish at home - Foreign born (%)
Residents speaking other language at home (%)
Residents speaking other language at home - Born in the United States (%)
Residents speaking other language at home - Native, born elsewhere (%)
Residents speaking other language at home - Foreign born (%)
Marital status - Never married (%)
Marital status - Now married (%)
Marital status - Separated (%)
Marital status - Widowed (%)
Marital status - Divorced (%)
Ancestries Reported - Arab (%)
Ancestries Reported - Czech (%)
Ancestries Reported - Danish (%)
Ancestries Reported - Dutch (%)
Ancestries Reported - English (%)
Ancestries Reported - French (%)
Ancestries Reported - French Canadian (%)
Ancestries Reported - German (%)
Ancestries Reported - Greek (%)
Ancestries Reported - Hungarian (%)
Ancestries Reported - Irish (%)
Ancestries Reported - Italian (%)
Ancestries Reported - Lithuanian (%)
Ancestries Reported - Norwegian (%)
Ancestries Reported - Polish (%)
Ancestries Reported - Portuguese (%)
Ancestries Reported - Russian (%)
Ancestries Reported - Scotch-Irish (%)
Ancestries Reported - Scottish (%)
Ancestries Reported - Slovak (%)
Ancestries Reported - Subsaharan African (%)
Ancestries Reported - Swedish (%)
Ancestries Reported - Swiss (%)
Ancestries Reported - Ukrainian (%)
Ancestries Reported - United States (%)
Ancestries Reported - Welsh (%)
Ancestries Reported - West Indian (%)
Ancestries Reported - Other (%)
Geographical mobility - Same house 1 year ago (%)
Geographical mobility - Same house 1 year ago (%) - White
Geographical mobility - Same house 1 year ago (%) - Black or African American
Geographical mobility - Same house 1 year ago (%) - Asian
Geographical mobility - Same house 1 year ago (%) - Hispanic or Latino
Geographical mobility - Same house 1 year ago (%) - American Indian and Alaska Native
Geographical mobility - Same house 1 year ago (%) - Multirace
Geographical mobility - Same house 1 year ago (%) - Other Race
Geographical mobility - Moved within same county (%)
Geographical mobility - Moved within same county (%) - White
Geographical mobility - Moved within same county (%) - Black or African American
Geographical mobility - Moved within same county (%) - Asian
Geographical mobility - Moved within same county (%) - Hispanic or Latino
Geographical mobility - Moved within same county (%) - American Indian and Alaska Native
Geographical mobility - Moved within same county (%) - Multirace
Geographical mobility - Moved within same county (%) - Other Race
Geographical mobility - Moved from different county within same state (%)
Geographical mobility - Moved from different county within same state (%) - White
Geographical mobility - Moved from different county within same state (%) - Black or African American
Geographical mobility - Moved from different county within same state (%) - Asian
Geographical mobility - Moved from different county within same state (%) - Hispanic or Latino
Geographical mobility - Moved from different county within same state (%) - American Indian and Alaska Native
Geographical mobility - Moved from different county within same state (%) - Multirace
Geographical mobility - Moved from different county within same state (%) - Other Race
Geographical mobility - Moved from different state (%)
Geographical mobility - Moved from different state (%) - White
Geographical mobility - Moved from different state (%) - Black or African American
Geographical mobility - Moved from different state (%) - Asian
Geographical mobility - Moved from different state (%) - Hispanic or Latino
Geographical mobility - Moved from different state (%) - American Indian and Alaska Native
Geographical mobility - Moved from different state (%) - Multirace
Geographical mobility - Moved from different state (%) - Other Race
Geographical mobility - Moved from abroad (%)
Geographical mobility - Moved from abroad (%) - White
Geographical mobility - Moved from abroad (%) - Black or African American
Geographical mobility - Moved from abroad (%) - Asian
Geographical mobility - Moved from abroad (%) - Hispanic or Latino
Geographical mobility - Moved from abroad (%) - American Indian and Alaska Native
Geographical mobility - Moved from abroad (%) - Multirace
Geographical mobility - Moved from abroad (%) - Other Race
Place of birth for the foreign-born population - Ireland (%)
Place of birth for the foreign-born population - Denmark (%)
Place of birth for the foreign-born population - Norway (%)
Place of birth for the foreign-born population - Sweden (%)
Place of birth for the foreign-born population - United Kingdom (%)
Place of birth for the foreign-born population - England (%)
Place of birth for the foreign-born population - Scotland (%)
Place of birth for the foreign-born population - Other Northern Europe (%)
Place of birth for the foreign-born population - Austria (%)
Place of birth for the foreign-born population - Belgium (%)
Place of birth for the foreign-born population - France (%)
Place of birth for the foreign-born population - Germany (%)
Place of birth for the foreign-born population - Netherlands (%)
Place of birth for the foreign-born population - Switzerland (%)
Place of birth for the foreign-born population - Other Western Europe (%)
Place of birth for the foreign-born population - Greece (%)
Place of birth for the foreign-born population - Italy (%)
Place of birth for the foreign-born population - Portugal (%)
Place of birth for the foreign-born population - Spain (%)
Place of birth for the foreign-born population - Other Southern Europe (%)
Place of birth for the foreign-born population - Albania (%)
Place of birth for the foreign-born population - Belarus (%)
Place of birth for the foreign-born population - Bosnia and Herzegovina (%)
Place of birth for the foreign-born population - Bulgaria (%)
Place of birth for the foreign-born population - Croatia (%)
Place of birth for the foreign-born population - Czechoslovakia (%)
Place of birth for the foreign-born population - Hungary (%)
Place of birth for the foreign-born population - Latvia (%)
Place of birth for the foreign-born population - Lithuania (%)
Place of birth for the foreign-born population - North Macedonia (Macedonia) (%)
Place of birth for the foreign-born population - Moldova (%)
Place of birth for the foreign-born population - Poland (%)
Place of birth for the foreign-born population - Romania (%)
Place of birth for the foreign-born population - Russia (%)
Place of birth for the foreign-born population - Serbia (%)
Place of birth for the foreign-born population - Ukraine (%)
Place of birth for the foreign-born population - Other Eastern Europe (%)
Place of birth for the foreign-born population - China (%)
Place of birth for the foreign-born population - Hong Kong (%)
Place of birth for the foreign-born population - Taiwan (%)
Place of birth for the foreign-born population - Japan (%)
Place of birth for the foreign-born population - Korea (%)
Place of birth for the foreign-born population - Other Eastern Asia (%)
Place of birth for the foreign-born population - Afghanistan (%)
Place of birth for the foreign-born population - Bangladesh (%)
Place of birth for the foreign-born population - India (%)
Place of birth for the foreign-born population - Iran (%)
Place of birth for the foreign-born population - Kazakhstan (%)
Place of birth for the foreign-born population - Nepal (%)
Place of birth for the foreign-born population - Pakistan (%)
Place of birth for the foreign-born population - Sri Lanka (%)
Place of birth for the foreign-born population - Uzbekistan (%)
Place of birth for the foreign-born population - Other South Central Asia (%)
Place of birth for the foreign-born population - Burma (%)
Place of birth for the foreign-born population - Cambodia (%)
Place of birth for the foreign-born population - Indonesia (%)
Place of birth for the foreign-born population - Laos (%)
Place of birth for the foreign-born population - Malaysia (%)
Place of birth for the foreign-born population - Philippines (%)
Place of birth for the foreign-born population - Singapore (%)
Place of birth for the foreign-born population - Thailand (%)
Place of birth for the foreign-born population - Vietnam (%)
Place of birth for the foreign-born population - Other South Eastern Asia (%)
Place of birth for the foreign-born population - Armenia (%)
Place of birth for the foreign-born population - Iraq (%)
Place of birth for the foreign-born population - Israel (%)
Place of birth for the foreign-born population - Jordan (%)
Place of birth for the foreign-born population - Kuwait (%)
Place of birth for the foreign-born population - Lebanon (%)
Place of birth for the foreign-born population - Saudi Arabia (%)
Place of birth for the foreign-born population - Syria (%)
Place of birth for the foreign-born population - Turkey (%)
Place of birth for the foreign-born population - Yemen (%)
Place of birth for the foreign-born population - Other Western Asia (%)
Place of birth for the foreign-born population - Eritrea (%)
Place of birth for the foreign-born population - Ethiopia (%)
Place of birth for the foreign-born population - Kenya (%)
Place of birth for the foreign-born population - Somalia (%)
Place of birth for the foreign-born population - Uganda (%)
Place of birth for the foreign-born population - Zimbabwe (%)
Place of birth for the foreign-born population - Other Eastern Africa (%)
Place of birth for the foreign-born population - Cameroon (%)
Place of birth for the foreign-born population - Congo (%)
Place of birth for the foreign-born population - Democratic Republic of Congo (Zaire) (%)
Place of birth for the foreign-born population - Other Middle Africa (%)
Place of birth for the foreign-born population - Egypt (%)
Place of birth for the foreign-born population - Morocco (%)
Place of birth for the foreign-born population - Sudan (%)
Place of birth for the foreign-born population - Other Northern Africa (%)
Place of birth for the foreign-born population - South Africa (%)
Place of birth for the foreign-born population - Other Southern Africa (%)
Place of birth for the foreign-born population - Cabo Verde (%)
Place of birth for the foreign-born population - Ghana (%)
Place of birth for the foreign-born population - Liberia (%)
Place of birth for the foreign-born population - Nigeria (%)
Place of birth for the foreign-born population - Senegal (%)
Place of birth for the foreign-born population - Sierra Leone (%)
Place of birth for the foreign-born population - Other Western Africa (%)
Place of birth for the foreign-born population - Australia (%)
Place of birth for the foreign-born population - New Zealand (%)
Place of birth for the foreign-born population - Fiji (%)
Place of birth for the foreign-born population - Micronesia (%)
Place of birth for the foreign-born population - Bahamas (%)
Place of birth for the foreign-born population - Barbados (%)
Place of birth for the foreign-born population - Cuba (%)
Place of birth for the foreign-born population - Dominica (%)
Place of birth for the foreign-born population - Dominican Republic (%)
Place of birth for the foreign-born population - Grenada (%)
Place of birth for the foreign-born population - Haiti (%)
Place of birth for the foreign-born population - Jamaica (%)
Place of birth for the foreign-born population - St. Vincent and the Grenadines (%)
Place of birth for the foreign-born population - Trinidad and Tobago (%)
Place of birth for the foreign-born population - West Indies (%)
Place of birth for the foreign-born population - Other Caribbean (%)
Place of birth for the foreign-born population - Belize (%)
Place of birth for the foreign-born population - Costa Rica (%)
Place of birth for the foreign-born population - El Salvador (%)
Place of birth for the foreign-born population - Guatemala (%)
Place of birth for the foreign-born population - Honduras (%)
Place of birth for the foreign-born population - Mexico (%)
Place of birth for the foreign-born population - Nicaragua (%)
Place of birth for the foreign-born population - Panama (%)
Place of birth for the foreign-born population - Other Central America (%)
Place of birth for the foreign-born population - Argentina (%)
Place of birth for the foreign-born population - Bolivia (%)
Place of birth for the foreign-born population - Brazil (%)
Place of birth for the foreign-born population - Chile (%)
Place of birth for the foreign-born population - Colombia (%)
Place of birth for the foreign-born population - Ecuador (%)
Place of birth for the foreign-born population - Guyana (%)
Place of birth for the foreign-born population - Peru (%)
Place of birth for the foreign-born population - Uruguay (%)
Place of birth for the foreign-born population - Venezuela (%)
Place of birth for the foreign-born population - Other South America (%)
Place of birth for the foreign-born population - Canada (%)
Place of birth for the foreign-born population - Other Northern America (%)
Place of birth for the foreign-born population - Other (%)
Latest news about races in Niles, OH collected exclusively by city-data.com from local newspapers, TV, and radio stations
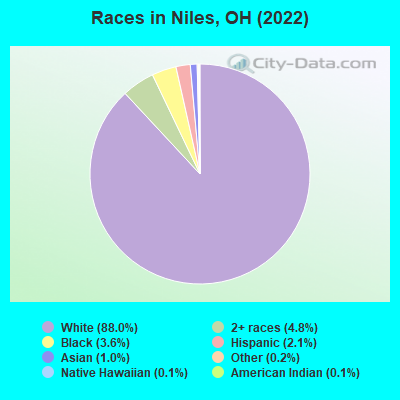
According to 2022 data, the most numerous races in Niles, OH are White alone (15,849 residents), Black alone (644 residents), and Two or more races (864 residents). 96.3% of Niles residents speak English at home. 2.1% of Niles, OH residents are foreign-born (1.3% born in Asia, 0.4% born in Europe, 0.3% born in Latin America), which is 92.6% less than the foreign-born rate of 4.0% across the entire state of Ohio.
Race distribution in Niles
2000 2022
9,538,111 84.0% White alone 1,290,662 11.4% Black alone 217,123 1.9% Hispanic 137,770 1.2% Two or more races 131,670 1.2% Asian alone 21,985 0.2% American Indian alone 13,483 0.1% Other race alone 2,336 0.02% Native Hawaiian and Other
8,948,793 76.1% White alone 1,401,403 11.9% Black alone 529,291 4.5% Two or more races 517,232 4.4% Hispanic 293,387 2.5% Asian alone 52,805 0.4% Other race alone 9,785 0.08% American Indian alone 3,362 0.03% Native Hawaiian and Other
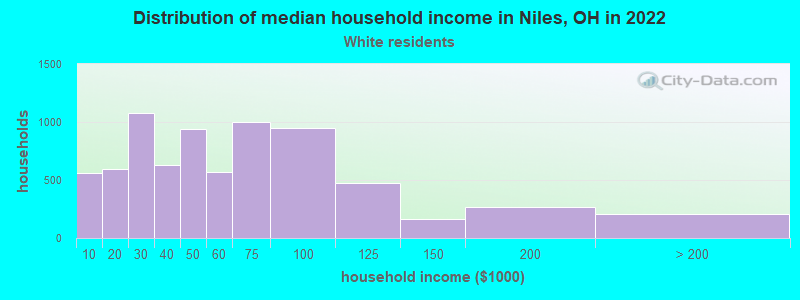
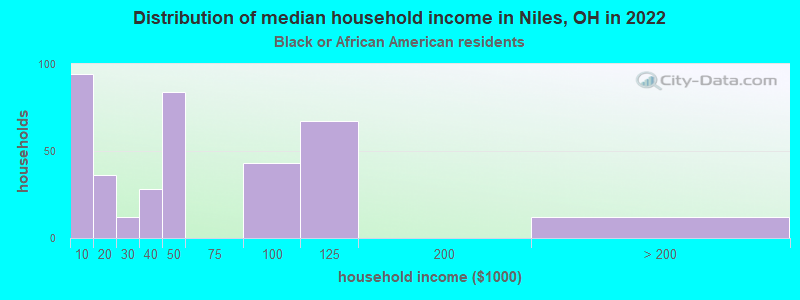
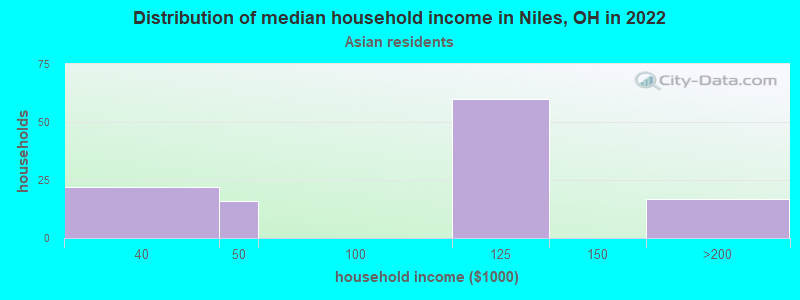
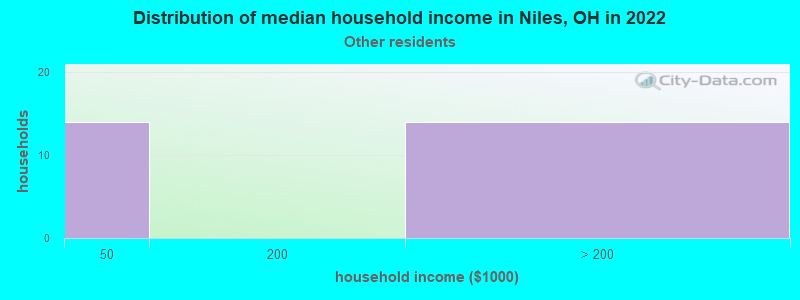
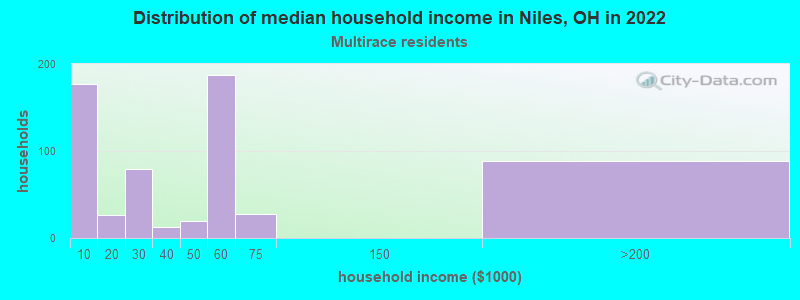
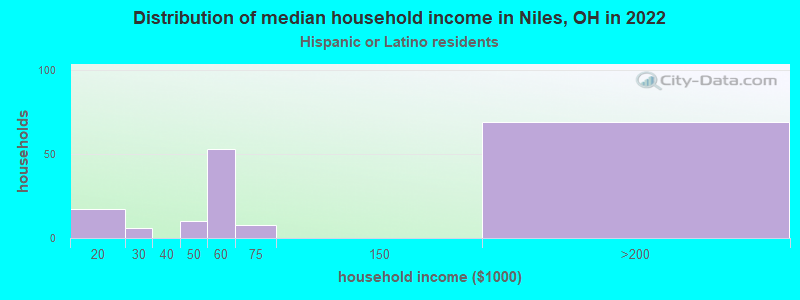
Income and house value in Niles Median household income in 2022 $47,457 White non-Hispanic householders$137,689 Asian householders$56,553 Two or more races householdersMedian 2022 house value $104,422 White Non-Hispanic householders$96,643 Black or African American householders$98,885 American Indian or Alaska Native householders $125,254 Asian householders$125,254 Hispanic or Latino householders
Median age by race in Niles
46.7 Median age for White residents44.0 51.1 43.0 Median age for Black or African American residents40.6 49.8 -676,818,950.3 Median age for American Indian / Alaska Native residents-685,185,184.5 -658,163,264.6 39.0 Median age for Asian residents36.8 53.2 -800,387,596.1 Median age for Native Hawaiian / Pacific Islander residents-666,666,666.0 -805,394,989.6 37.7 Median age for Other race residents38.7 -655,948,552.4 28.2 Median age for Two or more races residents16.9 37.3 46.5 Median age for White alone residents43.7 50.8 32.7 Median age for Hispanic or Latino residents32.5 57.8
Owner/renter occupied households by race in Niles
House owners and renters - White residents 4,539 60.7% Owner occupied2,944 39.3% Renter occupiedHouse owners and renters - Black or African American residents 32 10.1% Owner occupied287 89.9% Renter occupiedHouse owners and renters - American Indian / Alaska Native residents 20 100.0% Owner occupiedHouse owners and renters - Asian residents 13 12.8% Owner occupied89 87.2% Renter occupiedHouse owners and renters - Other race residents 12 51.5% Owner occupied11 48.5% Renter occupiedHouse owners and renters - Two or more races residents 166 26.4% Owner occupied463 73.6% Renter occupiedHouse owners and renters - White alone residents 4,497 60.5% Owner occupied2,941 39.5% Renter occupiedHouse owners and renters - Hispanic or Latino residents 160 80.7% Owner occupied38 19.3% Renter occupied
Language usage in Niles
English speakers - Total 96.3% of residents of Niles speak English at home.
0.8% of residents speak Spanish at home 40 30.3% Speak English very well92 69.7% Speak English less than very well2.9% of residents speak other language at home 200 40.0% Speak English very well300 60.0% Speak English less than very well
English speakers - Born in the United States 96.4% of residents of Niles speak English at home.
1.1% of residents speak Spanish at home 40 100.0% Speak English very well3.2% of residents speak other language at home 21 18.8% Speak English very well91 81.2% Speak English less than very well
English speakers - Native, born elsewhere 90.6% of residents of Niles speak English at home.
24.7% of residents speak Spanish at home 42 100.0% Speak English less than very well
English speakers - Foreign-born 48.3% of residents of Niles speak English at home.
21.2% of residents speak Spanish at home 62 100.0% Speak English less than very well38.4% of residents speak other language at home 51 45.5% Speak English very well61 54.5% Speak English less than very well
White (Caucasian) - Speak only English Native:
97.3% (14,870)Foreign-born:
95.9% (81)
White (Caucasian) - Speak another language Native:
2.1% (320)Foreign-born:
21.3% (18)
Asian - Speak only English Native:
100.0% (13)Foreign-born:
25.9% (62)
White alone - Speak only English Native:
97.4% (14,801)Foreign-born:
100.0% (82)
White alone - Speak another language Native:
1.8% (280)Foreign-born:
12.1% (10)
Hispanic or Latino - Speak only English Native:
83.9% (251)Foreign-born:
9.0% (4)
Hispanic or Latino - Speak another language Native:
16.1% (48)Foreign-born:
92.5% (38)
Foreign-born residents in Niles 374 residents are foreign born (1.3% Asia , 0.4% Europe , 0.3% Latin America ).
Marital status for residents in Niles Marital status - White (Caucasian) population 15 years and over
Males 39.8% Never married43.1% Now married0.4% Separated2.1% Widowed14.6% DivorcedFemales 28.7% Never married41.7% Now married0.7% Separated15.9% Widowed13.0% DivorcedWomen who gave birth in the past 12 months Now married:
50.3% (87)Unmarried:
49.7% (87)
Women who did not give birth in the past 12 months Now married:
39.4% (1,127)Unmarried:
60.6% (1,730)
Marital status - Black or African American population 15 years and over
Males 44.6% Never married26.7% Now married8.4% Separated0.0% Widowed20.3% DivorcedFemales 67.1% Never married12.7% Now married3.4% Separated2.0% Widowed14.7% DivorcedWomen who did not give birth in the past 12 months Now married:
3.0% (9)Unmarried:
97.0% (284)
Marital status - Asian population 15 years and over
Males 33.6% Never married66.4% Now married0.0% Separated0.0% Widowed0.0% DivorcedFemales 0.0% Never married52.7% Now married0.0% Separated47.3% Widowed0.0% DivorcedWomen who did not give birth in the past 12 months Now married:
100.0% (35)Unmarried:
0.0% (0)
Marital status - Other race population 15 years and over
Males 41.9% Never married29.0% Now married0.0% Separated0.0% Widowed29.0% DivorcedFemales 55.0% Never married45.0% Now married0.0% Separated0.0% Widowed0.0% DivorcedWomen who did not give birth in the past 12 months Now married:
0.0% (0)Unmarried:
100.0% (15)
Marital status - Two or more races population 15 years and over
Males 74.2% Never married10.0% Now married0.0% Separated0.0% Widowed15.8% DivorcedFemales 52.9% Never married5.5% Now married0.0% Separated30.4% Widowed11.2% DivorcedWomen who did not give birth in the past 12 months Now married:
6.3% (24)Unmarried:
93.7% (355)
Marital status - White alone, not Hispanic / Latino population 15 years and over
Males 39.7% Never married43.1% Now married0.4% Separated2.1% Widowed14.7% DivorcedFemales 29.0% Never married41.8% Now married0.7% Separated16.0% Widowed12.5% DivorcedWomen who gave birth in the past 12 months Now married:
50.3% (89)Unmarried:
49.7% (88)
Women who did not give birth in the past 12 months Now married:
39.4% (1,131)Unmarried:
60.6% (1,738)
Marital status - Hispanic or Latino population 15 years and over
Males 83.3% Never married10.9% Now married0.0% Separated0.0% Widowed5.8% DivorcedFemales 24.4% Never married28.9% Now married0.0% Separated0.0% Widowed46.7% DivorcedWomen who did not give birth in the past 12 months Now married:
40.4% (24)Unmarried:
59.6% (36)
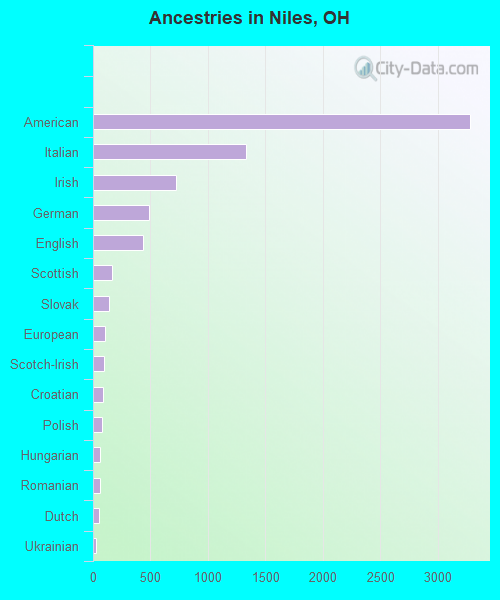
Ancestries in Niles
3,281 37.7% American1,329 15.3% Italian726 8.4% Irish485 5.6% German437 5.0% English162 1.9% Scottish142 1.6% Slovak104 1.2% European94 1.1% Scotch-Irish88 1.0% Croatian76 0.9% Polish61 0.7% Hungarian60 0.7% Romanian49 0.6% Dutch30 0.3% Ukrainian23 0.3% Eastern European19 0.2% Welsh16 0.2% Danish14 0.2% Norwegian12 0.1% Greek11 0.1% British10 0.1% Finnish10 0.1% Russian7 0.08% Slovene5 0.06% Swedish3 0.03% Czechoslovakian
Geographical mobility in Niles Same house 1 year ago 13,835 87.6% White (Caucasian)549 84.8% Black or African American208 82.0% Asian24 100.0% Native Hawaiian / Pacific Islander62 98.6% Other race1,003 96.8% Two or more races13,762 87.5% White alone, not Hispanic / Latino343 94.2% Hispanic or LatinoMoved within same county 1,185 7.5% White / Caucasian10 1.6% Black or African American13 57.6% American Indian / Alaska Native8 3.1% Asian18 1.8% Two or more races1,216 7.7% White alone, not Hispanic / Latino3 1.0% Hispanic or LatinoMoved within same state 162 1.0% White / Caucasian92 14.2% Black or African American46 18.2% Asian31 3.0% Two or more races163 1.0% White alone, not Hispanic / Latino24 6.5% Hispanic or LatinoMoved from different state 390 2.5% White / Caucasian16 2.4% Black or African American377 2.4% White alone, not Hispanic / LatinoMoved from abroad 119 0.8% White132 0.8% White alone, not Hispanic / Latino
Children Nativity (place of birth) in Niles
Children under 6 years - Living with two parents Both parents native 350 100.0% NativeOne native, one foreign-born parent 31 100.0% NativeChildren under 6 years - Living with one parent Native parent 448 100.0% NativeChildren 6 to 17 years - Living with two parents Both parents native 1,046 97.9% Native23 2.1% Foreign-bornOne native, one foreign-born parent 35 55.9% Native28 44.1% Foreign-bornChildren 6 to 17 years - Living with one parent Native parent 773 100.0% NativeForeign-born parent 14 50.4% Native14 49.6% Foreign-born
Grandparents responsible for own grandchildren in Niles
Grandparents (30 to 59 years) White / Caucasian 78 64.7% Responsible for grandchildren42 35.3% Not responsible for grandchildrenWhite alone, not Hispanic / Latino 77 64.6% Responsible for grandchildren42 35.4% Not responsible for grandchildrenGrandparents (60 years and over) White / Caucasian 57 51.2% Responsible for grandchildren55 48.8% Not responsible for grandchildrenWhite alone, not Hispanic / Latino 57 50.7% Responsible for grandchildren56 49.3% Not responsible for grandchildren