Races in South Farmingdale, New York (NY) Detailed Stats
Data:
Races - White alone (%)
Races - White alone (% change since 2000)
Races - Black alone (%)
Races - Black alone (% change since 2000)
Races - American Indian alone (%)
Races - American Indian alone (% change since 2000)
Races - Asian alone (%)
Races - Asian alone (% change since 2000)
Races - Hispanic (%)
Races - Hispanic (% change since 2000)
Races - Native Hawaiian and Other Pacific Islander alone (%)
Races - Native Hawaiian and Other Pacific Islander alone (% change since 2000)
Races - Two or more races(%)
Races - Two or more races(% change since 2000)
Races - Other race alone (%)
Races - Other race alone (% change since 2000)
Racial diversity
Place of birth - Born in state of residence (%)
Place of birth - Born in state of residence (%) - White
Place of birth - Born in state of residence (%) - Black or African American
Place of birth - Born in state of residence (%) - Asian
Place of birth - Born in state of residence (%) - Hispanic or Latino
Place of birth - Born in state of residence (%) - American Indian and Alaska Native
Place of birth - Born in state of residence (%) - Multirace
Place of birth - Born in state of residence (%) - Other Race
Place of birth - Born in other state (%)
Place of birth - Born in other state (%) - White
Place of birth - Born in other state (%) - Black or African American
Place of birth - Born in other state (%) - Asian
Place of birth - Born in other state (%) - Hispanic or Latino
Place of birth - Born in other state (%) - American Indian and Alaska Native
Place of birth - Born in other state (%) - Multirace
Place of birth - Born in other state (%) - Other Race
Place of birth - Native, outside of US (%)
Place of birth - Native, outside of US (%) - White
Place of birth - Native, outside of US (%) - Black or African American
Place of birth - Native, outside of US (%) - Asian
Place of birth - Native, outside of US (%) - Hispanic or Latino
Place of birth - Native, outside of US (%) - American Indian and Alaska Native
Place of birth - Native, outside of US (%) - Multirace
Place of birth - Native, outside of US (%) - Other Race
Place of birth - Foreign born (%)
Place of birth - Foreign born (%) - White
Place of birth - Foreign born (%) - Black or African American
Place of birth - Foreign born (%) - Asian
Place of birth - Foreign born (%) - Hispanic or Latino
Place of birth - Foreign born (%) - American Indian and Alaska Native
Place of birth - Foreign born (%) - Multirace
Place of birth - Foreign born (%) - Other Race
Residents speaking English at home (%)
Residents speaking English at home - Born in the United States (%)
Residents speaking English at home - Native, born elsewhere (%)
Residents speaking English at home - Foreign born (%)
Residents speaking Spanish at home (%)
Residents speaking Spanish at home - Born in the United States (%)
Residents speaking Spanish at home - Native, born elsewhere (%)
Residents speaking Spanish at home - Foreign born (%)
Residents speaking other language at home (%)
Residents speaking other language at home - Born in the United States (%)
Residents speaking other language at home - Native, born elsewhere (%)
Residents speaking other language at home - Foreign born (%)
Marital status - Never married (%)
Marital status - Now married (%)
Marital status - Separated (%)
Marital status - Widowed (%)
Marital status - Divorced (%)
Ancestries Reported - Arab (%)
Ancestries Reported - Czech (%)
Ancestries Reported - Danish (%)
Ancestries Reported - Dutch (%)
Ancestries Reported - English (%)
Ancestries Reported - French (%)
Ancestries Reported - French Canadian (%)
Ancestries Reported - German (%)
Ancestries Reported - Greek (%)
Ancestries Reported - Hungarian (%)
Ancestries Reported - Irish (%)
Ancestries Reported - Italian (%)
Ancestries Reported - Lithuanian (%)
Ancestries Reported - Norwegian (%)
Ancestries Reported - Polish (%)
Ancestries Reported - Portuguese (%)
Ancestries Reported - Russian (%)
Ancestries Reported - Scotch-Irish (%)
Ancestries Reported - Scottish (%)
Ancestries Reported - Slovak (%)
Ancestries Reported - Subsaharan African (%)
Ancestries Reported - Swedish (%)
Ancestries Reported - Swiss (%)
Ancestries Reported - Ukrainian (%)
Ancestries Reported - United States (%)
Ancestries Reported - Welsh (%)
Ancestries Reported - West Indian (%)
Ancestries Reported - Other (%)
Geographical mobility - Same house 1 year ago (%)
Geographical mobility - Same house 1 year ago (%) - White
Geographical mobility - Same house 1 year ago (%) - Black or African American
Geographical mobility - Same house 1 year ago (%) - Asian
Geographical mobility - Same house 1 year ago (%) - Hispanic or Latino
Geographical mobility - Same house 1 year ago (%) - American Indian and Alaska Native
Geographical mobility - Same house 1 year ago (%) - Multirace
Geographical mobility - Same house 1 year ago (%) - Other Race
Geographical mobility - Moved within same county (%)
Geographical mobility - Moved within same county (%) - White
Geographical mobility - Moved within same county (%) - Black or African American
Geographical mobility - Moved within same county (%) - Asian
Geographical mobility - Moved within same county (%) - Hispanic or Latino
Geographical mobility - Moved within same county (%) - American Indian and Alaska Native
Geographical mobility - Moved within same county (%) - Multirace
Geographical mobility - Moved within same county (%) - Other Race
Geographical mobility - Moved from different county within same state (%)
Geographical mobility - Moved from different county within same state (%) - White
Geographical mobility - Moved from different county within same state (%) - Black or African American
Geographical mobility - Moved from different county within same state (%) - Asian
Geographical mobility - Moved from different county within same state (%) - Hispanic or Latino
Geographical mobility - Moved from different county within same state (%) - American Indian and Alaska Native
Geographical mobility - Moved from different county within same state (%) - Multirace
Geographical mobility - Moved from different county within same state (%) - Other Race
Geographical mobility - Moved from different state (%)
Geographical mobility - Moved from different state (%) - White
Geographical mobility - Moved from different state (%) - Black or African American
Geographical mobility - Moved from different state (%) - Asian
Geographical mobility - Moved from different state (%) - Hispanic or Latino
Geographical mobility - Moved from different state (%) - American Indian and Alaska Native
Geographical mobility - Moved from different state (%) - Multirace
Geographical mobility - Moved from different state (%) - Other Race
Geographical mobility - Moved from abroad (%)
Geographical mobility - Moved from abroad (%) - White
Geographical mobility - Moved from abroad (%) - Black or African American
Geographical mobility - Moved from abroad (%) - Asian
Geographical mobility - Moved from abroad (%) - Hispanic or Latino
Geographical mobility - Moved from abroad (%) - American Indian and Alaska Native
Geographical mobility - Moved from abroad (%) - Multirace
Geographical mobility - Moved from abroad (%) - Other Race
Place of birth for the foreign-born population - Ireland (%)
Place of birth for the foreign-born population - Denmark (%)
Place of birth for the foreign-born population - Norway (%)
Place of birth for the foreign-born population - Sweden (%)
Place of birth for the foreign-born population - United Kingdom (%)
Place of birth for the foreign-born population - England (%)
Place of birth for the foreign-born population - Scotland (%)
Place of birth for the foreign-born population - Other Northern Europe (%)
Place of birth for the foreign-born population - Austria (%)
Place of birth for the foreign-born population - Belgium (%)
Place of birth for the foreign-born population - France (%)
Place of birth for the foreign-born population - Germany (%)
Place of birth for the foreign-born population - Netherlands (%)
Place of birth for the foreign-born population - Switzerland (%)
Place of birth for the foreign-born population - Other Western Europe (%)
Place of birth for the foreign-born population - Greece (%)
Place of birth for the foreign-born population - Italy (%)
Place of birth for the foreign-born population - Portugal (%)
Place of birth for the foreign-born population - Spain (%)
Place of birth for the foreign-born population - Other Southern Europe (%)
Place of birth for the foreign-born population - Albania (%)
Place of birth for the foreign-born population - Belarus (%)
Place of birth for the foreign-born population - Bosnia and Herzegovina (%)
Place of birth for the foreign-born population - Bulgaria (%)
Place of birth for the foreign-born population - Croatia (%)
Place of birth for the foreign-born population - Czechoslovakia (%)
Place of birth for the foreign-born population - Hungary (%)
Place of birth for the foreign-born population - Latvia (%)
Place of birth for the foreign-born population - Lithuania (%)
Place of birth for the foreign-born population - North Macedonia (Macedonia) (%)
Place of birth for the foreign-born population - Moldova (%)
Place of birth for the foreign-born population - Poland (%)
Place of birth for the foreign-born population - Romania (%)
Place of birth for the foreign-born population - Russia (%)
Place of birth for the foreign-born population - Serbia (%)
Place of birth for the foreign-born population - Ukraine (%)
Place of birth for the foreign-born population - Other Eastern Europe (%)
Place of birth for the foreign-born population - China (%)
Place of birth for the foreign-born population - Hong Kong (%)
Place of birth for the foreign-born population - Taiwan (%)
Place of birth for the foreign-born population - Japan (%)
Place of birth for the foreign-born population - Korea (%)
Place of birth for the foreign-born population - Other Eastern Asia (%)
Place of birth for the foreign-born population - Afghanistan (%)
Place of birth for the foreign-born population - Bangladesh (%)
Place of birth for the foreign-born population - India (%)
Place of birth for the foreign-born population - Iran (%)
Place of birth for the foreign-born population - Kazakhstan (%)
Place of birth for the foreign-born population - Nepal (%)
Place of birth for the foreign-born population - Pakistan (%)
Place of birth for the foreign-born population - Sri Lanka (%)
Place of birth for the foreign-born population - Uzbekistan (%)
Place of birth for the foreign-born population - Other South Central Asia (%)
Place of birth for the foreign-born population - Burma (%)
Place of birth for the foreign-born population - Cambodia (%)
Place of birth for the foreign-born population - Indonesia (%)
Place of birth for the foreign-born population - Laos (%)
Place of birth for the foreign-born population - Malaysia (%)
Place of birth for the foreign-born population - Philippines (%)
Place of birth for the foreign-born population - Singapore (%)
Place of birth for the foreign-born population - Thailand (%)
Place of birth for the foreign-born population - Vietnam (%)
Place of birth for the foreign-born population - Other South Eastern Asia (%)
Place of birth for the foreign-born population - Armenia (%)
Place of birth for the foreign-born population - Iraq (%)
Place of birth for the foreign-born population - Israel (%)
Place of birth for the foreign-born population - Jordan (%)
Place of birth for the foreign-born population - Kuwait (%)
Place of birth for the foreign-born population - Lebanon (%)
Place of birth for the foreign-born population - Saudi Arabia (%)
Place of birth for the foreign-born population - Syria (%)
Place of birth for the foreign-born population - Turkey (%)
Place of birth for the foreign-born population - Yemen (%)
Place of birth for the foreign-born population - Other Western Asia (%)
Place of birth for the foreign-born population - Eritrea (%)
Place of birth for the foreign-born population - Ethiopia (%)
Place of birth for the foreign-born population - Kenya (%)
Place of birth for the foreign-born population - Somalia (%)
Place of birth for the foreign-born population - Uganda (%)
Place of birth for the foreign-born population - Zimbabwe (%)
Place of birth for the foreign-born population - Other Eastern Africa (%)
Place of birth for the foreign-born population - Cameroon (%)
Place of birth for the foreign-born population - Congo (%)
Place of birth for the foreign-born population - Democratic Republic of Congo (Zaire) (%)
Place of birth for the foreign-born population - Other Middle Africa (%)
Place of birth for the foreign-born population - Egypt (%)
Place of birth for the foreign-born population - Morocco (%)
Place of birth for the foreign-born population - Sudan (%)
Place of birth for the foreign-born population - Other Northern Africa (%)
Place of birth for the foreign-born population - South Africa (%)
Place of birth for the foreign-born population - Other Southern Africa (%)
Place of birth for the foreign-born population - Cabo Verde (%)
Place of birth for the foreign-born population - Ghana (%)
Place of birth for the foreign-born population - Liberia (%)
Place of birth for the foreign-born population - Nigeria (%)
Place of birth for the foreign-born population - Senegal (%)
Place of birth for the foreign-born population - Sierra Leone (%)
Place of birth for the foreign-born population - Other Western Africa (%)
Place of birth for the foreign-born population - Australia (%)
Place of birth for the foreign-born population - New Zealand (%)
Place of birth for the foreign-born population - Fiji (%)
Place of birth for the foreign-born population - Micronesia (%)
Place of birth for the foreign-born population - Bahamas (%)
Place of birth for the foreign-born population - Barbados (%)
Place of birth for the foreign-born population - Cuba (%)
Place of birth for the foreign-born population - Dominica (%)
Place of birth for the foreign-born population - Dominican Republic (%)
Place of birth for the foreign-born population - Grenada (%)
Place of birth for the foreign-born population - Haiti (%)
Place of birth for the foreign-born population - Jamaica (%)
Place of birth for the foreign-born population - St. Vincent and the Grenadines (%)
Place of birth for the foreign-born population - Trinidad and Tobago (%)
Place of birth for the foreign-born population - West Indies (%)
Place of birth for the foreign-born population - Other Caribbean (%)
Place of birth for the foreign-born population - Belize (%)
Place of birth for the foreign-born population - Costa Rica (%)
Place of birth for the foreign-born population - El Salvador (%)
Place of birth for the foreign-born population - Guatemala (%)
Place of birth for the foreign-born population - Honduras (%)
Place of birth for the foreign-born population - Mexico (%)
Place of birth for the foreign-born population - Nicaragua (%)
Place of birth for the foreign-born population - Panama (%)
Place of birth for the foreign-born population - Other Central America (%)
Place of birth for the foreign-born population - Argentina (%)
Place of birth for the foreign-born population - Bolivia (%)
Place of birth for the foreign-born population - Brazil (%)
Place of birth for the foreign-born population - Chile (%)
Place of birth for the foreign-born population - Colombia (%)
Place of birth for the foreign-born population - Ecuador (%)
Place of birth for the foreign-born population - Guyana (%)
Place of birth for the foreign-born population - Peru (%)
Place of birth for the foreign-born population - Uruguay (%)
Place of birth for the foreign-born population - Venezuela (%)
Place of birth for the foreign-born population - Other South America (%)
Place of birth for the foreign-born population - Canada (%)
Place of birth for the foreign-born population - Other Northern America (%)
Place of birth for the foreign-born population - Other (%)
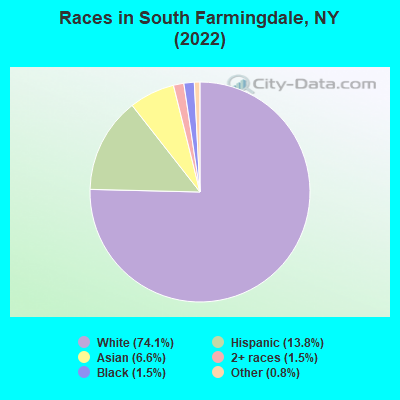
According to 2022 data, the most numerous races in South Farmingdale, NY are White alone (11,085 residents), Hispanic (2,072 residents), and Black alone (224 residents). 83.6% of South Farmingdale residents speak English at home. 9.8% of South Farmingdale, NY residents are foreign-born (4.6% born in Asia, 3.6% born in Latin America, 1.4% born in Europe), which is 124.5% less than the foreign-born rate of 22.0% across the entire state of New York.
Race distribution in South Farmingdale
2000 2022
11,760,981 62.0% White alone 2,867,583 15.1% Hispanic 2,812,623 14.8% Black alone 1,035,926 5.5% Asian alone 366,116 1.9% Two or more races 75,499 0.4% Other race alone 52,499 0.3% American Indian alone 5,230 0.03% Native Hawaiian and Other
10,408,933 52.9% White alone 3,867,299 19.7% Hispanic 2,633,840 13.4% Black alone 1,776,286 9.0% Asian alone 732,670 3.7% Two or more races 216,110 1.1% Other race alone 35,082 0.2% American Indian alone 6,931 0.04% Native Hawaiian and Other
Income and house value in South Farmingdale Median household income in 2022 $154,541 White non-Hispanic householders$115,228 Black householders$167,506 Asian householdersover $200,000 Some other race householders$198,524 Two or more races householders$198,412 Hispanic or Latino race householdersMedian 2022 house value $565,382 White Non-Hispanic householders$572,491 Black or African American householders$405,172 American Indian or Alaska Native householders $536,676 Asian householders$678,295 Some other race householders$643,847 Two or more races householders$560,735 Hispanic or Latino householders
Median age by race in South Farmingdale
47.2 Median age for White residents47.7 47.1 39.5 Median age for Black or African American residents45.7 39.2 -855,158,729.3 Median age for American Indian / Alaska Native residents-607,543,322.5 -837,121,211.3 46.2 Median age for Asian residents36.8 50.9 -487,992,314.6 Median age for Native Hawaiian / Pacific Islander residents-477,502,295.2 -497,387,669.3 62.8 Median age for Other race residents70.7 60.4 15.9 Median age for Two or more races residents29.1 11.9 47.6 Median age for White alone residents46.8 48.9 26.3 Median age for Hispanic or Latino residents31.3 21.9
Owner/renter occupied households by race in South Farmingdale
House owners and renters - White residents 3,576 94.4% Owner occupied213 5.6% Renter occupiedHouse owners and renters - Black or African American residents 68 76.5% Owner occupied21 23.5% Renter occupiedHouse owners and renters - American Indian / Alaska Native residents 24 100.0% Owner occupiedHouse owners and renters - Asian residents 296 100.0% Owner occupiedHouse owners and renters - Other race residents 11 23.8% Owner occupied34 76.2% Renter occupiedHouse owners and renters - Two or more races residents 382 100.0% Owner occupiedHouse owners and renters - White alone residents 3,553 93.9% Owner occupied230 6.1% Renter occupiedHouse owners and renters - Hispanic or Latino residents 397 92.7% Owner occupied31 7.3% Renter occupied
Language usage in South Farmingdale
English speakers - Total 83.6% of residents of South Farmingdale speak English at home.
6.0% of residents speak Spanish at home 686 80.3% Speak English very well168 19.7% Speak English less than very well9.8% of residents speak other language at home 1,098 77.9% Speak English very well311 22.1% Speak English less than very well
English speakers - Born in the United States 97.2% of residents of South Farmingdale speak English at home.
1.9% of residents speak Spanish at home 17 100.0% Speak English very well
English speakers - Native, born elsewhere 46.7% of residents of South Farmingdale speak English at home.
37.7% of residents speak Spanish at home 68 62.4% Speak English very well41 37.6% Speak English less than very well13.5% of residents speak other language at home 39 100.0% Speak English very well
English speakers - Foreign-born 22.5% of residents of South Farmingdale speak English at home.
21.5% of residents speak Spanish at home 225 69.0% Speak English very well101 31.0% Speak English less than very well55.3% of residents speak other language at home 542 64.6% Speak English very well297 35.4% Speak English less than very well
White (Caucasian) - Speak only English Native:
95.4% (10,156)Foreign-born:
45.6% (120)
White (Caucasian) - Speak another language Native:
5.0% (530)Foreign-born:
57.9% (153)
Black or African American - Speak only English Native:
99.1% (138)Foreign-born:
81.5% (67)
Asian - Speak only English Native:
73.3% (184)Foreign-born:
12.6% (96)
Asian - Speak another language Native:
28.3% (71)Foreign-born:
87.2% (663)
Other race - Speak only English Native:
75.6% (168)Foreign-born:
6.5% (16)
Other race - Speak another language Native:
29.9% (66)Foreign-born:
93.7% (230)
Two or more races - Speak only English Native:
70.0% (933)Foreign-born:
20.8% (43)
Two or more races - Speak another language Native:
29.0% (387)Foreign-born:
78.8% (162)
White alone - Speak only English Native:
94.6% (9,859)Foreign-born:
38.5% (120)
White alone - Speak another language Native:
5.4% (561)Foreign-born:
61.3% (191)
Hispanic or Latino - Speak only English Native:
72.4% (1,056)Foreign-born:
10.3% (43)
Hispanic or Latino - Speak another language Native:
26.9% (393)Foreign-born:
89.7% (369)
Foreign-born residents in South Farmingdale 1,467 residents are foreign born (4.6% Asia , 3.6% Latin America , 1.4% Europe ).
This city:
9.8%New York:
22.6%
Marital status for residents in South Farmingdale Marital status - White (Caucasian) population 15 years and over
Males 31.7% Never married60.1% Now married0.0% Separated1.5% Widowed6.6% DivorcedFemales 31.1% Never married52.8% Now married1.3% Separated10.3% Widowed4.6% DivorcedWomen who gave birth in the past 12 months Now married:
100.0% (113)Unmarried:
0.0% (0)
Women who did not give birth in the past 12 months Now married:
37.5% (886)Unmarried:
62.5% (1,475)
Marital status - Black or African American population 15 years and over
Males 0.0% Never married67.9% Now married0.0% Separated0.0% Widowed32.1% DivorcedFemales 57.7% Never married27.0% Now married0.0% Separated0.0% Widowed15.3% DivorcedWomen who did not give birth in the past 12 months Now married:
38.3% (42)Unmarried:
61.7% (67)
Marital status - Asian population 15 years and over
Males 32.4% Never married58.0% Now married0.0% Separated0.7% Widowed8.9% DivorcedFemales 14.8% Never married62.8% Now married0.0% Separated8.4% Widowed14.1% DivorcedWomen who gave birth in the past 12 months Now married:
75.0% (10)Unmarried:
25.0% (3)
Women who did not give birth in the past 12 months Now married:
62.7% (141)Unmarried:
37.3% (84)
Marital status - Other race population 15 years and over
Males 26.9% Never married22.3% Now married0.0% Separated50.8% Widowed0.0% DivorcedFemales 5.2% Never married87.6% Now married0.0% Separated1.2% Widowed6.0% DivorcedWomen who did not give birth in the past 12 months Now married:
42.9% (24)Unmarried:
57.1% (32)
Marital status - Two or more races population 15 years and over
Males 35.4% Never married64.6% Now married0.0% Separated0.0% Widowed0.0% DivorcedFemales 33.5% Never married55.2% Now married0.0% Separated8.9% Widowed2.4% DivorcedWomen who did not give birth in the past 12 months Now married:
55.4% (156)Unmarried:
44.6% (125)
Marital status - White alone, not Hispanic / Latino population 15 years and over
Males 31.9% Never married59.7% Now married0.0% Separated1.6% Widowed6.8% DivorcedFemales 30.9% Never married53.7% Now married1.3% Separated9.9% Widowed4.2% DivorcedWomen who gave birth in the past 12 months Now married:
100.0% (120)Unmarried:
0.0% (0)
Women who did not give birth in the past 12 months Now married:
37.4% (889)Unmarried:
62.6% (1,488)
Marital status - Hispanic or Latino population 15 years and over
Males 34.4% Never married65.6% Now married0.0% Separated0.0% Widowed0.0% DivorcedFemales 23.3% Never married60.7% Now married0.0% Separated8.2% Widowed7.8% DivorcedWomen who did not give birth in the past 12 months Now married:
49.7% (191)Unmarried:
50.3% (193)
Ancestries in South Farmingdale
2,408 36.8% Italian739 11.3% Irish590 9.0% Greek342 5.2% American342 5.2% German167 2.6% Polish70 1.1% European58 0.9% Jamaican44 0.7% Romanian39 0.6% English37 0.6% West Indian31 0.5% British21 0.3% Norwegian14 0.2% Trinidadian and Tobagonian13 0.2% French Canadian13 0.2% Scotch-Irish11 0.2% Turkish11 0.2% Haitian8 0.1% Czech8 0.1% French7 0.1% Egyptian7 0.1% Portuguese7 0.1% Russian7 0.1% Ethiopian6 0.09% Cypriot6 0.09% Scottish5 0.08% Lithuanian3 0.05% Guyanese
Children Nativity (place of birth) in South Farmingdale
Children under 6 years - Living with two parents Both parents native 590 100.0% NativeBoth parents foreign-born 41 100.0% NativeOne native, one foreign-born parent 34 100.0% NativeChildren under 6 years - Living with one parent Native parent 62 100.0% NativeForeign-born parent 43 100.0% NativeChildren 6 to 17 years - Living with two parents Both parents native 1,280 100.0% NativeBoth parents foreign-born 101 100.0% NativeOne native, one foreign-born parent 111 100.0% NativeChildren 6 to 17 years - Living with one parent Native parent 261 100.0% NativeForeign-born parent 20 47.2% Native22 52.8% Foreign-born
Grandparents responsible for own grandchildren in South Farmingdale
Grandparents (30 to 59 years) White / Caucasian 27 77.9% Responsible for grandchildren8 22.1% Not responsible for grandchildrenOther race 3 100.0% Responsible for grandchildrenWhite alone, not Hispanic / Latino 29 85.6% Responsible for grandchildren5 14.4% Not responsible for grandchildrenGrandparents (60 years and over) White / Caucasian 18 12.3% Responsible for grandchildren125 87.7% Not responsible for grandchildrenWhite alone, not Hispanic / Latino 17 12.0% Responsible for grandchildren121 88.0% Not responsible for grandchildren