Races in Trotwood, Ohio (OH) Detailed Stats
Ancestries, Foreign-born residents, place of birth
Settings
X


Recent posts about races in Trotwood, Ohio on our local forum with over 2,400,000 registered users:
 | Englewood, Clayton, Trotwood, Dayton, and Race (12 replies) |
| Best Dayton Ohio area to live for a retiree (24 replies) |
| Dayton Development Thread (1673 replies) |
| A thought on the "city" versus the "suburbs" of Dayton (54 replies) |
| Home Building in the Cincy/Dayton Area (74 replies) |
| The Downfall Of Dayton (58 replies) |
Latest news about races in Trotwood, OH collected exclusively by city-data.com from local newspapers, TV, and radio stations
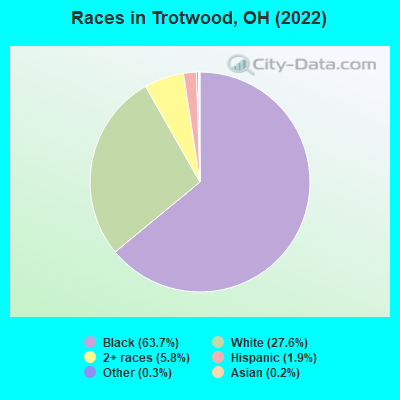
According to 2022 data, the most numerous races in Trotwood, OH are White alone (6,351 residents), Black alone (14,660 residents), and Two or more races (1,328 residents). 95.1% of Trotwood residents speak English at home. 3.4% of Trotwood, OH residents are foreign-born (1.9% born in Africa, 0.8% born in Europe, 0.3% born in Asia), which is 18.6% less than the foreign-born rate of 4.0% across the entire state of Ohio.
Race distribution in Trotwood
2000
2022

- 15,95358.2%Black alone
- 10,50138.3%White alone
- 5111.9%Two or more races
- 2240.8%Hispanic
- 750.3%Other race alone
- 880.3%American Indian alone
- 660.2%Asian alone
- 20.01%Native Hawaiian and Other
Pacific Islander alone

-
- 14,66063.7%Black alone
- 6,35127.6%White alone
- 1,3285.8%Two or more races
- 4491.9%Hispanic
- 610.3%Other race alone
- 370.2%Asian alone
- 160.07%Native Hawaiian and Other
Pacific Islander alone - 40.02%American Indian alone
2000
2022
-
- 9,538,11184.0%White alone
- 1,290,66211.4%Black alone
- 217,1231.9%Hispanic
- 137,7701.2%Two or more races
- 131,6701.2%Asian alone
- 21,9850.2%American Indian alone
- 13,4830.1%Other race alone
- 2,3360.02%Native Hawaiian and Other
Pacific Islander alone

-
- 8,948,79376.1%White alone
- 1,401,40311.9%Black alone
- 529,2914.5%Two or more races
- 517,2324.4%Hispanic
- 293,3872.5%Asian alone
- 52,8050.4%Other race alone
- 9,7850.08%American Indian alone
- 3,3620.03%Native Hawaiian and Other
Pacific Islander alone

Income and house value in Trotwood
- Median household income in 2022
- $46,045White non-Hispanic householders
- $54,361Black householders
- $43,336Some other race householders
- $35,083Two or more races householders
- $42,807Hispanic or Latino race householders
- Median 2022 house value
- $95,006White Non-Hispanic householders
- $113,617Black or African American householders
- $168,798American Indian or Alaska Native householders
- $97,609Some other race householders
- $111,925Two or more races householders
- $111,664Hispanic or Latino householders
Household income for White non-Hispanic householders

Household income for Black householders

Household income for Some other race householders

Household income for Two or more races householders

Household income for Hispanic or Latino race householders

Median age by race in Trotwood
- 52.3Median age for White residents
- 51.8Males
- 53.0Females
- 44.3Median age for Black or African American residents
- 43.7Males
- 43.3Females
- -1,349,593,494.6Median age for American Indian / Alaska Native residents
- -685,185,184.5Males
- -1,438,172,041.6Females
- 46.7Median age for Asian residents
- -700,700,700.0Males
- 17.0Females
- 27.4Median age for Native Hawaiian / Pacific Islander residents
- -750,242,953.6Males
- 26.9Females
- 74.2Median age for Other race residents
- 105.6Males
- 57.4Females
- 29.6Median age for Two or more races residents
- 31.7Males
- 28.6Females
- 52.1Median age for White alone residents
- 51.9Males
- 52.7Females
- 46.9Median age for Hispanic or Latino residents
- 40.9Males
- 53.2Females
Owner/renter occupied households by race in Trotwood
- House owners and renters - White residents
- 2,31372.2%Owner occupied
- 89227.8%Renter occupied
- House owners and renters - Black or African American residents
- 3,51153.9%Owner occupied
- 2,99846.1%Renter occupied
- House owners and renters - Asian residents
- 17100.0%Renter occupied
- House owners and renters - Native Hawaiian / Pacific Islander residents
- 8100.0%Renter occupied
- House owners and renters - Other race residents
- 11090.4%Owner occupied
- 129.6%Renter occupied
- House owners and renters - Two or more races residents
- 32647.6%Owner occupied
- 35952.4%Renter occupied
- House owners and renters - White alone residents
- 2,31271.8%Owner occupied
- 91028.2%Renter occupied
- House owners and renters - Hispanic or Latino residents
- 14775.5%Owner occupied
- 4824.5%Renter occupied
Language usage in Trotwood
- English speakers - Total
- 95.1% of residents of Trotwood speak English at home.
- 1.2% of residents speak Spanish at home
- 26195.3%Speak English very well
- 134.7%Speak English less than very well
- 3.4% of residents speak other language at home
- 53170.5%Speak English very well
- 22229.5%Speak English less than very well
- English speakers - Born in the United States
- 97.9% of residents of Trotwood speak English at home.
- 0.8% of residents speak Spanish at home
- 39100.0%Speak English very well
- 1.0% of residents speak other language at home
- 53100.0%Speak English very well
All residents speak only English at home
- English speakers - Foreign-born
- 11.8% of residents of Trotwood speak English at home.
- 8.3% of residents speak Spanish at home
- 61100.0%Speak English very well
- 82.9% of residents speak other language at home
- 39664.9%Speak English very well
- 21435.1%Speak English less than very well
White (Caucasian) - Speak only English
| Native: | 99.1% (5,864) |
| Foreign-born: | 4.8% (10) |
White (Caucasian) - Speak another language
| Native: | 0.7% (42) |
| Foreign-born: | 95.6% (207) |
Black or African American - Speak only English
| Native: | 99.3% (13,698) |
| Foreign-born: | 14.7% (42) |
Black or African American - Speak another language
| Native: | 0.8% (104) |
| Foreign-born: | 68.1% (194) |
Asian - Speak only English
| Native: | 37.8% (6) |
| Foreign-born: | 75.9% (17) |
Two or more races - Speak only English
| Native: | 94.8% (1,439) |
| Foreign-born: | 20.2% (28) |
Two or more races - Speak another language
| Native: | 1.8% (28) |
| Foreign-born: | 80.3% (112) |
White alone - Speak only English
| Native: | 99.0% (5,870) |
| Foreign-born: | 4.3% (10) |
White alone - Speak another language
| Native: | 0.8% (47) |
| Foreign-born: | 100.0% (235) |
Hispanic or Latino - Speak another language
| Native: | 30.8% (143) |
| Foreign-born: | 97.0% (5) |
Foreign-born residents in Trotwood
777 residents are foreign born (1.9% Africa, 0.8% Europe, 0.3% Asia).
| This city: | 3.4% |
| Ohio: | 4.9% |


Marital status for residents in Trotwood
Marital status - White (Caucasian) population 15 years and over
- Males
- 35.2%Never married
- 37.7%Now married
- 2.1%Separated
- 10.2%Widowed
- 14.9%Divorced
- Females
- 20.9%Never married
- 34.7%Now married
- 4.6%Separated
- 18.6%Widowed
- 21.2%Divorced
Women who gave birth in the past 12 months
| Now married: | 89.1% (47) |
| Unmarried: | 10.9% (6) |
Women who did not give birth in the past 12 months
| Now married: | 47.1% (527) |
| Unmarried: | 52.9% (592) |
Marital status - Black or African American population 15 years and over
- Males
- 43.0%Never married
- 36.2%Now married
- 1.5%Separated
- 5.2%Widowed
- 14.0%Divorced
- Females
- 45.6%Never married
- 25.9%Now married
- 2.5%Separated
- 8.7%Widowed
- 17.4%Divorced
Women who gave birth in the past 12 months
| Now married: | 60.5% (70) |
| Unmarried: | 39.5% (45) |
Women who did not give birth in the past 12 months
| Now married: | 20.2% (679) |
| Unmarried: | 79.8% (2,678) |
Marital status - Asian population 15 years and over
- Males
- 0.0%Never married
- 100.0%Now married
- 0.0%Separated
- 0.0%Widowed
- 0.0%Divorced
- Females
- 38.1%Never married
- 0.0%Now married
- 61.9%Separated
- 0.0%Widowed
- 0.0%Divorced
Women who did not give birth in the past 12 months
| Now married: | 61.9% (13) |
| Unmarried: | 38.1% (8) |
Marital status - Native Hawaiian / Pacific Islander population 15 years and over
- Males
- 0.0%Never married
- 100.0%Now married
- 0.0%Separated
- 0.0%Widowed
- 0.0%Divorced
- Females
- 0.0%Never married
- 100.0%Now married
- 0.0%Separated
- 0.0%Widowed
- 0.0%Divorced
Women who did not give birth in the past 12 months
| Now married: | 100.0% (11) |
| Unmarried: | 0.0% (0) |
Marital status - Other race population 15 years and over
- Males
- 0.0%Never married
- 0.0%Now married
- 0.0%Separated
- 90.5%Widowed
- 9.5%Divorced
- Females
- 13.2%Never married
- 13.2%Now married
- 0.0%Separated
- 0.0%Widowed
- 73.7%Divorced
Women who did not give birth in the past 12 months
| Now married: | 0.0% (0) |
| Unmarried: | 100.0% (4) |
Marital status - Two or more races population 15 years and over
- Males
- 68.3%Never married
- 17.2%Now married
- 0.0%Separated
- 2.9%Widowed
- 11.6%Divorced
- Females
- 49.8%Never married
- 7.0%Now married
- 0.0%Separated
- 3.7%Widowed
- 39.5%Divorced
Women who did not give birth in the past 12 months
| Now married: | 6.0% (24) |
| Unmarried: | 94.0% (385) |
Marital status - White alone, not Hispanic / Latino population 15 years and over
- Males
- 35.2%Never married
- 37.7%Now married
- 2.1%Separated
- 10.2%Widowed
- 14.9%Divorced
- Females
- 21.0%Never married
- 34.9%Now married
- 4.6%Separated
- 18.7%Widowed
- 20.9%Divorced
Women who gave birth in the past 12 months
| Now married: | 89.1% (48) |
| Unmarried: | 10.9% (6) |
Women who did not give birth in the past 12 months
| Now married: | 47.1% (533) |
| Unmarried: | 52.9% (598) |
Marital status - Hispanic or Latino population 15 years and over
- Males
- 39.3%Never married
- 27.2%Now married
- 0.0%Separated
- 22.0%Widowed
- 11.6%Divorced
- Females
- 4.9%Never married
- 19.6%Now married
- 0.0%Separated
- 6.3%Widowed
- 69.2%Divorced
Women who did not give birth in the past 12 months
| Now married: | 6.9% (2) |
| Unmarried: | 93.1% (29) |
Ancestries in Trotwood

- 7655.0%German
- 5173.4%American
- 4973.3%African
- 4753.1%English
- 2291.5%Egyptian
- 1581.0%French
- 1440.9%Irish
- 1140.7%Czech
- 1070.7%Italian
- 650.4%European
- 380.2%Ethiopian
- 310.2%Scottish
- 300.2%Romanian
- 230.2%Ukrainian
- 190.1%Polish
- 180.1%Scandinavian
- 170.1%British
- 160.1%Dutch
- 150.10%Eastern European
- 120.08%Swiss
- 100.07%Turkish
- 70.05%Liberian
- 70.05%Swedish
- 70.05%Jamaican
- 20.01%Welsh

Geographical mobility in Trotwood

- Same house 1 year ago
- 5,31584.5%White (Caucasian)
- 12,31284.1%Black or African American
- 5100.0%American Indian / Alaska Native
- 3078.4%Asian
- 416.8%Native Hawaiian / Pacific Islander
- 17587.6%Other race
- 1,26771.4%Two or more races
- 5,33684.5%White alone, not Hispanic / Latino
- 35278.0%Hispanic or Latino

-
- Moved within same county
- 4256.8%White / Caucasian
- 2,02613.8%Black or African American
- 513.8%Asian
- 2078.8%Native Hawaiian / Pacific Islander
- 209.9%Other race
- 28316.0%Two or more races
- 4256.7%White alone, not Hispanic / Latino
- 30.7%Hispanic or Latino

-
- Moved within same state
- 2103.3%White / Caucasian
- 1651.1%Black or African American
- 703.9%Two or more races
- 2143.4%White alone, not Hispanic / Latino
- 13530.0%Hispanic or Latino

-
- Moved from different state
- 1372.2%White / Caucasian
- 390.3%Black or African American
- 1428.0%Two or more races
- 1372.2%White alone, not Hispanic / Latino

-
- Moved from abroad
- 2534.0%White
- 1160.8%Black or African American
- 2684.2%White alone, not Hispanic / Latino

Children Nativity (place of birth) in Trotwood
Place of birth for residents in Trotwood
![Place of birth for the foreign-born population - Regions]()
- 453Africa
- 292Western Africa
- 200Europe
- 189Eastern Europe
- 122Middle Africa
- 80Asia
- 33Eastern Asia
- 32Western Asia
- 28Americas
- 28Latin America
- 23South America
- 20Eastern Africa
- 14South Eastern Asia
- 13Oceania
- 8Western Europe
- 8China
- 5Caribbean
- 3Northern Europe

![Place of birth for the foreign-born population - Countries]()
- 277Senegal
- 130Czechoslovakia
- 122Cameroon
- 32Romania
- 25Japan
- 24United Arab Emirates
- 20Ethiopia
- 18Poland
- 18Guyana
- 14Philippines
- 9Liberia
- 8Germany
- 8Ukraine
- 8China
- 8Turkey
- 6Nigeria
- 6Fiji
- 5Jamaica
- 3United Kingdom
- 3Ecuador
- 2Colombia

Grandparents responsible for own grandchildren in Trotwood
Zip codes: 45426.