Races in Westlake, Ohio (OH) Detailed Stats
Data:
Races - White alone (%)
Races - White alone (% change since 2000)
Races - Black alone (%)
Races - Black alone (% change since 2000)
Races - American Indian alone (%)
Races - American Indian alone (% change since 2000)
Races - Asian alone (%)
Races - Asian alone (% change since 2000)
Races - Hispanic (%)
Races - Hispanic (% change since 2000)
Races - Native Hawaiian and Other Pacific Islander alone (%)
Races - Native Hawaiian and Other Pacific Islander alone (% change since 2000)
Races - Two or more races(%)
Races - Two or more races(% change since 2000)
Races - Other race alone (%)
Races - Other race alone (% change since 2000)
Racial diversity
Place of birth - Born in state of residence (%)
Place of birth - Born in state of residence (%) - White
Place of birth - Born in state of residence (%) - Black or African American
Place of birth - Born in state of residence (%) - Asian
Place of birth - Born in state of residence (%) - Hispanic or Latino
Place of birth - Born in state of residence (%) - American Indian and Alaska Native
Place of birth - Born in state of residence (%) - Multirace
Place of birth - Born in state of residence (%) - Other Race
Place of birth - Born in other state (%)
Place of birth - Born in other state (%) - White
Place of birth - Born in other state (%) - Black or African American
Place of birth - Born in other state (%) - Asian
Place of birth - Born in other state (%) - Hispanic or Latino
Place of birth - Born in other state (%) - American Indian and Alaska Native
Place of birth - Born in other state (%) - Multirace
Place of birth - Born in other state (%) - Other Race
Place of birth - Native, outside of US (%)
Place of birth - Native, outside of US (%) - White
Place of birth - Native, outside of US (%) - Black or African American
Place of birth - Native, outside of US (%) - Asian
Place of birth - Native, outside of US (%) - Hispanic or Latino
Place of birth - Native, outside of US (%) - American Indian and Alaska Native
Place of birth - Native, outside of US (%) - Multirace
Place of birth - Native, outside of US (%) - Other Race
Place of birth - Foreign born (%)
Place of birth - Foreign born (%) - White
Place of birth - Foreign born (%) - Black or African American
Place of birth - Foreign born (%) - Asian
Place of birth - Foreign born (%) - Hispanic or Latino
Place of birth - Foreign born (%) - American Indian and Alaska Native
Place of birth - Foreign born (%) - Multirace
Place of birth - Foreign born (%) - Other Race
Residents speaking English at home (%)
Residents speaking English at home - Born in the United States (%)
Residents speaking English at home - Native, born elsewhere (%)
Residents speaking English at home - Foreign born (%)
Residents speaking Spanish at home (%)
Residents speaking Spanish at home - Born in the United States (%)
Residents speaking Spanish at home - Native, born elsewhere (%)
Residents speaking Spanish at home - Foreign born (%)
Residents speaking other language at home (%)
Residents speaking other language at home - Born in the United States (%)
Residents speaking other language at home - Native, born elsewhere (%)
Residents speaking other language at home - Foreign born (%)
Marital status - Never married (%)
Marital status - Now married (%)
Marital status - Separated (%)
Marital status - Widowed (%)
Marital status - Divorced (%)
Ancestries Reported - Arab (%)
Ancestries Reported - Czech (%)
Ancestries Reported - Danish (%)
Ancestries Reported - Dutch (%)
Ancestries Reported - English (%)
Ancestries Reported - French (%)
Ancestries Reported - French Canadian (%)
Ancestries Reported - German (%)
Ancestries Reported - Greek (%)
Ancestries Reported - Hungarian (%)
Ancestries Reported - Irish (%)
Ancestries Reported - Italian (%)
Ancestries Reported - Lithuanian (%)
Ancestries Reported - Norwegian (%)
Ancestries Reported - Polish (%)
Ancestries Reported - Portuguese (%)
Ancestries Reported - Russian (%)
Ancestries Reported - Scotch-Irish (%)
Ancestries Reported - Scottish (%)
Ancestries Reported - Slovak (%)
Ancestries Reported - Subsaharan African (%)
Ancestries Reported - Swedish (%)
Ancestries Reported - Swiss (%)
Ancestries Reported - Ukrainian (%)
Ancestries Reported - United States (%)
Ancestries Reported - Welsh (%)
Ancestries Reported - West Indian (%)
Ancestries Reported - Other (%)
Geographical mobility - Same house 1 year ago (%)
Geographical mobility - Same house 1 year ago (%) - White
Geographical mobility - Same house 1 year ago (%) - Black or African American
Geographical mobility - Same house 1 year ago (%) - Asian
Geographical mobility - Same house 1 year ago (%) - Hispanic or Latino
Geographical mobility - Same house 1 year ago (%) - American Indian and Alaska Native
Geographical mobility - Same house 1 year ago (%) - Multirace
Geographical mobility - Same house 1 year ago (%) - Other Race
Geographical mobility - Moved within same county (%)
Geographical mobility - Moved within same county (%) - White
Geographical mobility - Moved within same county (%) - Black or African American
Geographical mobility - Moved within same county (%) - Asian
Geographical mobility - Moved within same county (%) - Hispanic or Latino
Geographical mobility - Moved within same county (%) - American Indian and Alaska Native
Geographical mobility - Moved within same county (%) - Multirace
Geographical mobility - Moved within same county (%) - Other Race
Geographical mobility - Moved from different county within same state (%)
Geographical mobility - Moved from different county within same state (%) - White
Geographical mobility - Moved from different county within same state (%) - Black or African American
Geographical mobility - Moved from different county within same state (%) - Asian
Geographical mobility - Moved from different county within same state (%) - Hispanic or Latino
Geographical mobility - Moved from different county within same state (%) - American Indian and Alaska Native
Geographical mobility - Moved from different county within same state (%) - Multirace
Geographical mobility - Moved from different county within same state (%) - Other Race
Geographical mobility - Moved from different state (%)
Geographical mobility - Moved from different state (%) - White
Geographical mobility - Moved from different state (%) - Black or African American
Geographical mobility - Moved from different state (%) - Asian
Geographical mobility - Moved from different state (%) - Hispanic or Latino
Geographical mobility - Moved from different state (%) - American Indian and Alaska Native
Geographical mobility - Moved from different state (%) - Multirace
Geographical mobility - Moved from different state (%) - Other Race
Geographical mobility - Moved from abroad (%)
Geographical mobility - Moved from abroad (%) - White
Geographical mobility - Moved from abroad (%) - Black or African American
Geographical mobility - Moved from abroad (%) - Asian
Geographical mobility - Moved from abroad (%) - Hispanic or Latino
Geographical mobility - Moved from abroad (%) - American Indian and Alaska Native
Geographical mobility - Moved from abroad (%) - Multirace
Geographical mobility - Moved from abroad (%) - Other Race
Place of birth for the foreign-born population - Ireland (%)
Place of birth for the foreign-born population - Denmark (%)
Place of birth for the foreign-born population - Norway (%)
Place of birth for the foreign-born population - Sweden (%)
Place of birth for the foreign-born population - United Kingdom (%)
Place of birth for the foreign-born population - England (%)
Place of birth for the foreign-born population - Scotland (%)
Place of birth for the foreign-born population - Other Northern Europe (%)
Place of birth for the foreign-born population - Austria (%)
Place of birth for the foreign-born population - Belgium (%)
Place of birth for the foreign-born population - France (%)
Place of birth for the foreign-born population - Germany (%)
Place of birth for the foreign-born population - Netherlands (%)
Place of birth for the foreign-born population - Switzerland (%)
Place of birth for the foreign-born population - Other Western Europe (%)
Place of birth for the foreign-born population - Greece (%)
Place of birth for the foreign-born population - Italy (%)
Place of birth for the foreign-born population - Portugal (%)
Place of birth for the foreign-born population - Spain (%)
Place of birth for the foreign-born population - Other Southern Europe (%)
Place of birth for the foreign-born population - Albania (%)
Place of birth for the foreign-born population - Belarus (%)
Place of birth for the foreign-born population - Bosnia and Herzegovina (%)
Place of birth for the foreign-born population - Bulgaria (%)
Place of birth for the foreign-born population - Croatia (%)
Place of birth for the foreign-born population - Czechoslovakia (%)
Place of birth for the foreign-born population - Hungary (%)
Place of birth for the foreign-born population - Latvia (%)
Place of birth for the foreign-born population - Lithuania (%)
Place of birth for the foreign-born population - North Macedonia (Macedonia) (%)
Place of birth for the foreign-born population - Moldova (%)
Place of birth for the foreign-born population - Poland (%)
Place of birth for the foreign-born population - Romania (%)
Place of birth for the foreign-born population - Russia (%)
Place of birth for the foreign-born population - Serbia (%)
Place of birth for the foreign-born population - Ukraine (%)
Place of birth for the foreign-born population - Other Eastern Europe (%)
Place of birth for the foreign-born population - China (%)
Place of birth for the foreign-born population - Hong Kong (%)
Place of birth for the foreign-born population - Taiwan (%)
Place of birth for the foreign-born population - Japan (%)
Place of birth for the foreign-born population - Korea (%)
Place of birth for the foreign-born population - Other Eastern Asia (%)
Place of birth for the foreign-born population - Afghanistan (%)
Place of birth for the foreign-born population - Bangladesh (%)
Place of birth for the foreign-born population - India (%)
Place of birth for the foreign-born population - Iran (%)
Place of birth for the foreign-born population - Kazakhstan (%)
Place of birth for the foreign-born population - Nepal (%)
Place of birth for the foreign-born population - Pakistan (%)
Place of birth for the foreign-born population - Sri Lanka (%)
Place of birth for the foreign-born population - Uzbekistan (%)
Place of birth for the foreign-born population - Other South Central Asia (%)
Place of birth for the foreign-born population - Burma (%)
Place of birth for the foreign-born population - Cambodia (%)
Place of birth for the foreign-born population - Indonesia (%)
Place of birth for the foreign-born population - Laos (%)
Place of birth for the foreign-born population - Malaysia (%)
Place of birth for the foreign-born population - Philippines (%)
Place of birth for the foreign-born population - Singapore (%)
Place of birth for the foreign-born population - Thailand (%)
Place of birth for the foreign-born population - Vietnam (%)
Place of birth for the foreign-born population - Other South Eastern Asia (%)
Place of birth for the foreign-born population - Armenia (%)
Place of birth for the foreign-born population - Iraq (%)
Place of birth for the foreign-born population - Israel (%)
Place of birth for the foreign-born population - Jordan (%)
Place of birth for the foreign-born population - Kuwait (%)
Place of birth for the foreign-born population - Lebanon (%)
Place of birth for the foreign-born population - Saudi Arabia (%)
Place of birth for the foreign-born population - Syria (%)
Place of birth for the foreign-born population - Turkey (%)
Place of birth for the foreign-born population - Yemen (%)
Place of birth for the foreign-born population - Other Western Asia (%)
Place of birth for the foreign-born population - Eritrea (%)
Place of birth for the foreign-born population - Ethiopia (%)
Place of birth for the foreign-born population - Kenya (%)
Place of birth for the foreign-born population - Somalia (%)
Place of birth for the foreign-born population - Uganda (%)
Place of birth for the foreign-born population - Zimbabwe (%)
Place of birth for the foreign-born population - Other Eastern Africa (%)
Place of birth for the foreign-born population - Cameroon (%)
Place of birth for the foreign-born population - Congo (%)
Place of birth for the foreign-born population - Democratic Republic of Congo (Zaire) (%)
Place of birth for the foreign-born population - Other Middle Africa (%)
Place of birth for the foreign-born population - Egypt (%)
Place of birth for the foreign-born population - Morocco (%)
Place of birth for the foreign-born population - Sudan (%)
Place of birth for the foreign-born population - Other Northern Africa (%)
Place of birth for the foreign-born population - South Africa (%)
Place of birth for the foreign-born population - Other Southern Africa (%)
Place of birth for the foreign-born population - Cabo Verde (%)
Place of birth for the foreign-born population - Ghana (%)
Place of birth for the foreign-born population - Liberia (%)
Place of birth for the foreign-born population - Nigeria (%)
Place of birth for the foreign-born population - Senegal (%)
Place of birth for the foreign-born population - Sierra Leone (%)
Place of birth for the foreign-born population - Other Western Africa (%)
Place of birth for the foreign-born population - Australia (%)
Place of birth for the foreign-born population - New Zealand (%)
Place of birth for the foreign-born population - Fiji (%)
Place of birth for the foreign-born population - Micronesia (%)
Place of birth for the foreign-born population - Bahamas (%)
Place of birth for the foreign-born population - Barbados (%)
Place of birth for the foreign-born population - Cuba (%)
Place of birth for the foreign-born population - Dominica (%)
Place of birth for the foreign-born population - Dominican Republic (%)
Place of birth for the foreign-born population - Grenada (%)
Place of birth for the foreign-born population - Haiti (%)
Place of birth for the foreign-born population - Jamaica (%)
Place of birth for the foreign-born population - St. Vincent and the Grenadines (%)
Place of birth for the foreign-born population - Trinidad and Tobago (%)
Place of birth for the foreign-born population - West Indies (%)
Place of birth for the foreign-born population - Other Caribbean (%)
Place of birth for the foreign-born population - Belize (%)
Place of birth for the foreign-born population - Costa Rica (%)
Place of birth for the foreign-born population - El Salvador (%)
Place of birth for the foreign-born population - Guatemala (%)
Place of birth for the foreign-born population - Honduras (%)
Place of birth for the foreign-born population - Mexico (%)
Place of birth for the foreign-born population - Nicaragua (%)
Place of birth for the foreign-born population - Panama (%)
Place of birth for the foreign-born population - Other Central America (%)
Place of birth for the foreign-born population - Argentina (%)
Place of birth for the foreign-born population - Bolivia (%)
Place of birth for the foreign-born population - Brazil (%)
Place of birth for the foreign-born population - Chile (%)
Place of birth for the foreign-born population - Colombia (%)
Place of birth for the foreign-born population - Ecuador (%)
Place of birth for the foreign-born population - Guyana (%)
Place of birth for the foreign-born population - Peru (%)
Place of birth for the foreign-born population - Uruguay (%)
Place of birth for the foreign-born population - Venezuela (%)
Place of birth for the foreign-born population - Other South America (%)
Place of birth for the foreign-born population - Canada (%)
Place of birth for the foreign-born population - Other Northern America (%)
Place of birth for the foreign-born population - Other (%)
Latest news about races in Westlake, OH collected exclusively by city-data.com from local newspapers, TV, and radio stations
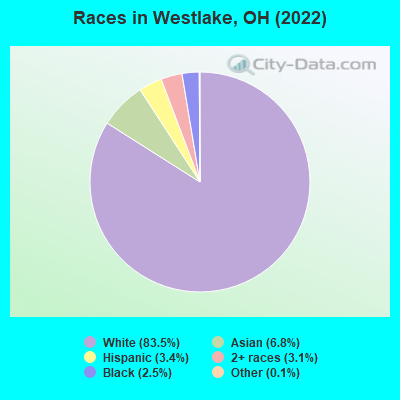
According to 2022 data, the most numerous races in Westlake, OH are White alone (27,959 residents), Black alone (829 residents), and Two or more races (1,042 residents). 85.2% of Westlake residents speak English at home. 12.5% of Westlake, OH residents are foreign-born (7.0% born in Asia, 3.0% born in Europe), which is 67.9% greater than the foreign-born rate of 4.0% across the entire state of Ohio.
Race distribution in Westlake
2000 2022
9,538,111 84.0% White alone 1,290,662 11.4% Black alone 217,123 1.9% Hispanic 137,770 1.2% Two or more races 131,670 1.2% Asian alone 21,985 0.2% American Indian alone 13,483 0.1% Other race alone 2,336 0.02% Native Hawaiian and Other
8,948,793 76.1% White alone 1,401,403 11.9% Black alone 529,291 4.5% Two or more races 517,232 4.4% Hispanic 293,387 2.5% Asian alone 52,805 0.4% Other race alone 9,785 0.08% American Indian alone 3,362 0.03% Native Hawaiian and Other
Income and house value in Westlake Median household income in 2022 $104,247 White non-Hispanic householders$56,673 Black householders$100,761 Two or more races householders$41,913 Hispanic or Latino race householdersMedian 2022 house value $373,111 White Non-Hispanic householders$420,802 Black or African American householders $464,192 Asian householders$257,157 Some other race householders$309,710 Two or more races householders$302,791 Hispanic or Latino householders
Median age by race in Westlake
49.2 Median age for White residents47.8 51.1 46.8 Median age for Black or African American residents33.4 53.2 44.3 Median age for American Indian / Alaska Native residents-734,374,999.3 -499,999,999.5 45.0 Median age for Asian residents46.2 41.6 -706,093,189.3 Median age for Native Hawaiian / Pacific Islander residents-750,242,953.6 -805,394,989.6 42.3 Median age for Other race residents37.1 43.0 18.9 Median age for Two or more races residents19.6 18.9 49.3 Median age for White alone residents47.9 51.2 26.2 Median age for Hispanic or Latino residents26.1 24.0
Owner/renter occupied households by race in Westlake
House owners and renters - White residents 9,568 74.8% Owner occupied3,222 25.2% Renter occupiedHouse owners and renters - Black or African American residents 112 34.2% Owner occupied215 65.8% Renter occupiedHouse owners and renters - American Indian / Alaska Native residents 7 100.0% Owner occupiedHouse owners and renters - Asian residents 686 75.0% Owner occupied228 25.0% Renter occupiedHouse owners and renters - Other race residents 10 10.7% Owner occupied81 89.3% Renter occupiedHouse owners and renters - Two or more races residents 177 48.5% Owner occupied188 51.5% Renter occupiedHouse owners and renters - White alone residents 9,578 75.0% Owner occupied3,198 25.0% Renter occupiedHouse owners and renters - Hispanic or Latino residents 132 35.9% Owner occupied236 64.1% Renter occupied
Language usage in Westlake
English speakers - Total 85.2% of residents of Westlake speak English at home.
1.1% of residents speak Spanish at home 153 41.9% Speak English very well212 58.1% Speak English less than very well14.2% of residents speak other language at home 3,784 83.2% Speak English very well763 16.8% Speak English less than very well
English speakers - Born in the United States 91.4% of residents of Westlake speak English at home.
0.2% of residents speak Spanish at home 12 75.0% Speak English very well4 25.0% Speak English less than very well10.4% of residents speak other language at home 651 95.0% Speak English very well34 5.0% Speak English less than very well
English speakers - Native, born elsewhere 52.0% of residents of Westlake speak English at home.
14.5% of residents speak Spanish at home 40 100.0% Speak English very well24.4% of residents speak other language at home 67 100.0% Speak English very well
English speakers - Foreign-born 20.2% of residents of Westlake speak English at home.
6.6% of residents speak Spanish at home 32 12.0% Speak English very well234 88.0% Speak English less than very well75.4% of residents speak other language at home 2,337 77.3% Speak English very well687 22.7% Speak English less than very well
White (Caucasian) - Speak only English Native:
96.5% (23,896)Foreign-born:
23.4% (449)
White (Caucasian) - Speak another language Native:
3.6% (899)Foreign-born:
76.5% (1,465)
Black or African American - Speak only English Native:
89.5% (738)Foreign-born:
59.4% (27)
Black or African American - Speak another language Native:
7.5% (61)Foreign-born:
3.3% (2)
American Indian / Alaska Native - Speak only English Native:
89.9% (16)Foreign-born:
100.0% (3)
Asian - Speak only English Native:
70.4% (476)Foreign-born:
12.8% (201)
Asian - Speak another language Native:
26.7% (181)Foreign-born:
87.2% (1,361)
Other race - Speak only English Native:
28.2% (41)Foreign-born:
19.3% (23)
Other race - Speak another language Native:
75.1% (109)Foreign-born:
92.9% (110)
Two or more races - Speak only English Native:
87.8% (1,089)Foreign-born:
91.4% (195)
Two or more races - Speak another language Native:
10.0% (124)Foreign-born:
3.7% (8)
White alone - Speak only English Native:
95.3% (23,657)Foreign-born:
23.9% (456)
White alone - Speak another language Native:
4.7% (1,170)Foreign-born:
76.1% (1,450)
Hispanic or Latino - Speak only English Native:
84.0% (601)Foreign-born:
22.5% (77)
Hispanic or Latino - Speak another language Native:
17.6% (126)Foreign-born:
69.4% (238)
Foreign-born residents in Westlake 4,172 residents are foreign born (7.0% Asia , 3.0% Europe ).
Marital status for residents in Westlake Marital status - White (Caucasian) population 15 years and over
Males 32.1% Never married56.3% Now married0.6% Separated3.2% Widowed7.8% DivorcedFemales 23.9% Never married51.0% Now married0.4% Separated12.9% Widowed11.7% DivorcedWomen who gave birth in the past 12 months Now married:
72.1% (158)Unmarried:
27.9% (61)
Women who did not give birth in the past 12 months Now married:
46.4% (2,329)Unmarried:
53.6% (2,692)
Marital status - Black or African American population 15 years and over
Males 68.0% Never married19.3% Now married1.0% Separated2.0% Widowed9.8% DivorcedFemales 57.3% Never married19.0% Now married0.0% Separated9.9% Widowed13.8% DivorcedWomen who did not give birth in the past 12 months Now married:
11.8% (21)Unmarried:
88.2% (155)
Marital status - American Indian / Alaska Native population 15 years and over
Males 80.0% Never married20.0% Now married0.0% Separated0.0% Widowed0.0% DivorcedFemales 0.0% Never married100.0% Now married0.0% Separated0.0% Widowed0.0% DivorcedMarital status - Asian population 15 years and over
Males 20.9% Never married77.6% Now married0.0% Separated0.0% Widowed1.5% DivorcedFemales 16.1% Never married76.4% Now married0.0% Separated3.5% Widowed4.0% DivorcedWomen who did not give birth in the past 12 months Now married:
69.2% (400)Unmarried:
30.8% (178)
Marital status - Other race population 15 years and over
Males 18.5% Never married81.5% Now married0.0% Separated0.0% Widowed0.0% DivorcedFemales 45.5% Never married54.5% Now married0.0% Separated0.0% Widowed0.0% DivorcedWomen who did not give birth in the past 12 months Now married:
58.1% (71)Unmarried:
41.9% (51)
Marital status - Two or more races population 15 years and over
Males 54.3% Never married42.9% Now married0.0% Separated0.0% Widowed2.8% DivorcedFemales 64.3% Never married15.4% Now married0.0% Separated4.1% Widowed16.2% DivorcedWomen who gave birth in the past 12 months Now married:
100.0% (39)Unmarried:
0.0% (0)
Women who did not give birth in the past 12 months Now married:
0.0% (0)Unmarried:
100.0% (446)
Marital status - White alone, not Hispanic / Latino population 15 years and over
Males 31.5% Never married56.9% Now married0.6% Separated3.3% Widowed7.8% DivorcedFemales 23.9% Never married51.1% Now married0.4% Separated12.8% Widowed11.8% DivorcedWomen who gave birth in the past 12 months Now married:
72.1% (162)Unmarried:
27.9% (63)
Women who did not give birth in the past 12 months Now married:
46.2% (2,355)Unmarried:
53.8% (2,747)
Marital status - Hispanic or Latino population 15 years and over
Males 56.2% Never married37.0% Now married0.0% Separated0.0% Widowed6.8% DivorcedFemales 40.6% Never married30.4% Now married0.0% Separated7.7% Widowed21.3% DivorcedWomen who did not give birth in the past 12 months Now married:
30.8% (93)Unmarried:
69.2% (209)
Ancestries in Westlake
1,477 10.8% German1,349 9.8% Irish1,323 9.6% American801 5.8% Italian738 5.4% Polish436 3.2% English331 2.4% Palestinian287 2.1% Hungarian270 2.0% European259 1.9% Slovak229 1.7% Arab181 1.3% Greek161 1.2% Romanian153 1.1% Lebanese147 1.1% Slovene107 0.8% Eastern European99 0.7% Albanian94 0.7% African88 0.6% French86 0.6% Czech80 0.6% Syrian71 0.5% Swiss63 0.5% Serbian62 0.5% Bulgarian62 0.5% Armenian61 0.4% Croatian57 0.4% Scottish50 0.4% Dutch44 0.3% Swedish43 0.3% British40 0.3% French Canadian39 0.3% New Zealander39 0.3% Northern European33 0.2% Russian29 0.2% Turkish27 0.2% Austrian27 0.2% Iranian27 0.2% Ethiopian26 0.2% Nigerian24 0.2% Finnish23 0.2% Scandinavian22 0.2% Czechoslovakian20 0.1% Canadian14 0.1% Norwegian12 0.09% Guyanese11 0.08% Ukrainian10 0.07% Scotch-Irish9 0.07% Icelander9 0.07% South African
Geographical mobility in Westlake Same house 1 year ago 24,501 88.3% White (Caucasian)694 80.3% Black or African American22 100.0% American Indian / Alaska Native1,893 83.1% Asian245 85.0% Other race1,394 84.7% Two or more races24,429 87.9% White alone, not Hispanic / Latino990 87.7% Hispanic or LatinoMoved within same county 1,823 6.6% White / Caucasian112 13.0% Black or African American287 12.6% Asian9 3.3% Other race173 10.5% Two or more races1,883 6.8% White alone, not Hispanic / Latino58 5.1% Hispanic or LatinoMoved within same state 817 2.9% White / Caucasian36 4.2% Black or African American67 3.0% Asian823 3.0% White alone, not Hispanic / Latino47 4.1% Hispanic or LatinoMoved from different state 637 2.3% White / Caucasian17 0.8% Asian14 4.9% Other race41 2.5% Two or more races675 2.4% White alone, not Hispanic / Latino19 1.7% Hispanic or LatinoMoved from abroad 21 0.1% White17 2.0% Black or African American36 1.6% Asian35 2.1% Two or more races27 0.1% White alone, not Hispanic / Latino
Children Nativity (place of birth) in Westlake
Children under 6 years - Living with two parents Both parents native 1,010 100.0% NativeBoth parents foreign-born 163 100.0% NativeOne native, one foreign-born parent 182 100.0% NativeChildren under 6 years - Living with one parent Native parent 359 100.0% NativeForeign-born parent 33 100.0% NativeChildren 6 to 17 years - Living with two parents Both parents native 2,980 99.5% Native14 0.5% Foreign-bornBoth parents foreign-born 403 70.0% Native172 30.0% Foreign-bornOne native, one foreign-born parent 204 91.5% Native19 8.5% Foreign-bornChildren 6 to 17 years - Living with one parent Native parent 748 100.0% NativeForeign-born parent 121 53.9% Native103 46.1% Foreign-born
Grandparents responsible for own grandchildren in Westlake
Grandparents (30 to 59 years) White / Caucasian 21 14.6% Responsible for grandchildren124 85.4% Not responsible for grandchildrenAsian 32 100.0% Responsible for grandchildrenWhite alone, not Hispanic / Latino 22 15.4% Responsible for grandchildren123 84.6% Not responsible for grandchildrenGrandparents (60 years and over) White / Caucasian 24 18.7% Responsible for grandchildren103 81.3% Not responsible for grandchildrenAsian 17 35.2% Responsible for grandchildren31 64.8% Not responsible for grandchildrenWhite alone, not Hispanic / Latino 24 18.4% Responsible for grandchildren108 81.6% Not responsible for grandchildren