Races in Wickliffe, Ohio (OH) Detailed Stats
Ancestries, Foreign-born residents, place of birth
Settings
X


Recent posts about races in Wickliffe, Ohio on our local forum with over 2,400,000 registered users:
 | Eastlake vs Amhurst? please rate and compare... (28 replies) |
| Cleveland's Real Estate Market is driving us crazy. (24 replies) |
| Need Advice about Cleaveland Inner ring suburbs - STAT!!! (20 replies) |
| Fairport Harbor - Painesville area (44 replies) |
| Dave's Markets to close North Collinwood location at Euclid Beach (21 replies) |
| How to attract more young educated people? (139 replies) |
Latest news about races in Wickliffe, OH collected exclusively by city-data.com from local newspapers, TV, and radio stations
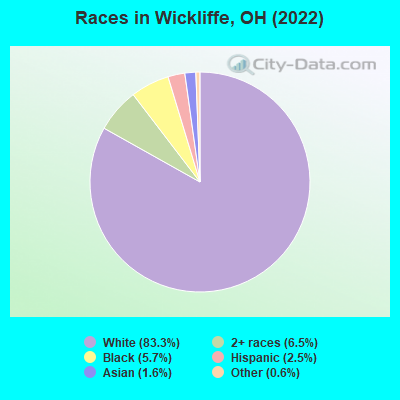
According to 2022 data, the most numerous races in Wickliffe, OH are White alone (10,524 residents), Black alone (723 residents), and Two or more races (823 residents). 96.3% of Wickliffe residents speak English at home. 3.3% of Wickliffe, OH residents are foreign-born (1.6% born in Europe, 1.1% born in Asia, 0.5% born in Latin America), which is 19.8% less than the foreign-born rate of 4.0% across the entire state of Ohio.
Race distribution in Wickliffe
2000
2022

- 12,81095.0%White alone
- 3812.8%Black alone
- 1030.8%Two or more races
- 1050.8%Asian alone
- 720.5%Hispanic
- 50.04%Other race alone
- 60.04%American Indian alone
- 20.01%Native Hawaiian and Other
Pacific Islander alone

-
- 10,52483.3%White alone
- 8236.5%Two or more races
- 7235.7%Black alone
- 3212.5%Hispanic
- 2031.6%Asian alone
- 700.6%Other race alone
- 20.02%Native Hawaiian and Other
Pacific Islander alone
2000
2022
-
- 9,538,11184.0%White alone
- 1,290,66211.4%Black alone
- 217,1231.9%Hispanic
- 137,7701.2%Two or more races
- 131,6701.2%Asian alone
- 21,9850.2%American Indian alone
- 13,4830.1%Other race alone
- 2,3360.02%Native Hawaiian and Other
Pacific Islander alone

-
- 8,948,79376.1%White alone
- 1,401,40311.9%Black alone
- 529,2914.5%Two or more races
- 517,2324.4%Hispanic
- 293,3872.5%Asian alone
- 52,8050.4%Other race alone
- 9,7850.08%American Indian alone
- 3,3620.03%Native Hawaiian and Other
Pacific Islander alone

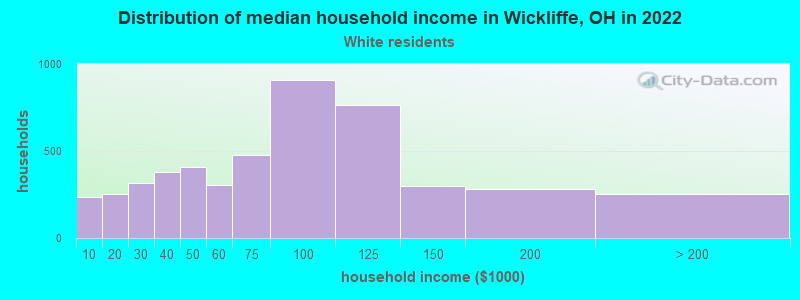
Income and house value in Wickliffe
- Median household income in 2022
- $75,801White non-Hispanic householders
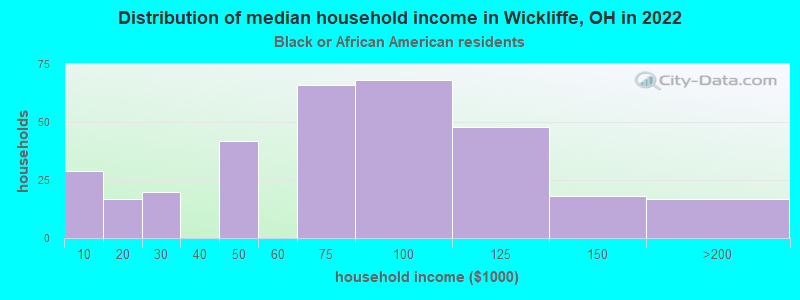
- $55,925Black householders
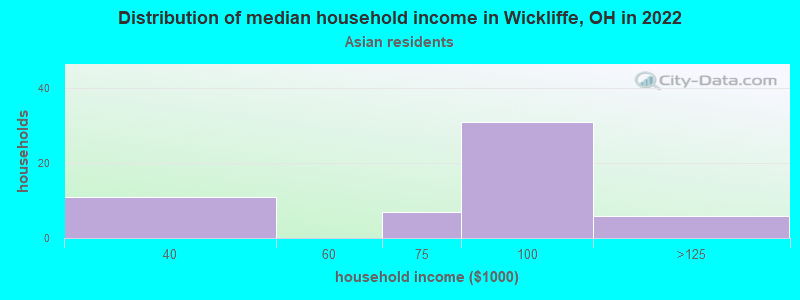
- $85,010Asian householders
- $115,784Two or more races householders
- $83,580Hispanic or Latino race householders
- Median 2022 house value
- $163,072White Non-Hispanic householders
- $101,565Black or African American householders
- $148,583Asian householders
- $153,555Two or more races householders
- $159,805Hispanic or Latino householders
Household income for White non-Hispanic householders
Household income for Black householders
Household income for Asian householders
Household income for Some other race householders
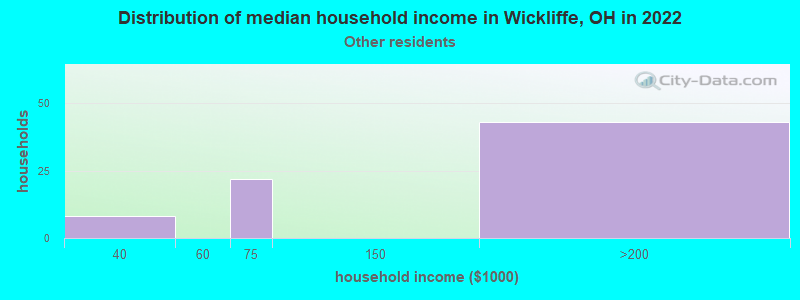
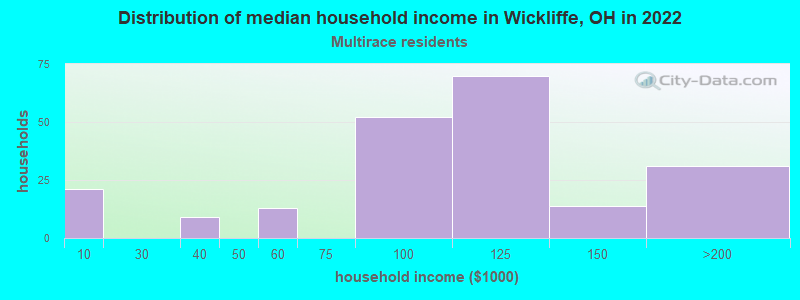
Household income for Two or more races householders
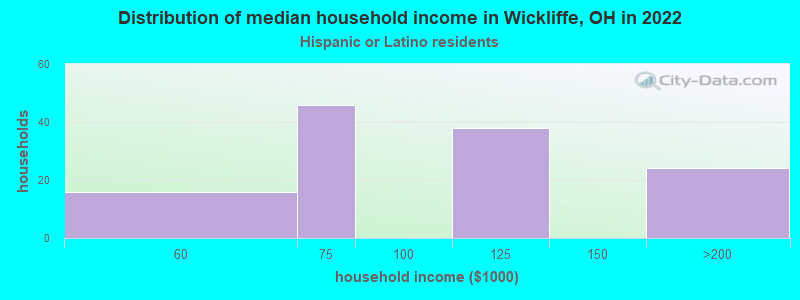
Household income for Hispanic or Latino race householders
Median age by race in Wickliffe
- 46.3Median age for White residents
- 45.3Males
- 49.5Females
- 37.8Median age for Black or African American residents
- 26.4Males
- 40.1Females
- -676,818,950.3Median age for American Indian / Alaska Native residents
- -685,185,184.5Males
- -658,163,264.6Females
- 45.6Median age for Asian residents
- 14.0Males
- 50.5Females
- -800,387,596.1Median age for Native Hawaiian / Pacific Islander residents
- -750,242,953.6Males
- -805,394,989.6Females
- 33.6Median age for Other race residents
- -520,202,019.7Males
- 58.6Females
- 20.3Median age for Two or more races residents
- 18.9Males
- 25.0Females
- 46.7Median age for White alone residents
- 45.2Males
- 50.1Females
- 20.5Median age for Hispanic or Latino residents
- 18.9Males
- 27.4Females
Owner/renter occupied households by race in Wickliffe
- House owners and renters - White residents
- 4,03282.5%Owner occupied
- 85517.5%Renter occupied
- House owners and renters - Black or African American residents
- 9530.3%Owner occupied
- 21969.7%Renter occupied
- House owners and renters - Asian residents
- 78100.0%Owner occupied
- House owners and renters - Other race residents
- 112100.0%Owner occupied
- House owners and renters - Two or more races residents
- 21491.4%Owner occupied
- 208.6%Renter occupied
- House owners and renters - White alone residents
- 3,96582.0%Owner occupied
- 87218.0%Renter occupied
- House owners and renters - Hispanic or Latino residents
- 166100.0%Owner occupied
Language usage in Wickliffe
- English speakers - Total
- 96.3% of residents of Wickliffe speak English at home.
- 0.3% of residents speak Spanish at home
- 40100.0%Speak English very well
- 3.5% of residents speak other language at home
- 22554.2%Speak English very well
- 19045.8%Speak English less than very well
- English speakers - Born in the United States
- 97.4% of residents of Wickliffe speak English at home.
- 0.2% of residents speak Spanish at home
- 3100.0%Speak English very well
- 2.6% of residents speak other language at home
- 51100.0%Speak English very well
All residents speak only English at home
- English speakers - Foreign-born
- 29.9% of residents of Wickliffe speak English at home.
- 2.4% of residents speak Spanish at home
- 8100.0%Speak English very well
- 69.8% of residents speak other language at home
- 8436.4%Speak English very well
- 14763.6%Speak English less than very well
White (Caucasian) - Speak only English
| Native: | 98.9% (9,962) |
| Foreign-born: | 25.6% (35) |
White (Caucasian) - Speak another language
| Native: | 1.3% (128) |
| Foreign-born: | 72.7% (98) |
Asian - Speak only English
| Native: | 100.0% (35) |
| Foreign-born: | 16.8% (21) |
Other race - Speak only English
| Native: | 77.5% (75) |
| Foreign-born: | 92.4% (18) |
Two or more races - Speak only English
| Native: | 91.9% (795) |
| Foreign-born: | 66.1% (30) |
White alone - Speak only English
| Native: | 98.5% (9,791) |
| Foreign-born: | 23.6% (38) |
White alone - Speak another language
| Native: | 1.5% (147) |
| Foreign-born: | 74.5% (118) |
Hispanic or Latino - Speak only English
| Native: | 78.2% (226) |
| Foreign-born: | 88.9% (21) |
Hispanic or Latino - Speak another language
| Native: | 3.1% (9) |
| Foreign-born: | 31.0% (7) |
Foreign-born residents in Wickliffe
422 residents are foreign born (1.6% Europe, 1.1% Asia, 0.5% Latin America).
| This city: | 3.3% |
| Ohio: | 4.9% |


Marital status for residents in Wickliffe
Marital status - White (Caucasian) population 15 years and over
- Males
- 35.1%Never married
- 44.3%Now married
- 0.3%Separated
- 3.5%Widowed
- 16.7%Divorced
- Females
- 29.3%Never married
- 42.6%Now married
- 1.4%Separated
- 14.9%Widowed
- 11.8%Divorced
Women who gave birth in the past 12 months
| Now married: | 80.3% (109) |
| Unmarried: | 19.7% (27) |
Women who did not give birth in the past 12 months
| Now married: | 34.8% (666) |
| Unmarried: | 65.2% (1,250) |
Marital status - Black or African American population 15 years and over
- Males
- 53.7%Never married
- 42.6%Now married
- 0.0%Separated
- 3.7%Widowed
- 0.0%Divorced
- Females
- 63.5%Never married
- 19.3%Now married
- 1.9%Separated
- 5.9%Widowed
- 9.4%Divorced
Women who did not give birth in the past 12 months
| Now married: | 6.0% (15) |
| Unmarried: | 94.0% (231) |
Marital status - Asian population 15 years and over
- Males
- 9.3%Never married
- 90.7%Now married
- 0.0%Separated
- 0.0%Widowed
- 0.0%Divorced
- Females
- 14.7%Never married
- 61.3%Now married
- 24.0%Separated
- 0.0%Widowed
- 0.0%Divorced
Women who did not give birth in the past 12 months
| Now married: | 81.4% (48) |
| Unmarried: | 18.6% (11) |
Marital status - Other race population 15 years and over
- Males
- 0.0%Never married
- 100.0%Now married
- 0.0%Separated
- 0.0%Widowed
- 0.0%Divorced
- Females
- 24.4%Never married
- 20.0%Now married
- 20.0%Separated
- 35.6%Widowed
- 0.0%Divorced
Women who did not give birth in the past 12 months
| Now married: | 45.0% (12) |
| Unmarried: | 55.0% (15) |
Marital status - Two or more races population 15 years and over
- Males
- 69.6%Never married
- 28.7%Now married
- 0.0%Separated
- 0.0%Widowed
- 1.7%Divorced
- Females
- 48.6%Never married
- 43.7%Now married
- 0.0%Separated
- 0.0%Widowed
- 7.7%Divorced
Women who did not give birth in the past 12 months
| Now married: | 34.8% (73) |
| Unmarried: | 65.2% (137) |
Marital status - White alone, not Hispanic / Latino population 15 years and over
- Males
- 35.1%Never married
- 44.2%Now married
- 0.3%Separated
- 3.6%Widowed
- 16.9%Divorced
- Females
- 29.4%Never married
- 42.1%Now married
- 1.4%Separated
- 15.1%Widowed
- 12.0%Divorced
Women who gave birth in the past 12 months
| Now married: | 80.3% (111) |
| Unmarried: | 19.7% (27) |
Women who did not give birth in the past 12 months
| Now married: | 33.7% (639) |
| Unmarried: | 66.3% (1,255) |
Marital status - Hispanic or Latino population 15 years and over
- Males
- 35.1%Never married
- 64.9%Now married
- 0.0%Separated
- 0.0%Widowed
- 0.0%Divorced
- Females
- 29.1%Never married
- 62.8%Now married
- 0.0%Separated
- 8.1%Widowed
- 0.0%Divorced
Women who did not give birth in the past 12 months
| Now married: | 60.3% (46) |
| Unmarried: | 39.7% (30) |
Ancestries in Wickliffe

- 74915.4%Italian
- 60412.4%German
- 3346.8%Eastern European
- 3256.7%American
- 2956.0%English
- 2465.0%Slovene
- 2034.2%Irish
- 1823.7%Croatian
- 1513.1%Slovak
- 1192.4%Polish
- 1052.2%Scottish
- 731.5%Scotch-Irish
- 471.0%Lithuanian
- 420.9%Hungarian
- 400.8%European
- 360.7%Ukrainian
- 190.4%Norwegian
- 180.4%Brazilian
- 170.3%Finnish
- 150.3%Dutch
- 150.3%Swedish
- 140.3%Lebanese
- 140.3%French
- 130.3%Welsh
- 120.2%Yugoslavian
- 100.2%African
- 90.2%Czechoslovakian
- 90.2%Icelander
- 90.2%Romanian
- 80.2%Czech
- 40.08%Pennsylvania German
- 30.06%Russian
- 30.06%Swiss

Geographical mobility in Wickliffe

- Same house 1 year ago
- 9,48390.3%White (Caucasian)
- 60780.4%Black or African American
- 11456.0%Asian
- 2100.0%Native Hawaiian / Pacific Islander
- 10090.9%Other race
- 90886.3%Two or more races
- 9,39390.2%White alone, not Hispanic / Latino
- 29993.1%Hispanic or Latino

-
- Moved within same county
- 7086.7%White / Caucasian
- 10814.3%Black or African American
- 8642.5%Asian
- 86.9%Other race
- 948.9%Two or more races
- 7146.9%White alone, not Hispanic / Latino
- 247.5%Hispanic or Latino

-
- Moved within same state
- 2412.3%White / Caucasian
- 233.1%Black or African American
- 181.7%Two or more races
- 2402.3%White alone, not Hispanic / Latino

-
- Moved from different state
- 500.5%White / Caucasian
- 81.0%Black or African American
- 510.5%White alone, not Hispanic / Latino

-
- Moved from abroad
- 70.1%White
- 70.1%White alone, not Hispanic / Latino

Children Nativity (place of birth) in Wickliffe
Place of birth for residents in Wickliffe
![Place of birth for the foreign-born population - Regions]()
- 206Europe
- 140Asia
- 137Eastern Europe
- 118South Eastern Asia
- 75Americas
- 67Latin America
- 44South America
- 33Southern Europe
- 27Northern Europe
- 23Central America
- 12Western Asia
- 8Western Europe
- 8Northern America
- 7Eastern Asia
- 2South Central Asia

![Place of birth for the foreign-born population - Countries]()
- 51Philippines
- 46Vietnam
- 33Italy
- 33Bosnia and Herzegovina
- 25Guyana
- 23Mexico
- 18England
- 12Lebanon
- 11Cambodia
- 11Brazil
- 10Laos
- 8Germany
- 8Croatia
- 8Canada
- 7Korea
- 7Bolivia
- 2Pakistan

Grandparents responsible for own grandchildren in Wickliffe
Zip codes: 44092.