Races in Willard, Ohio (OH) Detailed Stats
Data:
Races - White alone (%)
Races - White alone (% change since 2000)
Races - Black alone (%)
Races - Black alone (% change since 2000)
Races - American Indian alone (%)
Races - American Indian alone (% change since 2000)
Races - Asian alone (%)
Races - Asian alone (% change since 2000)
Races - Hispanic (%)
Races - Hispanic (% change since 2000)
Races - Native Hawaiian and Other Pacific Islander alone (%)
Races - Native Hawaiian and Other Pacific Islander alone (% change since 2000)
Races - Two or more races(%)
Races - Two or more races(% change since 2000)
Races - Other race alone (%)
Races - Other race alone (% change since 2000)
Racial diversity
Place of birth - Born in state of residence (%)
Place of birth - Born in state of residence (%) - White
Place of birth - Born in state of residence (%) - Black or African American
Place of birth - Born in state of residence (%) - Asian
Place of birth - Born in state of residence (%) - Hispanic or Latino
Place of birth - Born in state of residence (%) - American Indian and Alaska Native
Place of birth - Born in state of residence (%) - Multirace
Place of birth - Born in state of residence (%) - Other Race
Place of birth - Born in other state (%)
Place of birth - Born in other state (%) - White
Place of birth - Born in other state (%) - Black or African American
Place of birth - Born in other state (%) - Asian
Place of birth - Born in other state (%) - Hispanic or Latino
Place of birth - Born in other state (%) - American Indian and Alaska Native
Place of birth - Born in other state (%) - Multirace
Place of birth - Born in other state (%) - Other Race
Place of birth - Native, outside of US (%)
Place of birth - Native, outside of US (%) - White
Place of birth - Native, outside of US (%) - Black or African American
Place of birth - Native, outside of US (%) - Asian
Place of birth - Native, outside of US (%) - Hispanic or Latino
Place of birth - Native, outside of US (%) - American Indian and Alaska Native
Place of birth - Native, outside of US (%) - Multirace
Place of birth - Native, outside of US (%) - Other Race
Place of birth - Foreign born (%)
Place of birth - Foreign born (%) - White
Place of birth - Foreign born (%) - Black or African American
Place of birth - Foreign born (%) - Asian
Place of birth - Foreign born (%) - Hispanic or Latino
Place of birth - Foreign born (%) - American Indian and Alaska Native
Place of birth - Foreign born (%) - Multirace
Place of birth - Foreign born (%) - Other Race
Residents speaking English at home (%)
Residents speaking English at home - Born in the United States (%)
Residents speaking English at home - Native, born elsewhere (%)
Residents speaking English at home - Foreign born (%)
Residents speaking Spanish at home (%)
Residents speaking Spanish at home - Born in the United States (%)
Residents speaking Spanish at home - Native, born elsewhere (%)
Residents speaking Spanish at home - Foreign born (%)
Residents speaking other language at home (%)
Residents speaking other language at home - Born in the United States (%)
Residents speaking other language at home - Native, born elsewhere (%)
Residents speaking other language at home - Foreign born (%)
Marital status - Never married (%)
Marital status - Now married (%)
Marital status - Separated (%)
Marital status - Widowed (%)
Marital status - Divorced (%)
Ancestries Reported - Arab (%)
Ancestries Reported - Czech (%)
Ancestries Reported - Danish (%)
Ancestries Reported - Dutch (%)
Ancestries Reported - English (%)
Ancestries Reported - French (%)
Ancestries Reported - French Canadian (%)
Ancestries Reported - German (%)
Ancestries Reported - Greek (%)
Ancestries Reported - Hungarian (%)
Ancestries Reported - Irish (%)
Ancestries Reported - Italian (%)
Ancestries Reported - Lithuanian (%)
Ancestries Reported - Norwegian (%)
Ancestries Reported - Polish (%)
Ancestries Reported - Portuguese (%)
Ancestries Reported - Russian (%)
Ancestries Reported - Scotch-Irish (%)
Ancestries Reported - Scottish (%)
Ancestries Reported - Slovak (%)
Ancestries Reported - Subsaharan African (%)
Ancestries Reported - Swedish (%)
Ancestries Reported - Swiss (%)
Ancestries Reported - Ukrainian (%)
Ancestries Reported - United States (%)
Ancestries Reported - Welsh (%)
Ancestries Reported - West Indian (%)
Ancestries Reported - Other (%)
Geographical mobility - Same house 1 year ago (%)
Geographical mobility - Same house 1 year ago (%) - White
Geographical mobility - Same house 1 year ago (%) - Black or African American
Geographical mobility - Same house 1 year ago (%) - Asian
Geographical mobility - Same house 1 year ago (%) - Hispanic or Latino
Geographical mobility - Same house 1 year ago (%) - American Indian and Alaska Native
Geographical mobility - Same house 1 year ago (%) - Multirace
Geographical mobility - Same house 1 year ago (%) - Other Race
Geographical mobility - Moved within same county (%)
Geographical mobility - Moved within same county (%) - White
Geographical mobility - Moved within same county (%) - Black or African American
Geographical mobility - Moved within same county (%) - Asian
Geographical mobility - Moved within same county (%) - Hispanic or Latino
Geographical mobility - Moved within same county (%) - American Indian and Alaska Native
Geographical mobility - Moved within same county (%) - Multirace
Geographical mobility - Moved within same county (%) - Other Race
Geographical mobility - Moved from different county within same state (%)
Geographical mobility - Moved from different county within same state (%) - White
Geographical mobility - Moved from different county within same state (%) - Black or African American
Geographical mobility - Moved from different county within same state (%) - Asian
Geographical mobility - Moved from different county within same state (%) - Hispanic or Latino
Geographical mobility - Moved from different county within same state (%) - American Indian and Alaska Native
Geographical mobility - Moved from different county within same state (%) - Multirace
Geographical mobility - Moved from different county within same state (%) - Other Race
Geographical mobility - Moved from different state (%)
Geographical mobility - Moved from different state (%) - White
Geographical mobility - Moved from different state (%) - Black or African American
Geographical mobility - Moved from different state (%) - Asian
Geographical mobility - Moved from different state (%) - Hispanic or Latino
Geographical mobility - Moved from different state (%) - American Indian and Alaska Native
Geographical mobility - Moved from different state (%) - Multirace
Geographical mobility - Moved from different state (%) - Other Race
Geographical mobility - Moved from abroad (%)
Geographical mobility - Moved from abroad (%) - White
Geographical mobility - Moved from abroad (%) - Black or African American
Geographical mobility - Moved from abroad (%) - Asian
Geographical mobility - Moved from abroad (%) - Hispanic or Latino
Geographical mobility - Moved from abroad (%) - American Indian and Alaska Native
Geographical mobility - Moved from abroad (%) - Multirace
Geographical mobility - Moved from abroad (%) - Other Race
Place of birth for the foreign-born population - Ireland (%)
Place of birth for the foreign-born population - Denmark (%)
Place of birth for the foreign-born population - Norway (%)
Place of birth for the foreign-born population - Sweden (%)
Place of birth for the foreign-born population - United Kingdom (%)
Place of birth for the foreign-born population - England (%)
Place of birth for the foreign-born population - Scotland (%)
Place of birth for the foreign-born population - Other Northern Europe (%)
Place of birth for the foreign-born population - Austria (%)
Place of birth for the foreign-born population - Belgium (%)
Place of birth for the foreign-born population - France (%)
Place of birth for the foreign-born population - Germany (%)
Place of birth for the foreign-born population - Netherlands (%)
Place of birth for the foreign-born population - Switzerland (%)
Place of birth for the foreign-born population - Other Western Europe (%)
Place of birth for the foreign-born population - Greece (%)
Place of birth for the foreign-born population - Italy (%)
Place of birth for the foreign-born population - Portugal (%)
Place of birth for the foreign-born population - Spain (%)
Place of birth for the foreign-born population - Other Southern Europe (%)
Place of birth for the foreign-born population - Albania (%)
Place of birth for the foreign-born population - Belarus (%)
Place of birth for the foreign-born population - Bosnia and Herzegovina (%)
Place of birth for the foreign-born population - Bulgaria (%)
Place of birth for the foreign-born population - Croatia (%)
Place of birth for the foreign-born population - Czechoslovakia (%)
Place of birth for the foreign-born population - Hungary (%)
Place of birth for the foreign-born population - Latvia (%)
Place of birth for the foreign-born population - Lithuania (%)
Place of birth for the foreign-born population - North Macedonia (Macedonia) (%)
Place of birth for the foreign-born population - Moldova (%)
Place of birth for the foreign-born population - Poland (%)
Place of birth for the foreign-born population - Romania (%)
Place of birth for the foreign-born population - Russia (%)
Place of birth for the foreign-born population - Serbia (%)
Place of birth for the foreign-born population - Ukraine (%)
Place of birth for the foreign-born population - Other Eastern Europe (%)
Place of birth for the foreign-born population - China (%)
Place of birth for the foreign-born population - Hong Kong (%)
Place of birth for the foreign-born population - Taiwan (%)
Place of birth for the foreign-born population - Japan (%)
Place of birth for the foreign-born population - Korea (%)
Place of birth for the foreign-born population - Other Eastern Asia (%)
Place of birth for the foreign-born population - Afghanistan (%)
Place of birth for the foreign-born population - Bangladesh (%)
Place of birth for the foreign-born population - India (%)
Place of birth for the foreign-born population - Iran (%)
Place of birth for the foreign-born population - Kazakhstan (%)
Place of birth for the foreign-born population - Nepal (%)
Place of birth for the foreign-born population - Pakistan (%)
Place of birth for the foreign-born population - Sri Lanka (%)
Place of birth for the foreign-born population - Uzbekistan (%)
Place of birth for the foreign-born population - Other South Central Asia (%)
Place of birth for the foreign-born population - Burma (%)
Place of birth for the foreign-born population - Cambodia (%)
Place of birth for the foreign-born population - Indonesia (%)
Place of birth for the foreign-born population - Laos (%)
Place of birth for the foreign-born population - Malaysia (%)
Place of birth for the foreign-born population - Philippines (%)
Place of birth for the foreign-born population - Singapore (%)
Place of birth for the foreign-born population - Thailand (%)
Place of birth for the foreign-born population - Vietnam (%)
Place of birth for the foreign-born population - Other South Eastern Asia (%)
Place of birth for the foreign-born population - Armenia (%)
Place of birth for the foreign-born population - Iraq (%)
Place of birth for the foreign-born population - Israel (%)
Place of birth for the foreign-born population - Jordan (%)
Place of birth for the foreign-born population - Kuwait (%)
Place of birth for the foreign-born population - Lebanon (%)
Place of birth for the foreign-born population - Saudi Arabia (%)
Place of birth for the foreign-born population - Syria (%)
Place of birth for the foreign-born population - Turkey (%)
Place of birth for the foreign-born population - Yemen (%)
Place of birth for the foreign-born population - Other Western Asia (%)
Place of birth for the foreign-born population - Eritrea (%)
Place of birth for the foreign-born population - Ethiopia (%)
Place of birth for the foreign-born population - Kenya (%)
Place of birth for the foreign-born population - Somalia (%)
Place of birth for the foreign-born population - Uganda (%)
Place of birth for the foreign-born population - Zimbabwe (%)
Place of birth for the foreign-born population - Other Eastern Africa (%)
Place of birth for the foreign-born population - Cameroon (%)
Place of birth for the foreign-born population - Congo (%)
Place of birth for the foreign-born population - Democratic Republic of Congo (Zaire) (%)
Place of birth for the foreign-born population - Other Middle Africa (%)
Place of birth for the foreign-born population - Egypt (%)
Place of birth for the foreign-born population - Morocco (%)
Place of birth for the foreign-born population - Sudan (%)
Place of birth for the foreign-born population - Other Northern Africa (%)
Place of birth for the foreign-born population - South Africa (%)
Place of birth for the foreign-born population - Other Southern Africa (%)
Place of birth for the foreign-born population - Cabo Verde (%)
Place of birth for the foreign-born population - Ghana (%)
Place of birth for the foreign-born population - Liberia (%)
Place of birth for the foreign-born population - Nigeria (%)
Place of birth for the foreign-born population - Senegal (%)
Place of birth for the foreign-born population - Sierra Leone (%)
Place of birth for the foreign-born population - Other Western Africa (%)
Place of birth for the foreign-born population - Australia (%)
Place of birth for the foreign-born population - New Zealand (%)
Place of birth for the foreign-born population - Fiji (%)
Place of birth for the foreign-born population - Micronesia (%)
Place of birth for the foreign-born population - Bahamas (%)
Place of birth for the foreign-born population - Barbados (%)
Place of birth for the foreign-born population - Cuba (%)
Place of birth for the foreign-born population - Dominica (%)
Place of birth for the foreign-born population - Dominican Republic (%)
Place of birth for the foreign-born population - Grenada (%)
Place of birth for the foreign-born population - Haiti (%)
Place of birth for the foreign-born population - Jamaica (%)
Place of birth for the foreign-born population - St. Vincent and the Grenadines (%)
Place of birth for the foreign-born population - Trinidad and Tobago (%)
Place of birth for the foreign-born population - West Indies (%)
Place of birth for the foreign-born population - Other Caribbean (%)
Place of birth for the foreign-born population - Belize (%)
Place of birth for the foreign-born population - Costa Rica (%)
Place of birth for the foreign-born population - El Salvador (%)
Place of birth for the foreign-born population - Guatemala (%)
Place of birth for the foreign-born population - Honduras (%)
Place of birth for the foreign-born population - Mexico (%)
Place of birth for the foreign-born population - Nicaragua (%)
Place of birth for the foreign-born population - Panama (%)
Place of birth for the foreign-born population - Other Central America (%)
Place of birth for the foreign-born population - Argentina (%)
Place of birth for the foreign-born population - Bolivia (%)
Place of birth for the foreign-born population - Brazil (%)
Place of birth for the foreign-born population - Chile (%)
Place of birth for the foreign-born population - Colombia (%)
Place of birth for the foreign-born population - Ecuador (%)
Place of birth for the foreign-born population - Guyana (%)
Place of birth for the foreign-born population - Peru (%)
Place of birth for the foreign-born population - Uruguay (%)
Place of birth for the foreign-born population - Venezuela (%)
Place of birth for the foreign-born population - Other South America (%)
Place of birth for the foreign-born population - Canada (%)
Place of birth for the foreign-born population - Other Northern America (%)
Place of birth for the foreign-born population - Other (%)
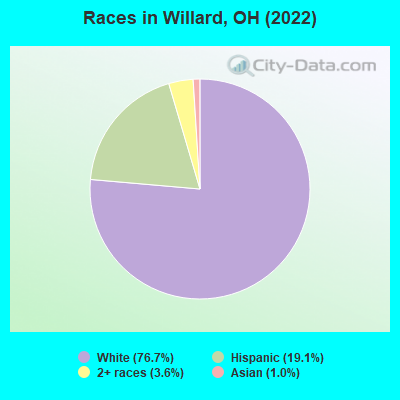
According to 2022 data, the most numerous races in Willard, OH are White alone (4,741 residents), Black alone (0 residents), and Two or more races (223 residents). 91.8% of Willard residents speak English at home. 4.7% of Willard, OH residents are foreign-born (3.3% born in Latin America, 1.0% born in Asia), which is 15.1% greater than the foreign-born rate of 4.0% across the entire state of Ohio.
Race distribution in Willard
2000 2022
9,538,111 84.0% White alone 1,290,662 11.4% Black alone 217,123 1.9% Hispanic 137,770 1.2% Two or more races 131,670 1.2% Asian alone 21,985 0.2% American Indian alone 13,483 0.1% Other race alone 2,336 0.02% Native Hawaiian and Other
8,948,793 76.1% White alone 1,401,403 11.9% Black alone 529,291 4.5% Two or more races 517,232 4.4% Hispanic 293,387 2.5% Asian alone 52,805 0.4% Other race alone 9,785 0.08% American Indian alone 3,362 0.03% Native Hawaiian and Other
Income and house value in Willard Median household income in 2022 $51,604 White non-Hispanic householders$113,846 Some other race householders$41,739 Hispanic or Latino race householdersMedian 2022 house value $125,327 White Non-Hispanic householders$307,175 American Indian or Alaska Native householders$92,234 Some other race householders$92,070 Hispanic or Latino householders
Median age by race in Willard
38.3 Median age for White residents37.9 39.5 -676,499,507.7 Median age for Black or African American residents-681,159,419.6 -674,157,302.7 -676,818,950.3 Median age for American Indian / Alaska Native residents-685,185,184.5 -658,163,264.6 35.9 Median age for Asian residents-674,486,802.8 -674,285,713.6 -800,387,596.1 Median age for Native Hawaiian / Pacific Islander residents-750,242,953.6 -805,394,989.6 32.8 Median age for Other race residents33.6 41.4 21.0 Median age for Two or more races residents21.1 15.6 42.4 Median age for White alone residents38.6 43.0 20.1 Median age for Hispanic or Latino residents21.3 19.4
Owner/renter occupied households by race in Willard
House owners and renters - White residents 1,442 65.7% Owner occupied752 34.3% Renter occupiedHouse owners and renters - Asian residents 20 100.0% Renter occupiedHouse owners and renters - Other race residents 131 79.0% Owner occupied35 21.0% Renter occupiedHouse owners and renters - Two or more races residents 37 30.8% Owner occupied83 69.2% Renter occupiedHouse owners and renters - White alone residents 1,357 69.0% Owner occupied611 31.0% Renter occupiedHouse owners and renters - Hispanic or Latino residents 227 49.8% Owner occupied229 50.2% Renter occupied
Language usage in Willard
English speakers - Total 91.8% of residents of Willard speak English at home.
7.5% of residents speak Spanish at home 133 31.1% Speak English very well295 68.9% Speak English less than very well0.9% of residents speak other language at home 49 100.0% Speak English less than very well
English speakers - Born in the United States 86.7% of residents of Willard speak English at home.
13.9% of residents speak Spanish at home 65 39.4% Speak English very well100 60.6% Speak English less than very well0.4% of residents speak other language at home 5 100.0% Speak English less than very well
English speakers - Native, born elsewhere 38.3% of residents of Willard speak English at home.
60.2% of residents speak Spanish at home 25 32.5% Speak English very well52 67.5% Speak English less than very well
English speakers - Foreign-born 25.3% of residents of Willard speak English at home.
60.2% of residents speak Spanish at home 17 10.8% Speak English very well140 89.2% Speak English less than very well16.5% of residents speak other language at home 43 100.0% Speak English less than very well
White (Caucasian) - Speak only English Native:
97.0% (4,768)Foreign-born:
89.4% (61)
White (Caucasian) - Speak another language Native:
3.0% (145)Foreign-born:
17.7% (12)
Other race - Speak another language Native:
53.4% (112)Foreign-born:
100.0% (158)
White alone - Speak only English Native:
99.2% (4,402)Foreign-born:
100.0% (18)
Hispanic or Latino - Speak only English Native:
69.3% (563)Foreign-born:
23.3% (48)
Hispanic or Latino - Speak another language Native:
30.4% (247)Foreign-born:
75.9% (155)
Foreign-born residents in Willard 291 residents are foreign born (3.3% Latin America , 1.0% Asia ).
Marital status for residents in Willard Marital status - White (Caucasian) population 15 years and over
Males 31.5% Never married41.7% Now married1.8% Separated9.7% Widowed15.2% DivorcedFemales 28.6% Never married39.5% Now married5.4% Separated7.9% Widowed18.6% DivorcedWomen who gave birth in the past 12 months Now married:
28.6% (37)Unmarried:
71.4% (92)
Women who did not give birth in the past 12 months Now married:
39.0% (442)Unmarried:
61.0% (691)
Marital status - Asian population 15 years and over
Males 0.0% Never married100.0% Now married0.0% Separated0.0% Widowed0.0% DivorcedFemales 0.0% Never married100.0% Now married0.0% Separated0.0% Widowed0.0% DivorcedWomen who did not give birth in the past 12 months Now married:
100.0% (22)Unmarried:
0.0% (0)
Marital status - Other race population 15 years and over
Males 68.8% Never married28.1% Now married3.1% Separated0.0% Widowed0.0% DivorcedFemales 45.2% Never married54.8% Now married0.0% Separated0.0% Widowed0.0% DivorcedWomen who did not give birth in the past 12 months Now married:
54.8% (61)Unmarried:
45.2% (50)
Marital status - Two or more races population 15 years and over
Males 86.6% Never married13.4% Now married0.0% Separated0.0% Widowed0.0% DivorcedFemales 0.0% Never married34.8% Now married0.0% Separated65.2% Widowed0.0% DivorcedMarital status - White alone, not Hispanic / Latino population 15 years and over
Males 29.1% Never married42.5% Now married1.9% Separated10.3% Widowed16.1% DivorcedFemales 26.0% Never married40.0% Now married4.2% Separated8.9% Widowed21.0% DivorcedWomen who gave birth in the past 12 months Now married:
71.7% (37)Unmarried:
28.3% (15)
Women who did not give birth in the past 12 months Now married:
34.8% (344)Unmarried:
65.2% (645)
Marital status - Hispanic or Latino population 15 years and over
Males 74.5% Never married23.7% Now married1.8% Separated0.0% Widowed0.0% DivorcedFemales 46.5% Never married38.4% Now married11.1% Separated4.1% Widowed0.0% DivorcedWomen who gave birth in the past 12 months Now married:
0.0% (0)Unmarried:
100.0% (85)
Women who did not give birth in the past 12 months Now married:
62.1% (160)Unmarried:
37.9% (98)
Ancestries in Willard
509 19.4% German395 15.1% English355 13.5% American177 6.7% Irish60 2.3% Swiss52 2.0% Portuguese47 1.8% Polish43 1.6% Italian31 1.2% Dutch30 1.1% European13 0.5% Pennsylvania German13 0.5% Scotch-Irish10 0.4% Scottish8 0.3% British4 0.2% Austrian
Children Nativity (place of birth) in Willard
Children under 6 years - Living with two parents Both parents native 226 100.0% NativeBoth parents foreign-born 24 100.0% Foreign-bornChildren under 6 years - Living with one parent Native parent 243 100.0% NativeChildren 6 to 17 years - Living with two parents Both parents native 473 100.0% NativeBoth parents foreign-born 35 100.0% Foreign-bornChildren 6 to 17 years - Living with one parent Native parent 431 90.1% Native47 9.9% Foreign-born
Place of birth for residents in Willard 210 Americas210 Latin America210 Central America61 Asia61 South Central Asia19 Europe19 Northern Europe
Grandparents responsible for own grandchildren in Willard
Grandparents (30 to 59 years) White / Caucasian 94 56.5% Responsible for grandchildren73 43.5% Not responsible for grandchildrenWhite alone, not Hispanic / Latino 94 59.9% Responsible for grandchildren63 40.1% Not responsible for grandchildrenHispanic or Latino 13 100.0% Not responsible for grandchildrenGrandparents (60 years and over) White / Caucasian 29 16.1% Responsible for grandchildren148 83.9% Not responsible for grandchildrenWhite alone, not Hispanic / Latino 29 16.0% Responsible for grandchildren150 84.0% Not responsible for grandchildrenHispanic or Latino 10 100.0% Responsible for grandchildren