Estimated zip code population in 2022: 10,347 Zip code population in 2010: 11,162 Zip code population in 2000: 12,065
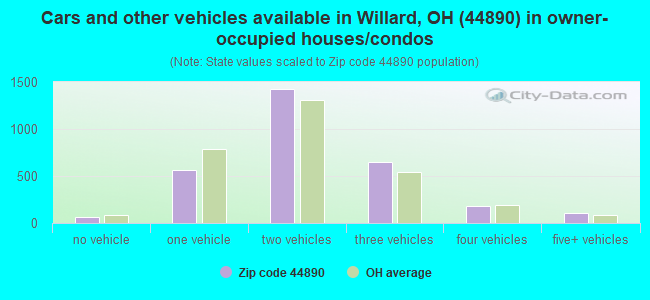
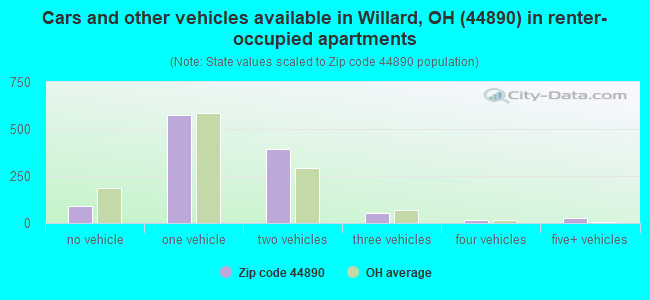
Houses and condos: 4,636 Renter-occupied apartments: 1,159
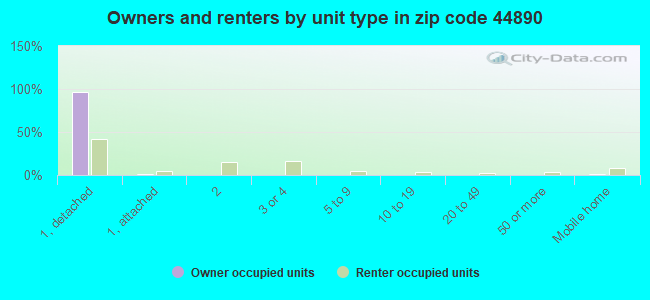
% of renters here:
28%
State:
33%
March 2022 cost of living index in zip code 44890: 76.7 (low, U.S. average is 100)
Land area: 87.6 sq. mi. Water area: 1.0 sq. mi.
Population density: 118 people per square mile
(very low).
OSM Map
General Map
Google Map
MSN Map
OSM Map
General Map
Google Map
MSN Map
OSM Map
General Map
Google Map
MSN Map
OSM Map
General Map
Google Map
MSN Map
Please wait while loading the map...
Real estate property taxes paid for housing units in 2022:
This zip code:
0.9% ($1,249)
Ohio:
1.3% ($2,639)
Median real estate property taxes paid for housing units with mortgages in 2022: $1,239 (0.8%) Median real estate property taxes paid for housing units with no mortgage in 2022: $1,276 (1.0%)
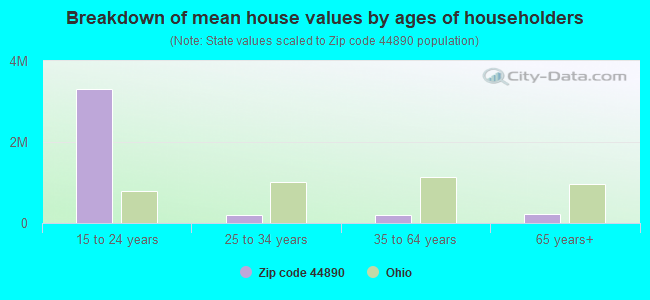
Estimated median house/condo value in 2022: $146,867
44890:
$146,867
Ohio:
$204,100
According to our research of Ohio and other state lists, there were 15 registered sex offenders living in 44890 zip code as of May 29, 2024. The ratio of all residents to sex offenders in zip code 44890 is 763 to 1. The ratio of registered sex offenders to all residents in this zip code is lower than the state average.
Median resident age:
This zip code:
42.2 years
Ohio median age:
39.9 years
Average household size:
This zip code:
2.5 people
Ohio:
2.4 people
Averages for the 2020 tax year for zip code 44890, filed in 2021:
Average Adjusted Gross Income (AGI) in 2020: $47,820 (Individual Income Tax Returns)
Here:
$47,820
State:
$67,288
Salary/wage: $40,069 (reported on 81.4% of returns)
Here:
$40,069
State:
$55,628
(% of AGI for various income ranges: 1144.7% for AGIs below $25k, 3371.9% for AGIs $25k-50k, 6203.6% for AGIs $50k-75k, 8618.1% for AGIs $75k-100k, 13896.3% for AGIs $100k-200k)
Taxable interest for individuals: $980 (reported on 25.0% of returns)
This zip code:
$980
Ohio:
$1,518
(% of AGI for various income ranges: 9.6% for AGIs below $25k, 11.5% for AGIs $25k-50k, 26.4% for AGIs $50k-75k, 59.7% for AGIs $75k-100k, 138.5% for AGIs $100k-200k)
Ordinary dividends: $2,706 (reported on 13.5% of returns)
Here:
$2,706
State:
$7,167
(% of AGI for various income ranges: 8.8% for AGIs below $25k, 24.8% for AGIs $25k-50k, 42.8% for AGIs $50k-75k, 101.9% for AGIs $75k-100k, 146.7% for AGIs $100k-200k)
Net capital gain/loss in AGI: +$7,625 (reported on 12.0% of returns)
Here:
+$7,625
State:
+$18,919
(% of AGI for various income ranges: 5.6% for AGIs below $25k, 15.0% for AGIs $25k-50k, 63.1% for AGIs $50k-75k, 227.1% for AGIs $75k-100k, 538.9% for AGIs $100k-200k)
Profit/loss from business: +$7,506 (reported on 9.6% of returns)
Here:
+$7,506
State:
+$13,744
(% of AGI for various income ranges: 50.1% for AGIs below $25k, 74.7% for AGIs $25k-50k, 120.8% for AGIs $50k-75k, 192.3% for AGIs $75k-100k, 283.0% for AGIs $100k-200k)
Taxable individual retirement arrangement distribution: $14,770 (reported on 10.5% of returns)
44890:
$14,770
Ohio:
$18,876
(% of AGI for various income ranges: 81.1% for AGIs below $25k, 151.2% for AGIs $25k-50k, 229.7% for AGIs $50k-75k, 382.9% for AGIs $75k-100k, 918.1% for AGIs $100k-200k)
Total itemized deductions: $34,480 (reported on 1.9% of returns)
Here:
$34,480
State:
$33,869
(% of AGI for various income ranges: 45.0% for AGIs below $25k, 147.2% for AGIs $50k-75k, 302.6% for AGIs $100k-200k)
Charity contributions: $15,412 (reported on 1.5% of returns)
Here:
$15,412
State:
$14,577
(% of AGI for various income ranges: 40.2% for AGIs $50k-75k, 361.5% for AGIs $100k-200k)
Taxes paid: $5,850 (reported on 1.9% of returns)
44890:
$5,850
State:
$7,681
(% of AGI for various income ranges: 34.4% for AGIs $50k-75k, 66.7% for AGIs $100k-200k)
Earned income credit: $2,386 (reported on 18.0% of returns)
Here:
$2,386
State:
$2,304
(% of AGI for various income ranges: 97.7% for AGIs below $25k, 67.0% for AGIs $25k-50k)
Percentage of individuals using paid preparers for their 2020 taxes: 95.9%
Here:
96%
State:
94%
(% for various income ranges: 94.8% for AGIs below $25k, 96.2% for AGIs $25k-50k, 97.6% for AGIs $50k-75k, 95.5% for AGIs $75k-100k, 95.3% for AGIs $100k-200k, 100.0% for AGIs over 200k)
Averages for the 2012 tax year for zip code 44890, filed in 2013:
Average Adjusted Gross Income (AGI) in 2012: $39,575 (Individual Income Tax Returns)
Here:
$39,575
State:
$54,926
Salary/wage: $34,848 (reported on 84.8% of returns)
Here:
$34,848
State:
$45,869
(% of AGI for various income ranges: 73.1% for AGIs below $25k, 79.7% for AGIs $25k-50k, 77.5% for AGIs $50k-75k, 76.1% for AGIs $75k-100k, 74.0% for AGIs $100k-200k, 40.8% for AGIs over 200k)
Taxable interest for individuals: $824 (reported on 28.7% of returns)
This zip code:
$824
Ohio:
$1,297
(% of AGI for various income ranges: 0.9% for AGIs below $25k, 0.4% for AGIs $25k-50k, 0.5% for AGIs $50k-75k, 0.5% for AGIs $75k-100k, 1.0% for AGIs $100k-200k, 0.3% for AGIs over 200k)
Ordinary dividends: $1,723 (reported on 16.2% of returns)
Here:
$1,723
State:
$5,821
(% of AGI for various income ranges: 0.8% for AGIs below $25k, 0.7% for AGIs $25k-50k, 0.6% for AGIs $50k-75k, 0.9% for AGIs $75k-100k, 0.8% for AGIs $100k-200k)
Net capital gain/loss in AGI: +$2,352 (reported on 10.5% of returns)
Here:
+$2,352
State:
+$11,232
(% of AGI for various income ranges: 0.4% for AGIs $50k-75k, 0.7% for AGIs $75k-100k, 2.9% for AGIs $100k-200k)
Profit/loss from business: +$8,298 (reported on 9.6% of returns)
Here:
+$8,298
State:
+$12,773
(% of AGI for various income ranges: 3.2% for AGIs below $25k, 1.7% for AGIs $25k-50k, 1.3% for AGIs $50k-75k, 2.3% for AGIs $75k-100k, 2.8% for AGIs $100k-200k)
Taxable individual retirement arrangement distribution: $10,266 (reported on 10.4% of returns)
44890:
$10,266
Ohio:
$14,511
(% of AGI for various income ranges: 3.4% for AGIs below $25k, 2.4% for AGIs $25k-50k, 2.9% for AGIs $50k-75k, 2.2% for AGIs $75k-100k, 3.5% for AGIs $100k-200k)
Total itemized deductions: $17,134 (23% of AGI, reported on 18.9% of returns)
Here:
$17,134
State:
$21,278
Here:
22.5% of AGI
State:
18.8% of AGI
(% of AGI for various income ranges: 4.9% for AGIs below $25k, 5.1% for AGIs $25k-50k, 8.1% for AGIs $50k-75k, 9.3% for AGIs $75k-100k, 12.9% for AGIs $100k-200k, 14.1% for AGIs over 200k)
Charity contributions: $3,793 (reported on 13.3% of returns)
Here:
$3,793
State:
$3,943
(% of AGI for various income ranges: 0.6% for AGIs below $25k, 0.6% for AGIs $25k-50k, 1.1% for AGIs $50k-75k, 1.3% for AGIs $75k-100k, 2.7% for AGIs $100k-200k, 2.4% for AGIs over 200k)
Taxes paid: $5,611 (reported on 18.8% of returns)
44890:
$5,611
State:
$9,568
(% of AGI for various income ranges: 0.8% for AGIs below $25k, 1.4% for AGIs $25k-50k, 2.4% for AGIs $50k-75k, 3.1% for AGIs $75k-100k, 5.1% for AGIs $100k-200k, 5.8% for AGIs over 200k)
Earned income credit: $2,378 (reported on 19.5% of returns)
Here:
$2,378
State:
$2,285
(% of AGI for various income ranges: 6.4% for AGIs below $25k, 1.1% for AGIs $25k-50k)
Percentage of individuals using paid preparers for their 2012 taxes: 67.2%
Here:
67%
State:
51%
(% for various income ranges: 64.1% for AGIs below $25k, 69.1% for AGIs $25k-50k, 68.9% for AGIs $50k-75k, 69.4% for AGIs $75k-100k, 70.4% for AGIs $100k-200k, 100.0% for AGIs over 200k)
Averages for the 2004 tax year for zip code 44890, filed in 2005:
Average Adjusted Gross Income (AGI) in 2004: $34,545 (Individual Income Tax Returns)
Here:
$34,545
State:
$44,480
Salary/wage: $31,557 (reported on 88.5% of returns)
Here:
$31,557
State:
$39,198
(% of AGI for various income ranges: 95.7% for AGIs below $10k, 76.2% for AGIs $10k-25k, 85.7% for AGIs $25k-50k, 84.9% for AGIs $50k-75k, 79.9% for AGIs $75k-100k, 62.6% for AGIs over 100k)
Taxable interest for individuals: $937 (reported on 42.6% of returns)
This zip code:
$937
Ohio:
$1,532
(% of AGI for various income ranges: 2.0% for AGIs below $10k, 2.0% for AGIs $10k-25k, 0.9% for AGIs $25k-50k, 0.9% for AGIs $50k-75k, 1.4% for AGIs $75k-100k, 1.0% for AGIs over 100k)
Taxable dividends: $1,340 (reported on 23.1% of returns)
Here:
$1,340
State:
$3,496
(% of AGI for various income ranges: 2.1% for AGIs below $10k, 1.1% for AGIs $10k-25k, 0.7% for AGIs $25k-50k, 0.5% for AGIs $50k-75k, 0.7% for AGIs $75k-100k, 1.8% for AGIs over 100k)
Net capital gain/loss: +$4,504 (reported on 14.9% of returns)
Here:
+$4,504
State:
+$8,582
(% of AGI for various income ranges: -1.5% for AGIs below $10k, 0.5% for AGIs $10k-25k, 0.6% for AGIs $25k-50k, 1.2% for AGIs $50k-75k, 2.3% for AGIs $75k-100k, 8.8% for AGIs over 100k)
Profit/loss from business: +$6,969 (reported on 10.3% of returns)
Here:
+$6,969
State:
+$10,813
(% of AGI for various income ranges: 3.8% for AGIs below $10k, 2.6% for AGIs $10k-25k, 1.8% for AGIs $25k-50k, 1.6% for AGIs $50k-75k, 1.6% for AGIs $75k-100k, 3.5% for AGIs over 100k)
IRA payment deduction: $2,767 (reported on 2.2% of returns)
44890:
$2,767
Ohio:
$2,794
(% of AGI for various income ranges: 0.2% for AGIs $10k-25k, 0.2% for AGIs $25k-50k, 0.1% for AGIs $50k-75k, 0.2% for AGIs $75k-100k, 0.2% for AGIs over 100k)
Total itemized deductions: $13,069 (21% of AGI, reported on 24.1% of returns)
Here:
$13,069
State:
$17,503
Here:
21.1% of AGI
State:
20.8% of AGI
(% of AGI for various income ranges: 3.2% for AGIs below $10k, 4.5% for AGIs $10k-25k, 7.2% for AGIs $25k-50k, 9.8% for AGIs $50k-75k, 12.7% for AGIs $75k-100k, 14.9% for AGIs over 100k)
Charity contributions deductions: $2,795 (4% of AGI, reported on 18.0% of returns)
Here:
$2,795
State:
$3,087
Here:
4.1% of AGI
State:
3.4% of AGI
(% of AGI for various income ranges: 0.6% for AGIs $10k-25k, 0.9% for AGIs $25k-50k, 1.5% for AGIs $50k-75k, 1.9% for AGIs $75k-100k, 3.6% for AGIs over 100k)
Total tax: $3,909 (reported on 73.4% of returns)
44890:
$3,909
State:
$6,781
(% of AGI for various income ranges: 2.0% for AGIs below $10k, 3.7% for AGIs $10k-25k, 6.7% for AGIs $25k-50k, 8.5% for AGIs $50k-75k, 10.7% for AGIs $75k-100k, 15.4% for AGIs over 100k)
Earned income credit: $1,668 (reported on 16.7% of returns)
Here:
$1,668
State:
$1,696
Percentage of individuals using paid preparers for their 2004 taxes: 64.5%
Here:
65%
State:
55%
(% for various income ranges: 54.9% for AGIs below $10k, 65.5% for AGIs $10k-25k, 67.6% for AGIs $25k-50k, 64.7% for AGIs $50k-75k, 70.1% for AGIs $75k-100k, 74.4% for AGIs over 100k)
Household received Food Stamps/SNAP in the past 12 months: 495 Household did not receive Food Stamps/SNAP in the past 12 months: 3,663
Women who had a birth in the past 12 months: 131 (38 now married, 90 unmarried) Women who did not have a birth in the past 12 months: 2,146 (963 now married, 1,182 unmarried)
Housing units in zip code 44890 with a mortgage: 1,788 (193 second mortgage, 41 home equity loan, 152 both second mortgage and home equity loan) Houses without a mortgage: 14
Median monthly owner costs for units with a mortgage: $1,035 Median monthly owner costs for units without a mortgage: $476
Residents with income below the poverty level in 2022:
This zip code:
13.3%
Whole state:
13.4%
Residents with income below 50% of the poverty level in 2022:
This zip code:
9.7%
Whole state:
7.0%
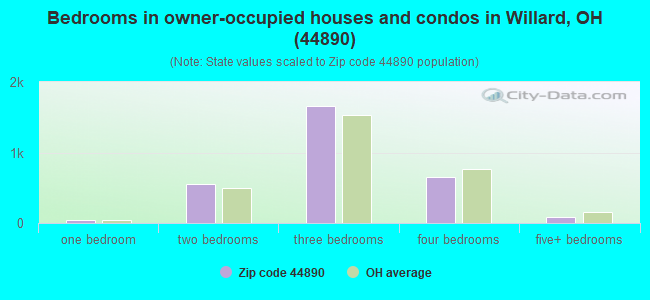
Median number of rooms in houses and condos:
Here:
7.0
State:
6.7
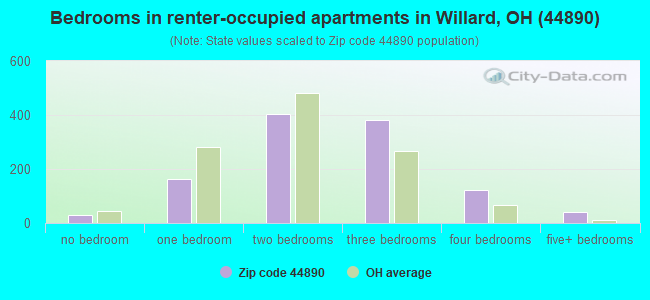
Median number of rooms in apartments:
Here:
5.7
State:
4.4
Notable locations in this zip code not listed on our city pages
Churches in zip code 44890 include: Guinea Corners Church (A), Church of God of Prophecy (B), Church of the Nazarene (C), First Presbyterian Church (D), Grace Methodist Church (E), Trinity Lutheran Church (F). Display/hide their locations on the map
Cemeteries: Boughton Cemetery (1), Steuben Cemetery (2), Old Greenwood Cemetery (3), Mennonite Cemetery (4), Lutheran Cemetery (5), Guinea Corners Cemetery (6), Fullmer Farm Cemetery (7). Display/hide their locations on the map
Reservoirs: Willard Lake (A), B & O Railroad Pond 1026-001 (B), Holiday Lake (C), B & O Railroad Pond 1025-006 (D), Bass Lake (E), Willard City Reservoir (F). Display/hide their locations on the map
1,135 married couples with children.
775 single-parent households (195 men, 580 women).
92.7% of residents of 44890 zip code speak English at home.
5.9% of residents speak Spanish at home (34% very well, 37% well, 19% not well, 10% not at all).
1.7% of residents speak other Indo-European language at home (55% very well, 42% well, 3% not well).
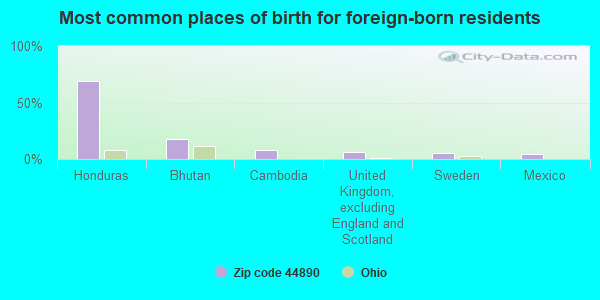
Foreign born population: 327 (3.2%) (19.2% of them are naturalized citizens)
This zip code:
3.2%
Whole state:
5.0%
69%Honduras
18%Bhutan
8%Cambodia
6%United Kingdom, excluding England and Scotland
5%Sweden
5%Mexico
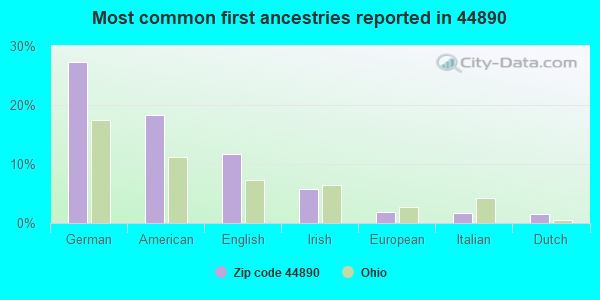
27%German
18%American
12%English
6%Irish
2%European
2%Italian
2%Dutch
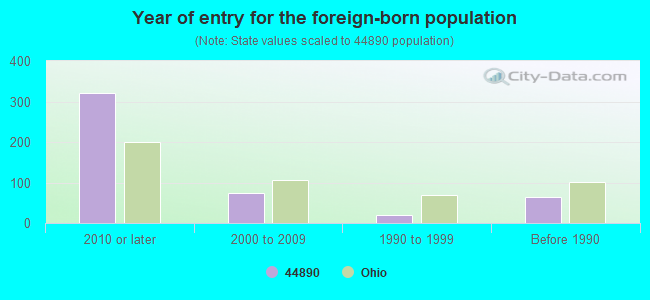
Year of entry for the foreign-born population
3222010 or later
742000 to 2009
191990 to 1999
64Before 1990
Facilities with environmental interests located in this zip code:
CENTRAL ELEMENTARY SCHOOL (206 W PEARL ST in WILLARD, OH)
(National Center for Education Statistics) - STATE ID-005439 Organizations: WILLARD CITY SD (SCHOOL DISTRICT)
Housing units lacking complete plumbing facilities: 1.1% Housing units lacking complete kitchen facilities: 0.8%
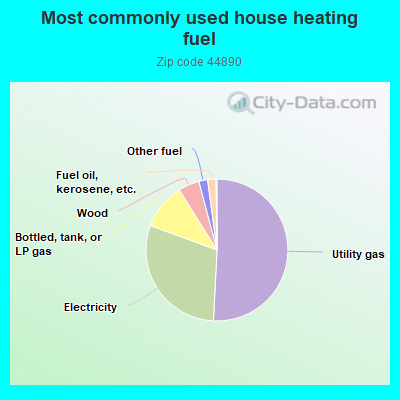
50.8%Utility gas
29.8%Electricity
10.5%Bottled, tank, or LP gas
4.8%Wood
2.0%Other fuel
1.9%Fuel oil, kerosene, etc.
Population in 1990: 11,156. Population change in the 1990s: +909 (+8.1%).
Place of birth for U.S.-born residents:
This state: 8,136
Northeast: 130
Midwest: 333
South: 1,162
West: 106
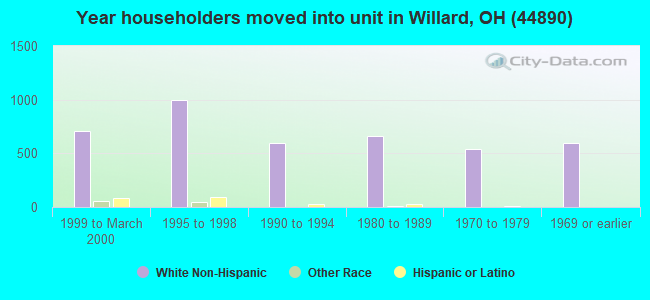
60% of the 44890 zip code residents lived in the same house 5 years ago. Out of people who lived in different houses, 75% lived in this county. Out of people who lived in different counties, 50% lived in Ohio.
92% of the 44890 zip code residents lived in the same house 1 year ago. Out of people who lived in different houses, 75% moved from this county. Out of people who lived in different houses, 20% moved from different county within same state. Out of people who lived in different houses, 3% moved from different state.
Private vs. public school enrollment:
Students in private schools in grades 1 to 8 (elementary and middle school): 104
Here:
10.3%
Ohio:
16.0%
Students in private schools in grades 9 to 12 (high school): 43
Here:
10.1%
Ohio:
13.1%
Students in private undergraduate colleges: 67
Here:
22.6%
Ohio:
22.3%
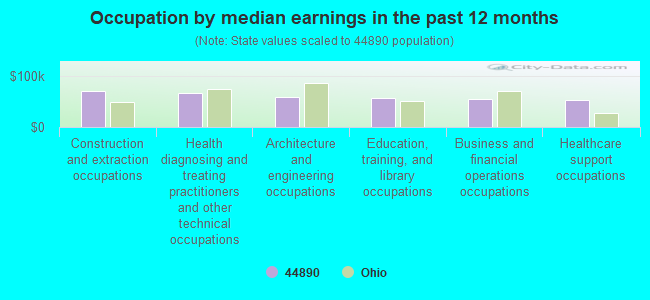
Occupation by median earnings in the past 12 months ($)
70,539Construction and extraction occupations
67,083Health diagnosing and treating practitioners and other technical occupations
57,818Architecture and engineering occupations
56,330Education, training, and library occupations
54,634Business and financial operations occupations
52,467Healthcare support occupations
Companies with federal contracts located in this zip code:
GUARDIAN MANUFACTURING CO (302 S CONWELL AVE in WILLARD, OH; small business) : $21,104,607 in 18 contractsfrom 2000 to 2006
Contracts for Clothing, Special Purpose, Hosiery, Handwear, and Clothing Accessories, Men's, Physical Properties Testing and Inspection, Other Environmental Services, Studies, and Analytical Support by Defense Logistics Agency, Army, Navy Signed by year:2000: $82,250; 2001: $0; 2002: $5,357,048; 2003: $0; 2004: $13,917,326; 2005: $1,748,080; 2006: -$97.
Biggest contracts:
$7,384,236 with Defense Logistics Agency for Clothing, Special Purpose. Signed on 2004-01-27. Completion date: 2005-01-15.
$3,679,389, same as above.Signed on 2004-03-24. Completion date: 2005-05-25.
$3,537,387, same as above.Signed on 2002-01-08. Completion date: 2002-09-11.
$1,905,901, same as above.Signed on 2004-11-23. Completion date: 2005-12-16.
Top industries in this zip code by the number of employees in 2005:
87 people in nursing facilities/skilled-nursing facilities
41 people in workers' group living quarters and job corps centers
People in group quarters in 2000:
120 people in nursing homes
Fatal accident statistics in 2014:
Fatal accident count: 1
Vehicles involved in fatal accidents: 1
Fatal accidents caused by drunken drivers: 0
Fatalities: 1
Persons involved in fatal accidents: 1
Pedestrians involved in fatal accidents: 0
Fatal accident statistics in 2013:
Fatal accident count: 3
Vehicles involved in fatal accidents: 5
Fatal accidents caused by drunken drivers: 0
Fatalities: 3
Persons involved in fatal accidents: 6
Pedestrians involved in fatal accidents: 1
2002 - 2018 National Fire Incident Reporting System (NFIRS) incidents
Based on the data from the years 2002 - 2018 the average number of fires per year is 55. The highest number of fires - 82 took place in 2009, and the least - 36 in 2003. The data has a dropping trend.
When looking into fire subcategories, the most reports belonged to: Outside Fires (45.3%), and Structure Fires (38.4%).
Fire incident types reported to NFIRS in Zip Code 44890

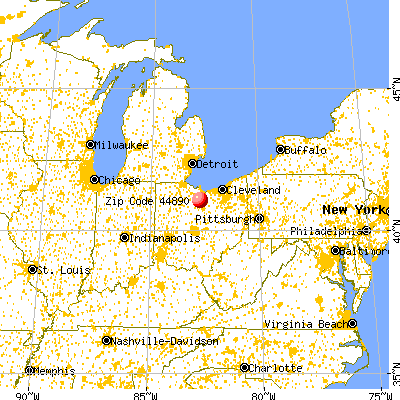


 Nearest zip codes: 44850, 44865, 44855, 44847, 44807, 44857.


 Based on the data from the years 2002 - 2018 the average number of fires per year is 55. The highest number of fires - 82 took place in 2009, and the least - 36 in 2003. The data has a dropping trend.
 When looking into fire subcategories, the most reports belonged to: Outside Fires (45.3%), and Structure Fires (38.4%).