Races in Wooster, Ohio (OH) Detailed Stats
Data:
Races - White alone (%)
Races - White alone (% change since 2000)
Races - Black alone (%)
Races - Black alone (% change since 2000)
Races - American Indian alone (%)
Races - American Indian alone (% change since 2000)
Races - Asian alone (%)
Races - Asian alone (% change since 2000)
Races - Hispanic (%)
Races - Hispanic (% change since 2000)
Races - Native Hawaiian and Other Pacific Islander alone (%)
Races - Native Hawaiian and Other Pacific Islander alone (% change since 2000)
Races - Two or more races(%)
Races - Two or more races(% change since 2000)
Races - Other race alone (%)
Races - Other race alone (% change since 2000)
Racial diversity
Place of birth - Born in state of residence (%)
Place of birth - Born in state of residence (%) - White
Place of birth - Born in state of residence (%) - Black or African American
Place of birth - Born in state of residence (%) - Asian
Place of birth - Born in state of residence (%) - Hispanic or Latino
Place of birth - Born in state of residence (%) - American Indian and Alaska Native
Place of birth - Born in state of residence (%) - Multirace
Place of birth - Born in state of residence (%) - Other Race
Place of birth - Born in other state (%)
Place of birth - Born in other state (%) - White
Place of birth - Born in other state (%) - Black or African American
Place of birth - Born in other state (%) - Asian
Place of birth - Born in other state (%) - Hispanic or Latino
Place of birth - Born in other state (%) - American Indian and Alaska Native
Place of birth - Born in other state (%) - Multirace
Place of birth - Born in other state (%) - Other Race
Place of birth - Native, outside of US (%)
Place of birth - Native, outside of US (%) - White
Place of birth - Native, outside of US (%) - Black or African American
Place of birth - Native, outside of US (%) - Asian
Place of birth - Native, outside of US (%) - Hispanic or Latino
Place of birth - Native, outside of US (%) - American Indian and Alaska Native
Place of birth - Native, outside of US (%) - Multirace
Place of birth - Native, outside of US (%) - Other Race
Place of birth - Foreign born (%)
Place of birth - Foreign born (%) - White
Place of birth - Foreign born (%) - Black or African American
Place of birth - Foreign born (%) - Asian
Place of birth - Foreign born (%) - Hispanic or Latino
Place of birth - Foreign born (%) - American Indian and Alaska Native
Place of birth - Foreign born (%) - Multirace
Place of birth - Foreign born (%) - Other Race
Residents speaking English at home (%)
Residents speaking English at home - Born in the United States (%)
Residents speaking English at home - Native, born elsewhere (%)
Residents speaking English at home - Foreign born (%)
Residents speaking Spanish at home (%)
Residents speaking Spanish at home - Born in the United States (%)
Residents speaking Spanish at home - Native, born elsewhere (%)
Residents speaking Spanish at home - Foreign born (%)
Residents speaking other language at home (%)
Residents speaking other language at home - Born in the United States (%)
Residents speaking other language at home - Native, born elsewhere (%)
Residents speaking other language at home - Foreign born (%)
Marital status - Never married (%)
Marital status - Now married (%)
Marital status - Separated (%)
Marital status - Widowed (%)
Marital status - Divorced (%)
Ancestries Reported - Arab (%)
Ancestries Reported - Czech (%)
Ancestries Reported - Danish (%)
Ancestries Reported - Dutch (%)
Ancestries Reported - English (%)
Ancestries Reported - French (%)
Ancestries Reported - French Canadian (%)
Ancestries Reported - German (%)
Ancestries Reported - Greek (%)
Ancestries Reported - Hungarian (%)
Ancestries Reported - Irish (%)
Ancestries Reported - Italian (%)
Ancestries Reported - Lithuanian (%)
Ancestries Reported - Norwegian (%)
Ancestries Reported - Polish (%)
Ancestries Reported - Portuguese (%)
Ancestries Reported - Russian (%)
Ancestries Reported - Scotch-Irish (%)
Ancestries Reported - Scottish (%)
Ancestries Reported - Slovak (%)
Ancestries Reported - Subsaharan African (%)
Ancestries Reported - Swedish (%)
Ancestries Reported - Swiss (%)
Ancestries Reported - Ukrainian (%)
Ancestries Reported - United States (%)
Ancestries Reported - Welsh (%)
Ancestries Reported - West Indian (%)
Ancestries Reported - Other (%)
Geographical mobility - Same house 1 year ago (%)
Geographical mobility - Same house 1 year ago (%) - White
Geographical mobility - Same house 1 year ago (%) - Black or African American
Geographical mobility - Same house 1 year ago (%) - Asian
Geographical mobility - Same house 1 year ago (%) - Hispanic or Latino
Geographical mobility - Same house 1 year ago (%) - American Indian and Alaska Native
Geographical mobility - Same house 1 year ago (%) - Multirace
Geographical mobility - Same house 1 year ago (%) - Other Race
Geographical mobility - Moved within same county (%)
Geographical mobility - Moved within same county (%) - White
Geographical mobility - Moved within same county (%) - Black or African American
Geographical mobility - Moved within same county (%) - Asian
Geographical mobility - Moved within same county (%) - Hispanic or Latino
Geographical mobility - Moved within same county (%) - American Indian and Alaska Native
Geographical mobility - Moved within same county (%) - Multirace
Geographical mobility - Moved within same county (%) - Other Race
Geographical mobility - Moved from different county within same state (%)
Geographical mobility - Moved from different county within same state (%) - White
Geographical mobility - Moved from different county within same state (%) - Black or African American
Geographical mobility - Moved from different county within same state (%) - Asian
Geographical mobility - Moved from different county within same state (%) - Hispanic or Latino
Geographical mobility - Moved from different county within same state (%) - American Indian and Alaska Native
Geographical mobility - Moved from different county within same state (%) - Multirace
Geographical mobility - Moved from different county within same state (%) - Other Race
Geographical mobility - Moved from different state (%)
Geographical mobility - Moved from different state (%) - White
Geographical mobility - Moved from different state (%) - Black or African American
Geographical mobility - Moved from different state (%) - Asian
Geographical mobility - Moved from different state (%) - Hispanic or Latino
Geographical mobility - Moved from different state (%) - American Indian and Alaska Native
Geographical mobility - Moved from different state (%) - Multirace
Geographical mobility - Moved from different state (%) - Other Race
Geographical mobility - Moved from abroad (%)
Geographical mobility - Moved from abroad (%) - White
Geographical mobility - Moved from abroad (%) - Black or African American
Geographical mobility - Moved from abroad (%) - Asian
Geographical mobility - Moved from abroad (%) - Hispanic or Latino
Geographical mobility - Moved from abroad (%) - American Indian and Alaska Native
Geographical mobility - Moved from abroad (%) - Multirace
Geographical mobility - Moved from abroad (%) - Other Race
Place of birth for the foreign-born population - Ireland (%)
Place of birth for the foreign-born population - Denmark (%)
Place of birth for the foreign-born population - Norway (%)
Place of birth for the foreign-born population - Sweden (%)
Place of birth for the foreign-born population - United Kingdom (%)
Place of birth for the foreign-born population - England (%)
Place of birth for the foreign-born population - Scotland (%)
Place of birth for the foreign-born population - Other Northern Europe (%)
Place of birth for the foreign-born population - Austria (%)
Place of birth for the foreign-born population - Belgium (%)
Place of birth for the foreign-born population - France (%)
Place of birth for the foreign-born population - Germany (%)
Place of birth for the foreign-born population - Netherlands (%)
Place of birth for the foreign-born population - Switzerland (%)
Place of birth for the foreign-born population - Other Western Europe (%)
Place of birth for the foreign-born population - Greece (%)
Place of birth for the foreign-born population - Italy (%)
Place of birth for the foreign-born population - Portugal (%)
Place of birth for the foreign-born population - Spain (%)
Place of birth for the foreign-born population - Other Southern Europe (%)
Place of birth for the foreign-born population - Albania (%)
Place of birth for the foreign-born population - Belarus (%)
Place of birth for the foreign-born population - Bosnia and Herzegovina (%)
Place of birth for the foreign-born population - Bulgaria (%)
Place of birth for the foreign-born population - Croatia (%)
Place of birth for the foreign-born population - Czechoslovakia (%)
Place of birth for the foreign-born population - Hungary (%)
Place of birth for the foreign-born population - Latvia (%)
Place of birth for the foreign-born population - Lithuania (%)
Place of birth for the foreign-born population - North Macedonia (Macedonia) (%)
Place of birth for the foreign-born population - Moldova (%)
Place of birth for the foreign-born population - Poland (%)
Place of birth for the foreign-born population - Romania (%)
Place of birth for the foreign-born population - Russia (%)
Place of birth for the foreign-born population - Serbia (%)
Place of birth for the foreign-born population - Ukraine (%)
Place of birth for the foreign-born population - Other Eastern Europe (%)
Place of birth for the foreign-born population - China (%)
Place of birth for the foreign-born population - Hong Kong (%)
Place of birth for the foreign-born population - Taiwan (%)
Place of birth for the foreign-born population - Japan (%)
Place of birth for the foreign-born population - Korea (%)
Place of birth for the foreign-born population - Other Eastern Asia (%)
Place of birth for the foreign-born population - Afghanistan (%)
Place of birth for the foreign-born population - Bangladesh (%)
Place of birth for the foreign-born population - India (%)
Place of birth for the foreign-born population - Iran (%)
Place of birth for the foreign-born population - Kazakhstan (%)
Place of birth for the foreign-born population - Nepal (%)
Place of birth for the foreign-born population - Pakistan (%)
Place of birth for the foreign-born population - Sri Lanka (%)
Place of birth for the foreign-born population - Uzbekistan (%)
Place of birth for the foreign-born population - Other South Central Asia (%)
Place of birth for the foreign-born population - Burma (%)
Place of birth for the foreign-born population - Cambodia (%)
Place of birth for the foreign-born population - Indonesia (%)
Place of birth for the foreign-born population - Laos (%)
Place of birth for the foreign-born population - Malaysia (%)
Place of birth for the foreign-born population - Philippines (%)
Place of birth for the foreign-born population - Singapore (%)
Place of birth for the foreign-born population - Thailand (%)
Place of birth for the foreign-born population - Vietnam (%)
Place of birth for the foreign-born population - Other South Eastern Asia (%)
Place of birth for the foreign-born population - Armenia (%)
Place of birth for the foreign-born population - Iraq (%)
Place of birth for the foreign-born population - Israel (%)
Place of birth for the foreign-born population - Jordan (%)
Place of birth for the foreign-born population - Kuwait (%)
Place of birth for the foreign-born population - Lebanon (%)
Place of birth for the foreign-born population - Saudi Arabia (%)
Place of birth for the foreign-born population - Syria (%)
Place of birth for the foreign-born population - Turkey (%)
Place of birth for the foreign-born population - Yemen (%)
Place of birth for the foreign-born population - Other Western Asia (%)
Place of birth for the foreign-born population - Eritrea (%)
Place of birth for the foreign-born population - Ethiopia (%)
Place of birth for the foreign-born population - Kenya (%)
Place of birth for the foreign-born population - Somalia (%)
Place of birth for the foreign-born population - Uganda (%)
Place of birth for the foreign-born population - Zimbabwe (%)
Place of birth for the foreign-born population - Other Eastern Africa (%)
Place of birth for the foreign-born population - Cameroon (%)
Place of birth for the foreign-born population - Congo (%)
Place of birth for the foreign-born population - Democratic Republic of Congo (Zaire) (%)
Place of birth for the foreign-born population - Other Middle Africa (%)
Place of birth for the foreign-born population - Egypt (%)
Place of birth for the foreign-born population - Morocco (%)
Place of birth for the foreign-born population - Sudan (%)
Place of birth for the foreign-born population - Other Northern Africa (%)
Place of birth for the foreign-born population - South Africa (%)
Place of birth for the foreign-born population - Other Southern Africa (%)
Place of birth for the foreign-born population - Cabo Verde (%)
Place of birth for the foreign-born population - Ghana (%)
Place of birth for the foreign-born population - Liberia (%)
Place of birth for the foreign-born population - Nigeria (%)
Place of birth for the foreign-born population - Senegal (%)
Place of birth for the foreign-born population - Sierra Leone (%)
Place of birth for the foreign-born population - Other Western Africa (%)
Place of birth for the foreign-born population - Australia (%)
Place of birth for the foreign-born population - New Zealand (%)
Place of birth for the foreign-born population - Fiji (%)
Place of birth for the foreign-born population - Micronesia (%)
Place of birth for the foreign-born population - Bahamas (%)
Place of birth for the foreign-born population - Barbados (%)
Place of birth for the foreign-born population - Cuba (%)
Place of birth for the foreign-born population - Dominica (%)
Place of birth for the foreign-born population - Dominican Republic (%)
Place of birth for the foreign-born population - Grenada (%)
Place of birth for the foreign-born population - Haiti (%)
Place of birth for the foreign-born population - Jamaica (%)
Place of birth for the foreign-born population - St. Vincent and the Grenadines (%)
Place of birth for the foreign-born population - Trinidad and Tobago (%)
Place of birth for the foreign-born population - West Indies (%)
Place of birth for the foreign-born population - Other Caribbean (%)
Place of birth for the foreign-born population - Belize (%)
Place of birth for the foreign-born population - Costa Rica (%)
Place of birth for the foreign-born population - El Salvador (%)
Place of birth for the foreign-born population - Guatemala (%)
Place of birth for the foreign-born population - Honduras (%)
Place of birth for the foreign-born population - Mexico (%)
Place of birth for the foreign-born population - Nicaragua (%)
Place of birth for the foreign-born population - Panama (%)
Place of birth for the foreign-born population - Other Central America (%)
Place of birth for the foreign-born population - Argentina (%)
Place of birth for the foreign-born population - Bolivia (%)
Place of birth for the foreign-born population - Brazil (%)
Place of birth for the foreign-born population - Chile (%)
Place of birth for the foreign-born population - Colombia (%)
Place of birth for the foreign-born population - Ecuador (%)
Place of birth for the foreign-born population - Guyana (%)
Place of birth for the foreign-born population - Peru (%)
Place of birth for the foreign-born population - Uruguay (%)
Place of birth for the foreign-born population - Venezuela (%)
Place of birth for the foreign-born population - Other South America (%)
Place of birth for the foreign-born population - Canada (%)
Place of birth for the foreign-born population - Other Northern America (%)
Place of birth for the foreign-born population - Other (%)
Latest news about races in Wooster, OH collected exclusively by city-data.com from local newspapers, TV, and radio stations
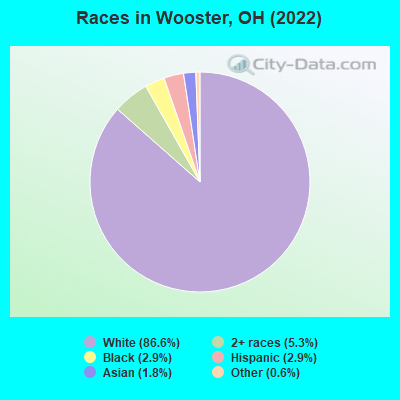
According to 2022 data, the most numerous races in Wooster, OH are White alone (23,366 residents), Black alone (782 residents), and Two or more races (1,427 residents). 92.8% of Wooster residents speak English at home. 4.9% of Wooster, OH residents are foreign-born (2.0% born in Asia, 1.0% born in Latin America, 0.9% born in Europe, 0.6% born in Africa), which is 18.9% greater than the foreign-born rate of 4.0% across the entire state of Ohio.
Race distribution in Wooster
2000 2022
9,538,111 84.0% White alone 1,290,662 11.4% Black alone 217,123 1.9% Hispanic 137,770 1.2% Two or more races 131,670 1.2% Asian alone 21,985 0.2% American Indian alone 13,483 0.1% Other race alone 2,336 0.02% Native Hawaiian and Other
8,948,793 76.1% White alone 1,401,403 11.9% Black alone 529,291 4.5% Two or more races 517,232 4.4% Hispanic 293,387 2.5% Asian alone 52,805 0.4% Other race alone 9,785 0.08% American Indian alone 3,362 0.03% Native Hawaiian and Other
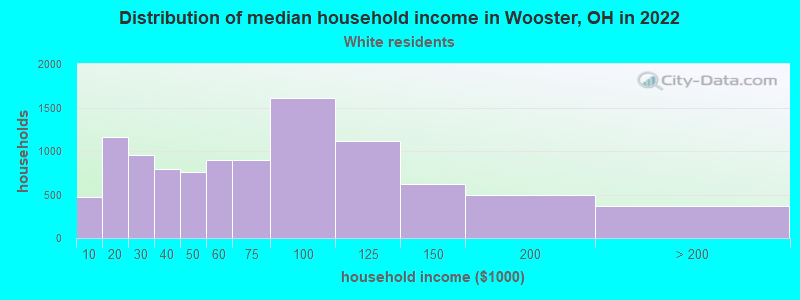
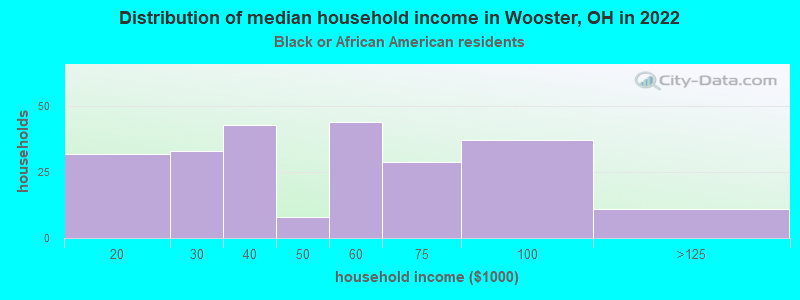
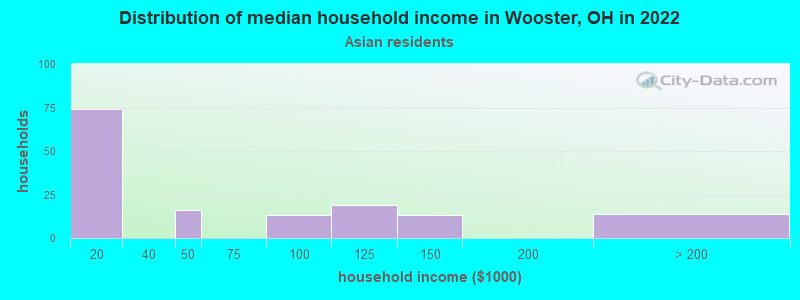
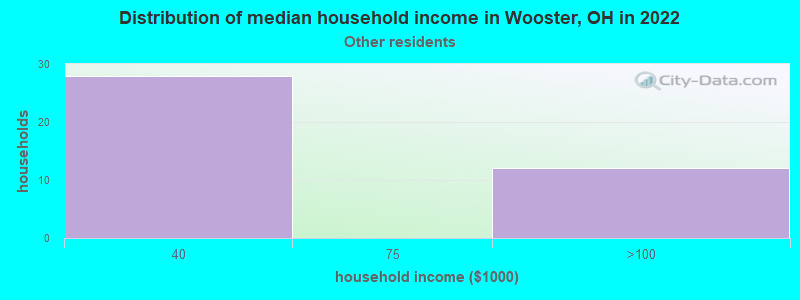
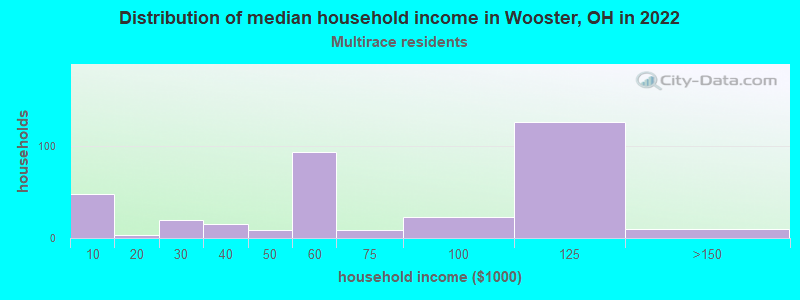
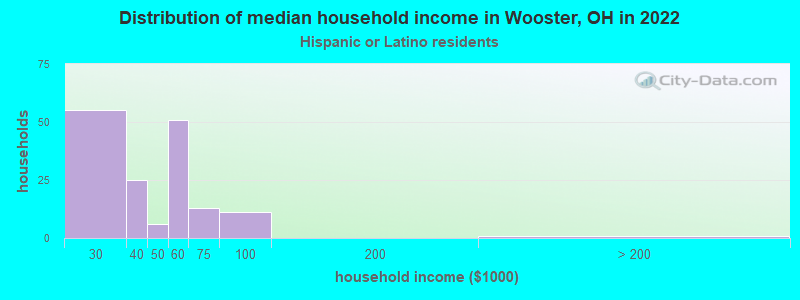
Income and house value in Wooster Median household income in 2022 $61,038 White non-Hispanic householders$46,224 Black householders$67,061 Two or more races householdersMedian 2022 house value $220,199 White Non-Hispanic householders$150,843 Black or African American householders$227,479 American Indian or Alaska Native householders $199,979 Asian householders$134,061 Two or more races householders$204,832 Hispanic or Latino householders
Median age by race in Wooster
41.3 Median age for White residents41.0 40.8 18.7 Median age for Black or African American residents16.3 24.4 -676,818,950.3 Median age for American Indian / Alaska Native residents-685,185,184.5 -658,163,264.6 27.3 Median age for Asian residents26.3 29.7 -666,666,666.0 Median age for Native Hawaiian / Pacific Islander residents-666,666,666.0 -666,666,666.0 49.9 Median age for Other race residents48.7 29.8 28.2 Median age for Two or more races residents36.6 21.2 41.7 Median age for White alone residents41.2 40.9 20.2 Median age for Hispanic or Latino residents18.6 28.2
Owner/renter occupied households by race in Wooster
House owners and renters - White residents 6,520 64.9% Owner occupied3,530 35.1% Renter occupiedHouse owners and renters - Black or African American residents 29 12.3% Owner occupied207 87.7% Renter occupiedHouse owners and renters - American Indian / Alaska Native residents 14 100.0% Owner occupiedHouse owners and renters - Asian residents 26 21.1% Owner occupied98 78.9% Renter occupiedHouse owners and renters - Other race residents 13 33.6% Owner occupied26 66.4% Renter occupiedHouse owners and renters - Two or more races residents 217 45.8% Owner occupied257 54.2% Renter occupiedHouse owners and renters - White alone residents 6,504 64.9% Owner occupied3,511 35.1% Renter occupiedHouse owners and renters - Hispanic or Latino residents 35 22.6% Owner occupied119 77.4% Renter occupied
Language usage in Wooster
English speakers - Total 92.8% of residents of Wooster speak English at home.
1.8% of residents speak Spanish at home 419 89.0% Speak English very well52 11.0% Speak English less than very well4.9% of residents speak other language at home 959 76.4% Speak English very well296 23.6% Speak English less than very well
English speakers - Born in the United States 93.8% of residents of Wooster speak English at home.
2.7% of residents speak Spanish at home 173 100.0% Speak English very well2.0% of residents speak other language at home 118 92.2% Speak English very well10 7.8% Speak English less than very well
English speakers - Native, born elsewhere 58.5% of residents of Wooster speak English at home.
70.0% of residents speak Spanish at home 79 86.8% Speak English very well12 13.2% Speak English less than very well11.5% of residents speak other language at home 15 100.0% Speak English very well
English speakers - Foreign-born 13.4% of residents of Wooster speak English at home.
10.0% of residents speak Spanish at home 140 92.1% Speak English very well12 7.9% Speak English less than very well74.6% of residents speak other language at home 750 65.9% Speak English very well388 34.1% Speak English less than very well
White (Caucasian) - Speak only English Native:
97.9% (21,732)Foreign-born:
51.1% (255)
White (Caucasian) - Speak another language Native:
2.5% (546)Foreign-born:
47.8% (238)
Black or African American - Speak only English Native:
91.8% (590)Foreign-born:
3.4% (6)
Black or African American - Speak another language Native:
8.6% (55)Foreign-born:
94.3% (162)
Asian - Speak only English Native:
75.9% (30)Foreign-born:
3.3% (14)
Asian - Speak another language Native:
25.4% (10)Foreign-born:
97.8% (426)
Other race - Speak another language Native:
42.8% (104)Foreign-born:
100.0% (86)
Two or more races - Speak only English Native:
87.5% (1,145)Foreign-born:
31.4% (97)
Two or more races - Speak another language Native:
12.6% (165)Foreign-born:
65.2% (203)
White alone - Speak only English Native:
98.2% (21,649)Foreign-born:
56.4% (254)
White alone - Speak another language Native:
2.3% (497)Foreign-born:
44.1% (199)
Hispanic or Latino - Speak only English Native:
44.5% (231)Foreign-born:
0.8% (1)
Hispanic or Latino - Speak another language Native:
55.3% (286)Foreign-born:
100.0% (122)
Foreign-born residents in Wooster 1,332 residents are foreign born (2.0% Asia , 1.0% Latin America , 0.9% Europe , 0.6% Africa ).
Marital status for residents in Wooster Marital status - White (Caucasian) population 15 years and over
Males 36.6% Never married46.2% Now married1.7% Separated3.0% Widowed12.6% DivorcedFemales 35.4% Never married39.4% Now married1.9% Separated9.8% Widowed13.5% DivorcedWomen who gave birth in the past 12 months Now married:
48.6% (156)Unmarried:
51.4% (165)
Women who did not give birth in the past 12 months Now married:
33.5% (1,953)Unmarried:
66.5% (3,870)
Marital status - Black or African American population 15 years and over
Males 52.2% Never married27.1% Now married0.0% Separated3.6% Widowed17.1% DivorcedFemales 56.9% Never married7.9% Now married17.7% Separated0.0% Widowed17.5% DivorcedWomen who did not give birth in the past 12 months Now married:
17.8% (47)Unmarried:
82.2% (217)
Marital status - Asian population 15 years and over
Males 73.3% Never married26.7% Now married0.0% Separated0.0% Widowed0.0% DivorcedFemales 52.7% Never married40.5% Now married5.0% Separated0.0% Widowed1.8% DivorcedWomen who did not give birth in the past 12 months Now married:
23.4% (37)Unmarried:
76.6% (121)
Marital status - Other race population 15 years and over
Males 42.5% Never married57.5% Now married0.0% Separated0.0% Widowed0.0% DivorcedFemales 18.9% Never married62.2% Now married18.9% Separated0.0% Widowed0.0% DivorcedWomen who did not give birth in the past 12 months Now married:
79.4% (107)Unmarried:
20.6% (28)
Marital status - Two or more races population 15 years and over
Males 56.2% Never married40.6% Now married2.1% Separated0.0% Widowed1.1% DivorcedFemales 49.5% Never married45.6% Now married0.0% Separated0.6% Widowed4.3% DivorcedWomen who gave birth in the past 12 months Now married:
100.0% (185)Unmarried:
0.0% (0)
Women who did not give birth in the past 12 months Now married:
13.5% (50)Unmarried:
86.5% (323)
Marital status - White alone, not Hispanic / Latino population 15 years and over
Males 36.4% Never married46.3% Now married1.7% Separated3.0% Widowed12.6% DivorcedFemales 34.6% Never married40.0% Now married1.9% Separated9.7% Widowed13.7% DivorcedWomen who gave birth in the past 12 months Now married:
48.6% (157)Unmarried:
51.4% (166)
Women who did not give birth in the past 12 months Now married:
34.1% (1,962)Unmarried:
65.9% (3,799)
Marital status - Hispanic or Latino population 15 years and over
Males 44.3% Never married51.3% Now married4.3% Separated0.0% Widowed0.0% DivorcedFemales 59.3% Never married27.1% Now married6.4% Separated7.3% Widowed0.0% DivorcedWomen who gave birth in the past 12 months Now married:
100.0% (40)Unmarried:
0.0% (0)
Women who did not give birth in the past 12 months Now married:
26.2% (51)Unmarried:
73.8% (143)
Ancestries in Wooster
2,450 23.9% German1,466 14.3% English960 9.4% American678 6.6% Irish618 6.0% Italian417 4.1% European402 3.9% Scottish163 1.6% Brazilian123 1.2% French106 1.0% Scotch-Irish97 0.9% Polish82 0.8% Swiss78 0.8% Slovak66 0.6% Greek58 0.6% Dutch56 0.5% Eastern European53 0.5% Northern European52 0.5% Swedish51 0.5% Danish51 0.5% Hungarian49 0.5% Sudanese46 0.4% Scandinavian44 0.4% Nigerian38 0.4% British36 0.4% Lithuanian35 0.3% Ethiopian30 0.3% Moroccan30 0.3% Slovene29 0.3% Kenyan24 0.2% Ghanaian24 0.2% Welsh19 0.2% Serbian18 0.2% Iranian17 0.2% Pennsylvania German15 0.1% Austrian14 0.1% Belgian14 0.1% Lebanese13 0.1% Croatian13 0.1% Ukrainian11 0.1% African7 0.07% Romanian
Geographical mobility in Wooster Same house 1 year ago 19,725 83.9% White (Caucasian)546 66.5% Black or African American25 100.0% American Indian / Alaska Native281 58.8% Asian230 62.4% Other race948 56.6% Two or more races19,615 84.1% White alone, not Hispanic / Latino346 49.0% Hispanic or LatinoMoved within same county 1,698 7.2% White / Caucasian33 4.0% Black or African American22 4.5% Asian96 26.1% Other race227 13.6% Two or more races1,695 7.3% White alone, not Hispanic / Latino91 12.9% Hispanic or LatinoMoved within same state 1,016 4.3% White / Caucasian61 7.4% Black or African American242 14.5% Two or more races1,020 4.4% White alone, not Hispanic / Latino99 14.0% Hispanic or LatinoMoved from different state 827 3.5% White / Caucasian132 16.1% Black or African American27 7.3% Other race19 1.2% Two or more races752 3.2% White alone, not Hispanic / Latino164 23.2% Hispanic or LatinoMoved from abroad 128 0.5% White123 15.0% Black or African American182 38.2% Asian237 14.1% Two or more races128 0.5% White alone, not Hispanic / Latino
Children Nativity (place of birth) in Wooster
Children under 6 years - Living with two parents Both parents native 905 100.0% NativeBoth parents foreign-born 12 100.0% NativeOne native, one foreign-born parent 70 100.0% NativeChildren under 6 years - Living with one parent Native parent 457 100.0% Native
Children 6 to 17 years - Living with two parents Both parents native 1,821 100.0% NativeBoth parents foreign-born 98 100.0% Foreign-bornOne native, one foreign-born parent 24 100.0% NativeChildren 6 to 17 years - Living with one parent Native parent 1,152 98.3% Native20 1.7% Foreign-bornForeign-born parent 22 100.0% Native
Grandparents responsible for own grandchildren in Wooster
Grandparents (30 to 59 years) White / Caucasian 112 41.0% Responsible for grandchildren160 59.0% Not responsible for grandchildrenTwo or more races 21 100.0% Not responsible for grandchildrenWhite alone, not Hispanic / Latino 112 41.0% Responsible for grandchildren160 59.0% Not responsible for grandchildrenGrandparents (60 years and over) White / Caucasian 20 35.9% Responsible for grandchildren36 64.1% Not responsible for grandchildrenTwo or more races 1 100.0% Not responsible for grandchildrenWhite alone, not Hispanic / Latino 20 35.9% Responsible for grandchildren36 64.1% Not responsible for grandchildren