Estimated zip code population in 2022: 64,663 Zip code population in 2010: 60,998 Zip code population in 2000: 62,206
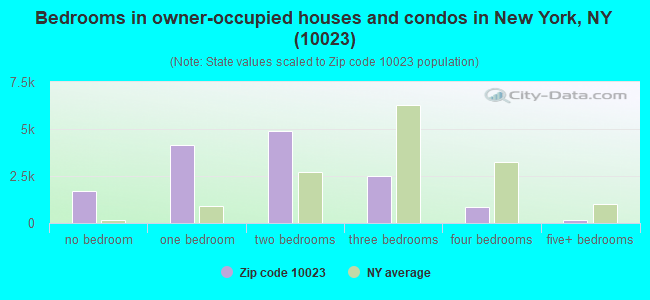
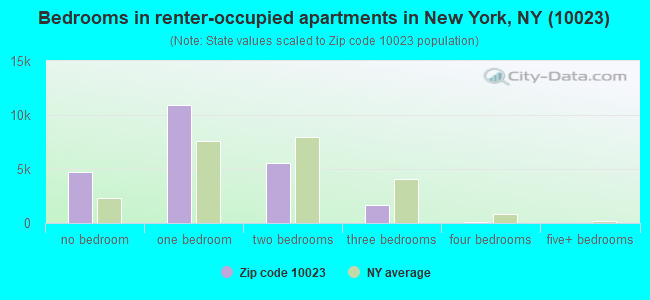
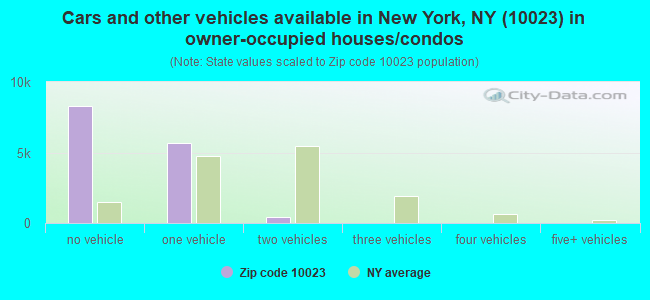
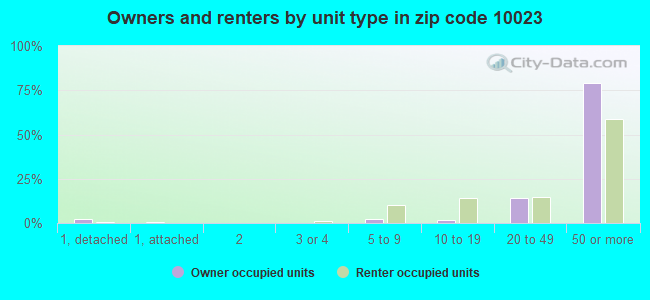
Houses and condos: 45,896 Renter-occupied apartments: 22,703
% of renters here:
62%
State:
46%
March 2022 cost of living index in zip code 10023: 157.1 (very high, U.S. average is 100)
Land area: 0.5 sq. mi. Water area: 0.0 sq. mi.
Population density: 131,829 people per square mile
(very high).
OSM Map
General Map
Google Map
MSN Map
OSM Map
General Map
Google Map
MSN Map
OSM Map
General Map
Google Map
MSN Map
OSM Map
General Map
Google Map
MSN Map
Please wait while loading the map...
Real estate property taxes paid for housing units in 2022:
This zip code:
0.6% ($9,805)
New York:
1.5% ($6,180)
Median real estate property taxes paid for housing units with mortgages in 2022: $9,858 (0.6%) Median real estate property taxes paid for housing units with no mortgage in 2022: $9,755 (0.6%)
Estimated median house/condo value in 2022: $1,590,029
10023:
$1,590,029
New York:
$400,400
According to our research of New York and other state lists, there were 4 registered sex offenders living in 10023 zip code as of June 02, 2024. The ratio of all residents to sex offenders in zip code 10023 is 15,293 to 1. The ratio of registered sex offenders to all residents in this zip code is much lower than the state average.
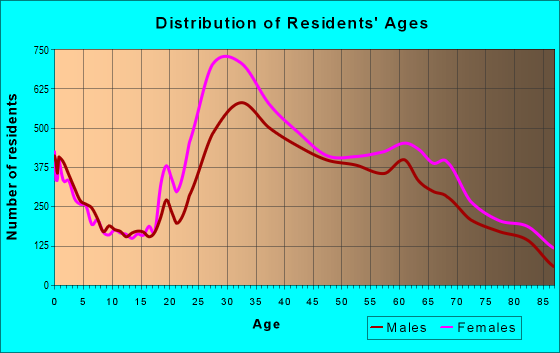
Median resident age:
This zip code:
43.8 years
New York median age:
40.0 years
Average household size:
This zip code:
1.7 people
New York:
2.5 people
Averages for the 2020 tax year for zip code 10023, filed in 2021:
Average Adjusted Gross Income (AGI) in 2020: $343,081 (Individual Income Tax Returns)
Here:
$343,081
State:
$90,930
Salary/wage: $227,003 (reported on 73.9% of returns)
Here:
$227,003
State:
$72,104
(% of AGI for various income ranges: 973.4% for AGIs below $25k, 3309.6% for AGIs $25k-50k, 6695.0% for AGIs $50k-75k, 10494.6% for AGIs $75k-100k, 20716.8% for AGIs $100k-200k, 223156.0% for AGIs over 200k)
Taxable interest for individuals: $20,521 (reported on 59.3% of returns)
This zip code:
$20,521
New York:
$3,075
(% of AGI for various income ranges: 87.8% for AGIs below $25k, 107.3% for AGIs $25k-50k, 125.1% for AGIs $50k-75k, 213.5% for AGIs $75k-100k, 394.0% for AGIs $100k-200k, 19091.5% for AGIs over 200k)
Ordinary dividends: $33,653 (reported on 58.0% of returns)
Here:
$33,653
State:
$11,095
(% of AGI for various income ranges: 235.7% for AGIs below $25k, 341.8% for AGIs $25k-50k, 509.1% for AGIs $50k-75k, 853.9% for AGIs $75k-100k, 1431.9% for AGIs $100k-200k, 28117.6% for AGIs over 200k)
Net capital gain/loss in AGI: +$151,589 (reported on 54.2% of returns)
Here:
+$151,589
State:
+$44,925
(% of AGI for various income ranges: 115.4% for AGIs below $25k, 245.7% for AGIs $25k-50k, 345.7% for AGIs $50k-75k, 655.6% for AGIs $75k-100k, 1469.9% for AGIs $100k-200k, 133640.9% for AGIs over 200k)
Profit/loss from business: +$44,285 (reported on 21.7% of returns)
Here:
+$44,285
State:
+$14,940
(% of AGI for various income ranges: 207.1% for AGIs below $25k, 472.6% for AGIs $25k-50k, 486.9% for AGIs $50k-75k, 837.3% for AGIs $75k-100k, 1229.3% for AGIs $100k-200k, 11836.2% for AGIs over 200k)
Taxable individual retirement arrangement distribution: $40,364 (reported on 12.0% of returns)
10023:
$40,364
New York:
$19,609
(% of AGI for various income ranges: 94.5% for AGIs below $25k, 214.9% for AGIs $25k-50k, 345.2% for AGIs $50k-75k, 507.2% for AGIs $75k-100k, 1144.6% for AGIs $100k-200k, 4896.4% for AGIs over 200k)
Self-employed (Keogh) retirement plans: $40,147 (reported on 4.6% of returns)
10023:
$40,147
New York:
$32,497
(% of AGI for various income ranges: 4.0% for AGIs below $25k, 24.6% for AGIs $25k-50k, 38.8% for AGIs $50k-75k, 83.7% for AGIs $75k-100k, 184.0% for AGIs $100k-200k, 2619.1% for AGIs over 200k)
Total itemized deductions: $72,634 (reported on 27.4% of returns)
Here:
$72,634
State:
$39,326
(% of AGI for various income ranges: 326.0% for AGIs below $25k, 494.4% for AGIs $25k-50k, 732.1% for AGIs $50k-75k, 1066.3% for AGIs $75k-100k, 1946.7% for AGIs $100k-200k, 27166.3% for AGIs over 200k)
Charity contributions: $43,148 (reported on 24.8% of returns)
Here:
$43,148
State:
$15,420
(% of AGI for various income ranges: 18.4% for AGIs below $25k, 53.8% for AGIs $25k-50k, 92.2% for AGIs $50k-75k, 159.5% for AGIs $75k-100k, 407.7% for AGIs $100k-200k, 16886.5% for AGIs over 200k)
Taxes paid: $9,949 (reported on 27.4% of returns)
10023:
$9,949
State:
$9,183
(% of AGI for various income ranges: 96.8% for AGIs below $25k, 143.1% for AGIs $25k-50k, 223.0% for AGIs $50k-75k, 352.5% for AGIs $75k-100k, 595.0% for AGIs $100k-200k, 2666.7% for AGIs over 200k)
Earned income credit: $1,400 (reported on 4.3% of returns)
Here:
$1,400
State:
$2,138
(% of AGI for various income ranges: 46.6% for AGIs below $25k, 27.6% for AGIs $25k-50k)
Percentage of individuals using paid preparers for their 2020 taxes: 94.8%
Here:
95%
State:
95%
(% for various income ranges: 92.2% for AGIs below $25k, 93.2% for AGIs $25k-50k, 94.6% for AGIs $50k-75k, 94.9% for AGIs $75k-100k, 95.5% for AGIs $100k-200k, 96.5% for AGIs over 200k)
Averages for the 2012 tax year for zip code 10023, filed in 2013:
Average Adjusted Gross Income (AGI) in 2012: $320,455 (Individual Income Tax Returns)
Here:
$320,455
State:
$77,088
Salary/wage: $210,903 (reported on 76.3% of returns)
Here:
$210,903
State:
$60,593
(% of AGI for various income ranges: 55.9% for AGIs below $25k, 67.2% for AGIs $25k-50k, 70.3% for AGIs $50k-75k, 69.2% for AGIs $75k-100k, 72.9% for AGIs $100k-200k, 46.2% for AGIs over 200k)
Taxable interest for individuals: $16,379 (reported on 64.8% of returns)
This zip code:
$16,379
New York:
$3,125
(% of AGI for various income ranges: 4.3% for AGIs below $25k, 2.2% for AGIs $25k-50k, 1.6% for AGIs $50k-75k, 1.5% for AGIs $75k-100k, 1.4% for AGIs $100k-200k, 3.6% for AGIs over 200k)
Ordinary dividends: $31,032 (reported on 53.5% of returns)
Here:
$31,032
State:
$10,299
(% of AGI for various income ranges: 10.1% for AGIs below $25k, 5.3% for AGIs $25k-50k, 4.5% for AGIs $50k-75k, 4.3% for AGIs $75k-100k, 3.8% for AGIs $100k-200k, 5.3% for AGIs over 200k)
Net capital gain/loss in AGI: +$133,448 (reported on 48.7% of returns)
Here:
+$133,448
State:
+$42,474
(% of AGI for various income ranges: 0.9% for AGIs $25k-50k, 1.3% for AGIs $50k-75k, 1.6% for AGIs $75k-100k, 2.4% for AGIs $100k-200k, 23.9% for AGIs over 200k)
Profit/loss from business: +$40,111 (reported on 23.5% of returns)
Here:
+$40,111
State:
+$16,168
(% of AGI for various income ranges: 17.1% for AGIs below $25k, 10.0% for AGIs $25k-50k, 6.2% for AGIs $50k-75k, 5.5% for AGIs $75k-100k, 4.7% for AGIs $100k-200k, 2.3% for AGIs over 200k)
Taxable individual retirement arrangement distribution: $45,239 (reported on 14.5% of returns)
10023:
$45,239
New York:
$17,621
(% of AGI for various income ranges: 6.2% for AGIs below $25k, 3.7% for AGIs $25k-50k, 3.3% for AGIs $50k-75k, 4.2% for AGIs $75k-100k, 3.6% for AGIs $100k-200k, 1.7% for AGIs over 200k)
Self-employment retirement plans: $33,077 (reported on 4.8% of returns)
10023:
$33,077
New York:
$27,330
(% of AGI for various income ranges: 0.5% for AGIs below $25k, 0.5% for AGIs $25k-50k, 0.5% for AGIs $50k-75k, 0.6% for AGIs $75k-100k, 0.5% for AGIs $100k-200k, 0.5% for AGIs over 200k)
Total itemized deductions: $84,623 (18% of AGI, reported on 66.9% of returns)
Here:
$84,623
State:
$34,985
Here:
18.3% of AGI
State:
21.3% of AGI
(% of AGI for various income ranges: 28.6% for AGIs below $25k, 18.0% for AGIs $25k-50k, 17.0% for AGIs $50k-75k, 19.2% for AGIs $75k-100k, 18.8% for AGIs $100k-200k, 17.4% for AGIs over 200k)
Charity contributions: $15,207 (reported on 56.6% of returns)
Here:
$15,207
State:
$5,572
(% of AGI for various income ranges: 1.7% for AGIs below $25k, 1.5% for AGIs $25k-50k, 1.6% for AGIs $50k-75k, 1.9% for AGIs $75k-100k, 1.9% for AGIs $100k-200k, 2.9% for AGIs over 200k)
Taxes paid: $56,971 (reported on 66.6% of returns)
10023:
$56,971
State:
$18,656
(% of AGI for various income ranges: 10.2% for AGIs below $25k, 6.6% for AGIs $25k-50k, 7.5% for AGIs $50k-75k, 10.2% for AGIs $75k-100k, 11.3% for AGIs $100k-200k, 12.2% for AGIs over 200k)
Earned income credit: $1,334 (reported on 4.8% of returns)
Here:
$1,334
State:
$2,230
(% of AGI for various income ranges: 2.5% for AGIs below $25k, 0.2% for AGIs $25k-50k)
Percentage of individuals using paid preparers for their 2012 taxes: 69.3%
Here:
69%
State:
66%
(% for various income ranges: 62.9% for AGIs below $25k, 63.5% for AGIs $25k-50k, 63.9% for AGIs $50k-75k, 66.1% for AGIs $75k-100k, 69.4% for AGIs $100k-200k, 81.2% for AGIs over 200k)
Averages for the 2004 tax year for zip code 10023, filed in 2005:
Average Adjusted Gross Income (AGI) in 2004: $189,333 (Individual Income Tax Returns)
Here:
$189,333
State:
$59,519
Salary/wage: $162,071 (reported on 76.8% of returns)
Here:
$162,071
State:
$50,673
(% of AGI for various income ranges: 59.3% for AGIs $10k-25k, 74.6% for AGIs $25k-50k, 73.8% for AGIs $50k-75k, 75.3% for AGIs $75k-100k, 62.6% for AGIs over 100k)
Taxable interest for individuals: $7,482 (reported on 72.0% of returns)
This zip code:
$7,482
New York:
$2,377
(% of AGI for various income ranges: 5.9% for AGIs $10k-25k, 3.0% for AGIs $25k-50k, 2.4% for AGIs $50k-75k, 2.1% for AGIs $75k-100k, 2.6% for AGIs over 100k)
Taxable dividends: $13,176 (reported on 55.9% of returns)
Here:
$13,176
State:
$5,394
(% of AGI for various income ranges: 7.2% for AGIs $10k-25k, 3.9% for AGIs $25k-50k, 3.6% for AGIs $50k-75k, 3.3% for AGIs $75k-100k, 3.7% for AGIs over 100k)
Net capital gain/loss: +$53,984 (reported on 50.2% of returns)
Here:
+$53,984
State:
+$23,581
(% of AGI for various income ranges: 0.2% for AGIs $10k-25k, 1.2% for AGIs $25k-50k, 1.4% for AGIs $50k-75k, 1.7% for AGIs $75k-100k, 15.5% for AGIs over 100k)
Profit/loss from business: +$29,535 (reported on 23.7% of returns)
Here:
+$29,535
State:
+$13,809
(% of AGI for various income ranges: 13.3% for AGIs $10k-25k, 8.1% for AGIs $25k-50k, 5.6% for AGIs $50k-75k, 5.2% for AGIs $75k-100k, 3.2% for AGIs over 100k)
Profit/loss from farming: +$4,154 (reported on 0.0% of returns)
Here:
+$4,154
State:
-$2,666
IRA payment deduction: $3,129 (reported on 4.0% of returns)
10023:
$3,129
New York:
$3,115
(% of AGI for various income ranges: 0.7% for AGIs $10k-25k, 0.5% for AGIs $25k-50k, 0.2% for AGIs $50k-75k, 0.2% for AGIs $75k-100k, 0.0% for AGIs over 100k)
Self-employed pension: $22,970 (reported on 5.1% of returns)
Here:
$22,970
New York:
$19,016
(% of AGI for various income ranges: 0.5% for AGIs $10k-25k, 0.7% for AGIs $25k-50k, 0.6% for AGIs $50k-75k, 0.7% for AGIs $75k-100k, 0.6% for AGIs over 100k)
Total itemized deductions: $52,148 (18% of AGI, reported on 64.7% of returns)
Here:
$52,148
State:
$25,864
Here:
18.3% of AGI
State:
21.9% of AGI
(% of AGI for various income ranges: 24.7% for AGIs $10k-25k, 18.0% for AGIs $25k-50k, 19.0% for AGIs $50k-75k, 19.8% for AGIs $75k-100k, 17.0% for AGIs over 100k)
Charity contributions deductions: $10,794 (4% of AGI, reported on 58.5% of returns)
Here:
$10,794
State:
$4,439
Here:
3.6% of AGI
State:
3.6% of AGI
(% of AGI for various income ranges: 2.1% for AGIs $10k-25k, 2.2% for AGIs $25k-50k, 2.4% for AGIs $50k-75k, 2.4% for AGIs $75k-100k, 3.4% for AGIs over 100k)
Total tax: $50,032 (reported on 87.5% of returns)
10023:
$50,032
State:
$11,730
(% of AGI for various income ranges: 5.9% for AGIs $10k-25k, 9.8% for AGIs $25k-50k, 13.1% for AGIs $50k-75k, 14.9% for AGIs $75k-100k, 24.1% for AGIs over 100k)
Earned income credit: $1,018 (reported on 4.5% of returns)
Here:
$1,018
State:
$1,757
Percentage of individuals using paid preparers for their 2004 taxes: 72.0%
Here:
72%
State:
67%
(% for various income ranges: 67.6% for AGIs below $10k, 68.8% for AGIs $10k-25k, 67.0% for AGIs $25k-50k, 69.9% for AGIs $50k-75k, 71.2% for AGIs $75k-100k, 78.1% for AGIs over 100k)
Likely homosexual households (counted as self-reported same-sex unmarried-partner households)
Lesbian couples: 0.1% of all households
Gay men: 0.9% of all households
Household received Food Stamps/SNAP in the past 12 months: 1,858 Household did not receive Food Stamps/SNAP in the past 12 months: 34,202
Women who had a birth in the past 12 months: 971 (807 now married, 156 unmarried) Women who did not have a birth in the past 12 months: 15,854 (5,874 now married, 9,974 unmarried)
Housing units in zip code 10023 with a mortgage: 7,449 (464 second mortgage, 455 both second mortgage and home equity loan) Houses without a mortgage: 110
Median monthly owner costs for units with a mortgage: $3,860 Median monthly owner costs for units without a mortgage: $1,487
Residents with income below the poverty level in 2022:
This zip code:
7.4%
Whole state:
14.3%
Residents with income below 50% of the poverty level in 2022:
This zip code:
3.5%
Whole state:
6.8%
Median number of rooms in houses and condos:
Here:
4.1
State:
6.3
Median number of rooms in apartments:
Here:
3.1
State:
3.8
Notable locations in this zip code not listed on our city pages
Notable locations in zip code 10023: Park and Tilford Building (A), The Coronado (B), The Earlton (C), Lincoln Towers (D), Dakota Apartments (E), Beacon Theater (F), Gladys and Roland Harriman Building (G), Lincoln-Amsterdam House (H), Alvin Ailey American Dance Theater (I), Sherman Square Studios (J), Hineni Heritage Center (K), The Prasada (L), Museum of Biblical Art (M), The Chatsworth (N), Alice Tully Hall (O), Paul Recital Hall (P), Lila Acheson Wallace Library (Q), Vivian Beaumont Theater (R), Mitzi E Newhouse Theater (S), Metropolitan Opera House (T). Display/hide their locations on the map
Churches in zip code 10023 include: Universalist Church of New York (A), Congregation Shearith Israel (B), Stephen Wise Free Synagogue (C), Second Church of Christ Scientist (D), Congregation Habonim (E), Holy Trinity Lutheran Church (F), New York Society for Ethical Culture Hall (G), West Side Institutional Synagogue (H), Blessed Sacrament Roman Catholic Church (I). Display/hide their locations on the map
Parks in zip code 10023 include: Seventieth Street Playground (1), Milstein Plaza (2), Damrosch Park (3), Josie Robertson Plaza (4), Dante Park (5), Verdi Square (6), West 71st Street Historic District (7), West End-Collegiate Historic District (8), Samuel N Bennerson Playground (9). Display/hide their locations on the map
Tourist attractions (not listed on the city page) : American Folk Art Museum (2 Lincoln Square), Hayden Planetarium (Planetariums; 79 Central Park West).
6,870 married couples with children.
1,782 single-parent households (464 men, 1,318 women).
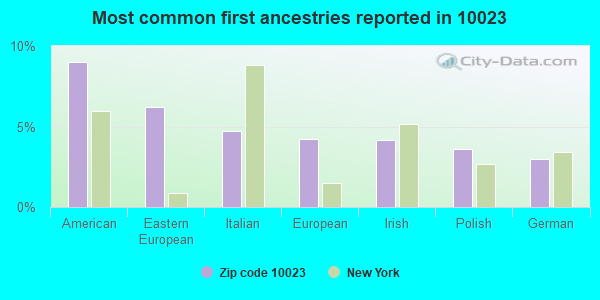
72.6% of residents of 10023 zip code speak English at home.
7.3% of residents speak Spanish at home (78% very well, 13% well, 9% not well).
9.6% of residents speak other Indo-European language at home (87% very well, 11% well, 2% not well).
8.5% of residents speak Asian or Pacific Island language at home (70% very well, 16% well, 13% not well, 1% not at all).
2.4% of residents speak other language at home (80% very well, 17% well, 3% not well).
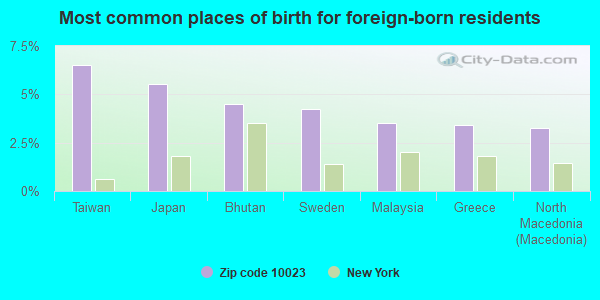
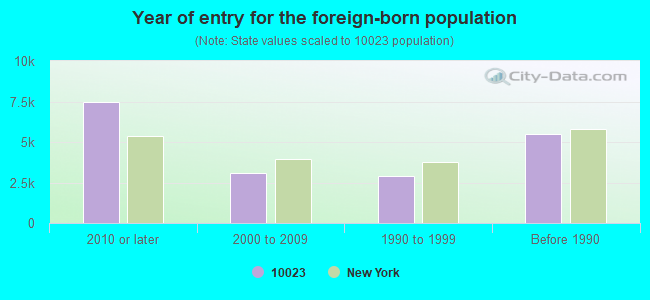
Foreign born population: 16,410 (25.4%) (52.5% of them are naturalized citizens)
Major facilities with environmental interests located in this zip code:
ABC INC-125 WEST END AVE (125 WEST END AVENUE in NEW YORK CITY, NY)
AIR MINOR (AIRS/AFS) STATE MASTER (New York facility tracking) - AIR PROGRAM HAZARDOUS WASTE BIENNIAL REPORTER (Resource Conservation and Recovery Act (tracking hazardous waste)) Large Quantity Generators, more that 1000 kg of hazardous waste/month (Resource Conservation and Recovery Act (tracking hazardous waste)) Business SIC classification: COATING, ENGRAVING, AND ALLIED SERVICES Organizations: GEZINA BOUMA (FACILITY APPLICATION CONTACT)
, AMERICAN BROADCASTING CO (LEGALLY RESPONSIBLE PARTY)
Alternative names: ABC TV NETWORK GROUP, CAPITAL CITIES ABC INC
GREEN CLEANERS (120 W 72ND ST in NEW YORK, NY)
AIR MINOR (AIRS/AFS) STATE MASTER (New York facility tracking) - AIR PROGRAM Small Quantity Generators, between 100 kg and 1000 kg of hazardous waste/month (Resource Conservation and Recovery Act (tracking hazardous waste)) Small Quantity Generators, between 100 kg and 1000 kg of hazardous waste/month (Resource Conservation and Recovery Act (tracking hazardous waste)) - notification Business SIC classification: DRYCLEANING PLANTS, EXCEPT RUG CLEANING Business NAICS classification: DRYCLEANING AND LAUNDRY SERVICES (EXCEPT COIN-OPERATED). Organizations: PETER LEE (CONTACT/OWNER)
, GREEN CLEANERS INC (LEGALLY RESPONSIBLE PARTY)
HEATHER MAC CLEANERS (129 W 72ND ST in NEW YORK, NY)
AIR MINOR (AIRS/AFS) STATE MASTER (New York facility tracking) - AIR PROGRAM, HAZARDOUS WASTE PROGRAM (Resource Conservation and Recovery Act (tracking hazardous waste)) Business SIC classification: DRYCLEANING PLANTS, EXCEPT RUG CLEANING Business NAICS classification: DRYCLEANING AND LAUNDRY SERVICES (EXCEPT COIN-OPERATED). Organizations: KANG & KANG HEE INC (LEGALLY RESPONSIBLE PARTY)
Alternative names: HEATHER MAC CLEAN INC
BERGER CLEANERS INC (4 W 63RD ST in NEW YORK, NY)
AIR MINOR (AIRS/AFS) STATE MASTER (New York facility tracking) - AIR PROGRAM Small Quantity Generators, between 100 kg and 1000 kg of hazardous waste/month (Resource Conservation and Recovery Act (tracking hazardous waste)) - notification Business SIC classification: DRYCLEANING PLANTS, EXCEPT RUG CLEANING Business NAICS classification: DRYCLEANING AND LAUNDRY SERVICES (EXCEPT COIN-OPERATED).
200 RECTOR PLACE BUILDING (200 RECTOR PLACE in NEW YORK, NY)
AIR MINOR (AIRS/AFS) STATE MASTER (New York facility tracking) - AIR PROGRAM Business SIC classification: OPERATORS OF APARTMENT BUILDINGS Business NAICS classification: LESSORS OF RESIDENTIAL BUILDINGS AND DWELLINGS. Organizations: MILFORD MANAGEMENT (AIR FEE BILLING CONTACT)
, MILFORD MANAGEMENT CORP (AIR PERMITTING FACILITY OWNER CONTACT)
, LIBERTY COURT CONDOS (LEGALLY RESPONSIBLE PARTY)
115 CENTRAL PARK WEST-THE MAJESTIC (115 CENTRAL PARK WEST in NEW YORK, NY)
AIR MINOR (AIRS/AFS) STATE MASTER (New York facility tracking) - AIR PROGRAM Business SIC classification: OPERATORS OF APARTMENT BUILDINGS Organizations: 115 CPW CORP/WALLACK MGMT, 115 CENTRAL PARK WEST CORPORATION Alternative names: 115 CENTRAL PARK CORPORATION
ANEL CLEANERS (219 COLUMBUS AVE. in NEW YORK CITY, NY)
AIR SYNTHETIC MINOR (AIRS/AFS) STATE MASTER (New York facility tracking) - AIR PROGRAM (Resource Conservation and Recovery Act (tracking hazardous waste)) Business SIC classification: DRYCLEANING PLANTS, EXCEPT RUG CLEANING Business NAICS classification: DRYCLEANING AND LAUNDRY SERVICES (EXCEPT COIN-OPERATED). Organizations: L & H DRY CLEANERS INC (LEGALLY RESPONSIBLE PARTY)
Alternative names: ANEL FRENCH CLEANERS
145 WEST 67TH ST BUILDING - TOWER 67 (145 W 67TH ST in NEW YORK CITY, NY)
AIR MINOR (AIRS/AFS) STATE MASTER (New York facility tracking) - AIR PROGRAM Business SIC classification: OPERATORS OF APARTMENT BUILDINGS Business NAICS classification: LESSORS OF RESIDENTIAL BUILDINGS AND DWELLINGS. Organizations: AMSTERCO INC (LEGALLY RESPONSIBLE PARTY)
Alternative names: 145 W 67TH SAINT BUILDING
80 CENTRAL PARK WEST APTS (80 CENTRAL PARK WEST in NEW YORK CITY, NY)
AIR MINOR (AIRS/AFS) STATE MASTER (New York facility tracking) - AIR PROGRAM Business SIC classification: OPERATORS OF APARTMENT BUILDINGS Business NAICS classification: LESSORS OF RESIDENTIAL BUILDINGS AND DWELLINGS. Organizations: GOODSTEIN MANAGEMENT INC (LEGALLY RESPONSIBLE PARTY)
235 WEST END AVENUE BUILDING (235 WEST END AVENUE in NEW YORK, NY)
AIR SYNTHETIC MINOR (AIRS/AFS) STATE MASTER (New York facility tracking) - AIR PROGRAM Business SIC classification: OPERATORS OF APARTMENT BUILDINGS Business NAICS classification: LESSORS OF RESIDENTIAL BUILDINGS AND DWELLINGS. Organizations: COOPER SQUARE MANAGEMENT REALTY, 235 WEST END AVE CORP (LEGALLY RESPONSIBLE PARTY)
165 W 66TH ST BUILDING (165 W 66TH ST in NEW YORK, NY)
AIR SYNTHETIC MINOR (AIRS/AFS) STATE MASTER (New York facility tracking) - AIR PROGRAM, AIR FACILITY REGISTRATION Business SIC classification: OPERATORS OF APARTMENT BUILDINGS Organizations: CHARLES H GREENTHAL MGMT CORP, 165 WEST 66TH STREET APARTMENT CORPORATION
263 WEST END AVENUE BUILDING (263 WEST END AVENUE in NEW YORK CITY, NY)
AIR SYNTHETIC MINOR (AIRS/AFS) STATE MASTER (New York facility tracking) - AIR PROGRAM Business SIC classification: OPERATORS OF APARTMENT BUILDINGS Business NAICS classification: LESSORS OF RESIDENTIAL BUILDINGS AND DWELLINGS. Organizations: BROWN HARRIS STEVENS LLC (AIR FEE BILLING CONTACT)
, RIVERSIDE TOWERS CORPORATION (LEGALLY RESPONSIBLE PARTY)
61 WEST 62 OWNERS CORP (61 WEST 62ND STREET in NEW YORK, NY)
AIR SYNTHETIC MINOR (AIRS/AFS) STATE MASTER (New York facility tracking) - AIR PROGRAM Business SIC classification: OPERATORS OF APARTMENT BUILDINGS Business NAICS classification: LESSORS OF RESIDENTIAL BUILDINGS AND DWELLINGS. Organizations: ROCKROSE DEVELOPMENT CORP (LEGALLY RESPONSIBLE PARTY)
Alternative names: 61 W 62ND SAINT BUILDING
Housing units lacking complete plumbing facilities: 0.8% Housing units lacking complete kitchen facilities: 1.3%
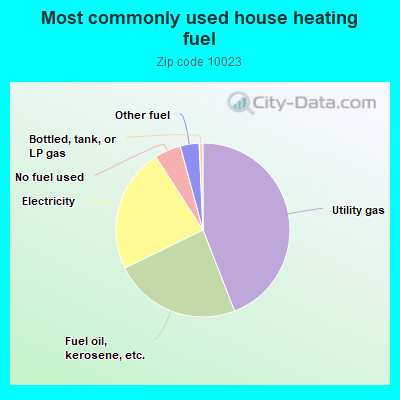
44.1%Utility gas
23.7%Fuel oil, kerosene, etc.
23.1%Electricity
4.9%No fuel used
3.5%Other fuel
0.7%Bottled, tank, or LP gas
Population in 1990: 57,385. Population change in the 1990s: +4,821 (+8.4%).
Place of birth for U.S.-born residents:
This state: 25,911
Northeast: 8,440
Midwest: 4,048
South: 4,411
West: 3,681
57% of the 10023 zip code residents lived in the same house 5 years ago. Out of people who lived in different houses, 42% lived in this county. Out of people who lived in different counties, 50% lived in New York.
85% of the 10023 zip code residents lived in the same house 1 year ago. Out of people who lived in different houses, 57% moved from this county. Out of people who lived in different houses, 14% moved from different county within same state. Out of people who lived in different houses, 21% moved from different state. Out of people who lived in different houses, 9% moved from abroad.
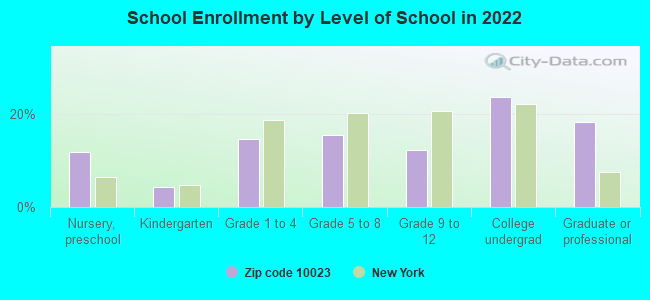
Private vs. public school enrollment:
Students in private schools in grades 1 to 8 (elementary and middle school): 1,433
Here:
42.6%
New York:
15.6%
Students in private schools in grades 9 to 12 (high school): 689
Here:
51.1%
New York:
15.0%
Students in private undergraduate colleges: 2,525
Here:
92.9%
New York:
39.2%
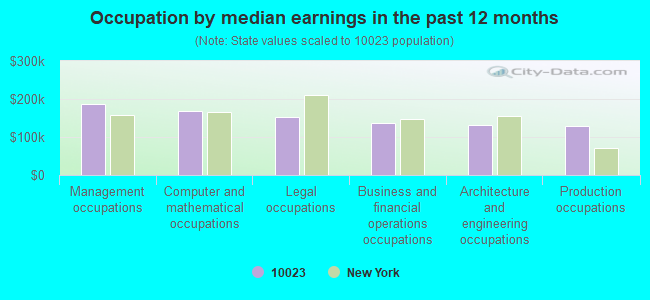
Occupation by median earnings in the past 12 months ($)
186,802Management occupations
167,887Computer and mathematical occupations
152,363Legal occupations
137,113Business and financial operations occupations
131,299Architecture and engineering occupations
128,836Production occupations
Companies with biggest federal contracts located in this zip code:
PHOEBUS OPTOELECTRONICS LLC (15 W 72ND ST APT 5A in NEW YORK, NY; small business) : $849,363 in 2 contractsfrom 2005 to 2006
$749,949 with Air Force for Defense Missile and Space Systems -- Operational Systems Development (R&D). Signed on 2006-06-26. Completion date: 2008-07-07.
$99,414, same as above.Signed on 2005-05-16. Completion date: 2006-05-16.
SESAME WORKSHOP (1 LINCOLN PLZ FRNT 4 in NEW YORK, NY) : $701,158 in 8 contractsfrom 2001 to 2006
Contracts for General Photographic Services - Still, Miscellaneous Items by Department of Defense, American Forces Information Service Signed by year:2000: $0; 2001: $301,080; 2002: $20,052; 2003: $166,422; 2004: $5,045; 2005: $163,969; 2006: $44,590.
Biggest contracts:
$301,080 with Department of Defense for General Photographic Services - Still. Signed on 2001-06-26. Completion date: 2002-06-15.
$166,422 with Department of Defense for Miscellaneous Items. Signed on 2003-06-20. Completion date: 2003-09-15.
$163,969 with American Forces Information Service for Miscellaneous Items. Signed on 2005-05-20. Completion date: 2005-06-15.
$44,590 with Department of Defense for Miscellaneous Items. Signed on 2006-03-21. Completion date: 2006-05-15.
LINCOLN CENTER FOR THE PERFORM (70 LINCOLN CENTER PLAZA in NEW YORK, NY) : $198,724 in 10 contractsfrom 2001 to 2006
Contracts for Lease or Rental of Facilities -- Miscellaneous Buildings, Other Professional Services, Construction of Structures and Facilities -- Conference Space and Facilities, Lease or Rental of Facilities -- Other Educational Buildings by Army Signed by year:2000: $0; 2001: $33,000; 2002: $34,000; 2003: $39,319; 2004: $38,913; 2005: $41,500; 2006: $11,992.
Biggest contracts:
$34,000 with Army for Lease or Rental of Facilities -- Miscellaneous Buildings. Signed on 2002-09-17. Completion date: 2002-11-16.
$33,000 with Army for Other Professional Services. Signed on 2001-05-25. Completion date: 2001-10-06.
$29,300 with Army for Lease or Rental of Facilities -- Miscellaneous Buildings. Taking place in VA. Signed on 2005-11-03. Completion date: 2005-11-12.
$29,249 with Army for Construction of Structures and Facilities -- Conference Space and Facilities. Signed on 2003-11-08. Completion date: 2003-11-08.
WORLDWIDE TELEVISION NEWS (1995 BROADWAY in NEW YORK, NY)
$60,324 with Department of Defense for General Photographic Services - Still. Signed on 1999-12-08. Completion date: 2000-12-31.
Allegro Energy Consulting (P.O. Box 230592 in New York, NY; small business) : $53,000 in 2 contractsfrom 2004 to 2005
$35,000 with Research and Innovative Technology Administration for R&D-Commercial Programs-Opsy Dev. Taking place in DC. Signed on 2004-10-08. Completion date: 2004-12-31.
$18,000, same as above.Signed on 2005-01-07. Completion date: 2005-02-28.
BLOCK, MERVIN (160 W 66TH ST 58D in NEW YORK, NY; small business) : $50,652 in 2 contractsfrom 2005 to 2006
$47,200 with Air Force for Other Education and Training Services. Signed on 2006-04-14. Completion date: 2006-08-12.
$3,452 with Air Force for Other Education and Training Services. Taking place in TX. Signed on 2005-07-08. Completion date: 2005-07-14.
JACQUELINE SHANNON (1430 W 75TH ST 1A in NEW YORK, NY; small business)
$35,000 with National Institutes of Health for Specialized Medical Services -- Management and Support (R&D). Signed on 2002-03-15. Completion date: 2002-03-15.
FLUTE CENTER OF NEW YORK (44 W 62ND ST in NEW YORK, NY; small business) : $19,510 in 2 contractsfrom 2002 to 2005
$10,010 with Air Force for Musical Instruments. Taking place in NJ. Signed on 2005-09-26. Completion date: 2005-11-25.
$9,500 with Army for Musical Instruments. Taking place in VA. Signed on 2002-04-30. Completion date: 2002-05-01.
ACORN ASSOCIATES, LTD (1 WEST 67TH ST STE 1030 in NEW YORK, NY; small business)
$9,289 with American Forces Information Service for Miscellaneous Items. Signed on 2004-02-20. Completion date: 2004-04-01.
ELI LAPP (310 WEST 72ND STREET in NEW YORK, NY; small business) : $7,000 in 2 contractsin 2003
$3,500 with Army for Chaplain Services. Signed on 2003-10-29. Completion date: 2004-09-25.
$3,500, same as above.Signed on 2003-10-10. Completion date: 2004-09-25.
Top industries in this zip code by the number of employees in 2005:
Educational Services: Colleges, Universities, and Professional Schools (over 1000 employees: 2 establishments, 250-499 employees: 2 establishments, 100-249 employees: 1 establishment)
Arts, Entertainment, and Recreation: Promoters of Performing Arts, Sports, and Similar Events with Facilities (over 1000: 1, 500-999: 1)
Arts, Entertainment, and Recreation: Theater Companies and Dinner Theaters (over 1000: 1, 100-249: 1, 20-49: 1, 10-19: 1, 1-4: 13)
Other Services (except Public Administration): Other Similar Organizations (except Business, Professional, Labor, and Political Organizations) (100-249: 1, 50-99: 4, 20-49: 7, 10-19: 33, 5-9: 29, 1-4: 32)
Real Estate and Rental and Leasing: Lessors of Residential Buildings and Dwellings (50-99: 1, 20-49: 10, 10-19: 11, 5-9: 19, 1-4: 159)
Accommodation and Food Services: Hotels (except Casino Hotels) and Motels (500-999: 1, 50-99: 1, 20-49: 3, 1-4: 3)
Arts, Entertainment, and Recreation: Musical Groups and Artists (250-499: 2, 50-99: 1, 5-9: 3, 1-4: 21)
People in group quarters in 2010:
1,511 people in college/university student housing
107 people in other noninstitutional facilities
79 people in emergency and transitional shelters (with sleeping facilities) for people experiencing homelessness
51 people in residential treatment centers for adults
29 people in nursing facilities/skilled-nursing facilities
14 people in group homes intended for adults
People in group quarters in 2000:
1,533 people in college dormitories (includes college quarters off campus)
312 people in other noninstitutional group quarters
72 people in homes for the mentally ill
22 people in religious group quarters
20 people in homes or halfway houses for drug/alcohol abuse
14 people in homes for the physically handicapped
10 people in homes for the mentally retarded
9 people in other group homes
Fatal accident statistics in 2013:
Fatal accident count: 1
Vehicles involved in fatal accidents: 2
Fatal accidents caused by drunken drivers: 0
Fatalities: 1
Persons involved in fatal accidents: 3
Pedestrians involved in fatal accidents: 0
Fatal accident statistics in 2012:
Fatal accident count: 2
Vehicles involved in fatal accidents: 2
Fatal accidents caused by drunken drivers: 0
Fatalities: 2
Persons involved in fatal accidents: 3
Pedestrians involved in fatal accidents: 2
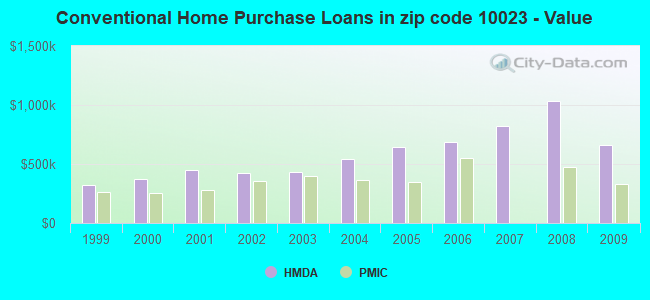
Home Mortgage Disclosure Act Aggregated Statistics For Year 2009 (Based on 5 full and 10 partial tracts)
A) FHA, FSA/RHS & VA Home Purchase Loans
B) Conventional Home Purchase Loans
C) Refinancings
D) Home Improvement Loans
E) Loans on Dwellings For 5+ Families
F) Non-occupant Loans on < 5 Family Dwellings (A B C & D)
Number
Average Value
Number
Average Value
Number
Average Value
Number
Average Value
Number
Average Value
Number
Average Value
LOANS ORIGINATED
0
$0
642
$658,652
1,377
$469,003
29
$876,320
31
$1,520,140
293
$568,383
APPLICATIONS APPROVED, NOT ACCEPTED
0
$0
135
$741,256
156
$518,825
4
$250,298
0
$0
49
$433,896
APPLICATIONS DENIED
0
$0
210
$787,007
464
$617,131
14
$210,891
1
$3,570,000
133
$719,768
APPLICATIONS WITHDRAWN
3
$407,277
143
$815,462
178
$635,283
7
$420,229
4
$7,582,725
68
$1,042,948
FILES CLOSED FOR INCOMPLETENESS
0
$0
43
$924,522
107
$735,056
1
$20,000
0
$0
31
$650,047
Aggregated Statistics For Year 2008 (Based on 5 full and 10 partial tracts)
A) FHA, FSA/RHS & VA Home Purchase Loans
B) Conventional Home Purchase Loans
C) Refinancings
D) Home Improvement Loans
E) Loans on Dwellings For 5+ Families
F) Non-occupant Loans on < 5 Family Dwellings (A B C & D)
G) Loans On Manufactured Home Dwelling (A B C & D)
Number
Average Value
Number
Average Value
Number
Average Value
Number
Average Value
Number
Average Value
Number
Average Value
Number
Average Value
LOANS ORIGINATED
0
$0
1,001
$1,033,062
412
$643,270
32
$1,219,640
24
$5,270,315
277
$1,128,175
0
$0
APPLICATIONS APPROVED, NOT ACCEPTED
0
$0
218
$850,522
87
$722,607
8
$527,680
1
$3,375,000
63
$872,019
0
$0
APPLICATIONS DENIED
0
$0
311
$955,489
160
$761,059
17
$236,109
3
$1,740,000
81
$963,673
1
$35,300
APPLICATIONS WITHDRAWN
0
$0
169
$1,563,907
80
$1,160,619
4
$301,750
1
$2,736,020
56
$1,058,030
0
$0
FILES CLOSED FOR INCOMPLETENESS
1
$583,000
61
$1,004,296
39
$1,109,691
6
$690,257
0
$0
22
$735,162
0
$0
Aggregated Statistics For Year 2007 (Based on 5 full and 10 partial tracts)
B) Conventional Home Purchase Loans
C) Refinancings
D) Home Improvement Loans
E) Loans on Dwellings For 5+ Families
F) Non-occupant Loans on < 5 Family Dwellings (A B C & D)
G) Loans On Manufactured Home Dwelling (A B C & D)
Number
Average Value
Number
Average Value
Number
Average Value
Number
Average Value
Number
Average Value
Number
Average Value
LOANS ORIGINATED
1,208
$819,916
396
$703,997
37
$361,495
40
$3,649,107
305
$793,260
1
$47,000
APPLICATIONS APPROVED, NOT ACCEPTED
244
$907,186
78
$677,316
10
$211,297
4
$2,452,395
45
$649,016
0
$0
APPLICATIONS DENIED
244
$990,220
163
$826,291
27
$344,355
1
$2,000,000
95
$777,945
0
$0
APPLICATIONS WITHDRAWN
167
$1,377,601
73
$1,013,765
6
$577,735
1
$1,550,000
34
$1,778,294
0
$0
FILES CLOSED FOR INCOMPLETENESS
39
$1,875,526
26
$575,409
6
$454,880
0
$0
11
$1,587,621
0
$0
Aggregated Statistics For Year 2006 (Based on 5 full and 10 partial tracts)
B) Conventional Home Purchase Loans
C) Refinancings
D) Home Improvement Loans
E) Loans on Dwellings For 5+ Families
F) Non-occupant Loans on < 5 Family Dwellings (A B C & D)
G) Loans On Manufactured Home Dwelling (A B C & D)
Number
Average Value
Number
Average Value
Number
Average Value
Number
Average Value
Number
Average Value
Number
Average Value
LOANS ORIGINATED
1,012
$684,550
344
$617,577
37
$263,166
40
$4,864,356
289
$660,161
0
$0
APPLICATIONS APPROVED, NOT ACCEPTED
204
$610,058
64
$785,654
8
$213,135
0
$0
43
$488,322
0
$0
APPLICATIONS DENIED
190
$670,651
122
$715,370
25
$300,385
2
$875,000
52
$707,114
0
$0
APPLICATIONS WITHDRAWN
156
$661,453
79
$780,782
10
$566,239
4
$12,261,250
51
$710,839
1
$356,000
FILES CLOSED FOR INCOMPLETENESS
40
$612,020
35
$807,971
2
$182,500
0
$0
11
$614,886
0
$0
Aggregated Statistics For Year 2005 (Based on 5 full and 10 partial tracts)
B) Conventional Home Purchase Loans
C) Refinancings
D) Home Improvement Loans
E) Loans on Dwellings For 5+ Families
F) Non-occupant Loans on < 5 Family Dwellings (A B C & D)
Number
Average Value
Number
Average Value
Number
Average Value
Number
Average Value
Number
Average Value
LOANS ORIGINATED
1,078
$643,073
533
$577,166
49
$410,289
58
$2,158,156
291
$568,011
APPLICATIONS APPROVED, NOT ACCEPTED
200
$732,453
91
$544,957
16
$117,457
0
$0
35
$691,233
APPLICATIONS DENIED
196
$752,487
126
$597,711
36
$222,035
3
$2,241,053
48
$495,216
APPLICATIONS WITHDRAWN
143
$694,057
88
$729,425
8
$246,390
4
$9,954,700
26
$579,598
FILES CLOSED FOR INCOMPLETENESS
45
$860,445
48
$1,397,618
4
$300,472
0
$0
16
$955,851
Aggregated Statistics For Year 2004 (Based on 5 full and 10 partial tracts)
B) Conventional Home Purchase Loans
C) Refinancings
D) Home Improvement Loans
E) Loans on Dwellings For 5+ Families
F) Non-occupant Loans on < 5 Family Dwellings (A B C & D)
G) Loans On Manufactured Home Dwelling (A B C & D)
Number
Average Value
Number
Average Value
Number
Average Value
Number
Average Value
Number
Average Value
Number
Average Value
LOANS ORIGINATED
1,217
$541,313
791
$458,494
40
$291,627
63
$2,997,543
261
$516,857
0
$0
APPLICATIONS APPROVED, NOT ACCEPTED
240
$656,330
135
$357,507
3
$118,333
1
$8,500,000
52
$347,494
0
$0
APPLICATIONS DENIED
204
$567,776
164
$395,833
20
$150,816
2
$9,092,400
60
$503,472
4
$50,065
APPLICATIONS WITHDRAWN
156
$701,397
112
$327,989
4
$258,750
3
$1,816,667
42
$428,688
0
$0
FILES CLOSED FOR INCOMPLETENESS
26
$671,506
25
$362,772
7
$197,114
0
$0
4
$217,892
0
$0
Aggregated Statistics For Year 2003 (Based on 5 full and 10 partial tracts)
B) Conventional Home Purchase Loans
C) Refinancings
D) Home Improvement Loans
E) Loans on Dwellings For 5+ Families
F) Non-occupant Loans on < 5 Family Dwellings (A B C & D)
Number
Average Value
Number
Average Value
Number
Average Value
Number
Average Value
Number
Average Value
LOANS ORIGINATED
1,171
$434,918
2,475
$342,881
3
$453,530
69
$2,133,405
333
$343,882
APPLICATIONS APPROVED, NOT ACCEPTED
165
$516,223
295
$361,585
7
$97,131
0
$0
41
$261,893
APPLICATIONS DENIED
164
$535,739
340
$405,413
26
$88,814
1
$7,000,000
55
$397,189
APPLICATIONS WITHDRAWN
94
$482,692
156
$393,432
2
$35,000
6
$1,561,000
24
$373,198
FILES CLOSED FOR INCOMPLETENESS
51
$409,108
86
$328,794
6
$210,662
0
$0
10
$352,491
Aggregated Statistics For Year 2002 (Based on 5 full and 10 partial tracts)
B) Conventional Home Purchase Loans
C) Refinancings
D) Home Improvement Loans
E) Loans on Dwellings For 5+ Families
F) Non-occupant Loans on < 5 Family Dwellings (A B C & D)
Number
Average Value
Number
Average Value
Number
Average Value
Number
Average Value
Number
Average Value
LOANS ORIGINATED
1,043
$424,811
1,571
$394,905
17
$115,865
51
$4,806,667
199
$363,318
APPLICATIONS APPROVED, NOT ACCEPTED
205
$438,378
242
$393,217
8
$56,881
2
$7,577,000
30
$467,132
APPLICATIONS DENIED
119
$444,060
247
$349,191
18
$356,488
7
$1,394,346
48
$335,335
APPLICATIONS WITHDRAWN
105
$463,192
127
$399,210
12
$106,064
9
$927,221
26
$421,173
FILES CLOSED FOR INCOMPLETENESS
43
$413,227
62
$389,751
1
$100,000
0
$0
5
$175,524
Aggregated Statistics For Year 2001 (Based on 5 full and 10 partial tracts)
B) Conventional Home Purchase Loans
C) Refinancings
D) Home Improvement Loans
E) Loans on Dwellings For 5+ Families
F) Non-occupant Loans on < 5 Family Dwellings (A B C & D)
Number
Average Value
Number
Average Value
Number
Average Value
Number
Average Value
Number
Average Value
LOANS ORIGINATED
878
$452,924
843
$368,301
20
$89,754
38
$2,727,844
152
$442,316
APPLICATIONS APPROVED, NOT ACCEPTED
142
$413,554
155
$367,193
4
$72,500
0
$0
35
$357,357
APPLICATIONS DENIED
138
$492,213
165
$373,026
19
$64,227
0
$0
39
$344,824
APPLICATIONS WITHDRAWN
93
$588,209
91
$343,390
12
$44,179
8
$914,030
18
$364,953
FILES CLOSED FOR INCOMPLETENESS
31
$442,308
40
$348,011
1
$69,000
0
$0
10
$182,613
Aggregated Statistics For Year 2000 (Based on 5 full and 10 partial tracts)
A) FHA, FSA/RHS & VA Home Purchase Loans
B) Conventional Home Purchase Loans
C) Refinancings
D) Home Improvement Loans
E) Loans on Dwellings For 5+ Families
F) Non-occupant Loans on < 5 Family Dwellings (A B C & D)
Number
Average Value
Number
Average Value
Number
Average Value
Number
Average Value
Number
Average Value
Number
Average Value
LOANS ORIGINATED
0
$0
1,076
$374,712
217
$415,463
29
$235,071
36
$1,848,486
112
$361,082
APPLICATIONS APPROVED, NOT ACCEPTED
0
$0
174
$373,334
28
$238,216
9
$43,627
0
$0
12
$226,833
APPLICATIONS DENIED
2
$136,780
164
$385,690
87
$269,286
16
$84,166
2
$545,000
31
$320,565
APPLICATIONS WITHDRAWN
0
$0
90
$666,067
48
$225,601
15
$99,919
6
$1,516,667
12
$425,912
FILES CLOSED FOR INCOMPLETENESS
0
$0
27
$303,683
13
$176,378
10
$60,040
0
$0
3
$675,000
Aggregated Statistics For Year 1999 (Based on 6 full and 4 partial tracts)
A) FHA, FSA/RHS & VA Home Purchase Loans
B) Conventional Home Purchase Loans
C) Refinancings
D) Home Improvement Loans
E) Loans on Dwellings For 5+ Families
F) Non-occupant Loans on < 5 Family Dwellings (A B C & D)
2007 - 2018 National Fire Incident Reporting System (NFIRS) incidents
Based on the data from the years 2007 - 2018 the average number of fires per year is 157. The highest number of reported fire incidents - 194 took place in 2010, and the least - 122 in 2012. The data has a rising trend.
When looking into fire subcategories, the most reports belonged to: Structure Fires (69.2%), and Outside Fires (21.7%).
Fire incident types reported to NFIRS in Zip Code 10023


+$4,154
-$2,666
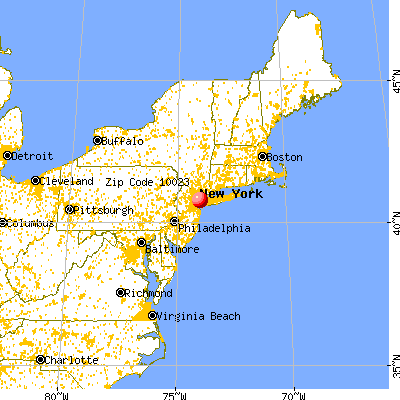
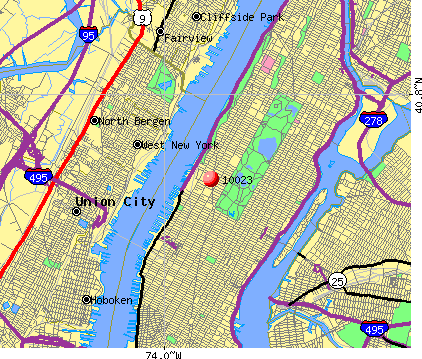 Nearest zip codes: 10069, 10019, 10103, 10153, 10112, 10111.


 Based on the data from the years 2007 - 2018 the average number of fires per year is 157. The highest number of reported fire incidents - 194 took place in 2010, and the least - 122 in 2012. The data has a rising trend.
 When looking into fire subcategories, the most reports belonged to: Structure Fires (69.2%), and Outside Fires (21.7%).