Estimated zip code population in 2022: 11,167 Zip code population in 2010: 12,610 Zip code population in 2000: 14,418
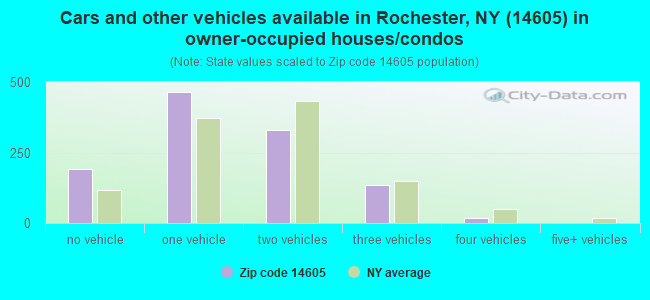
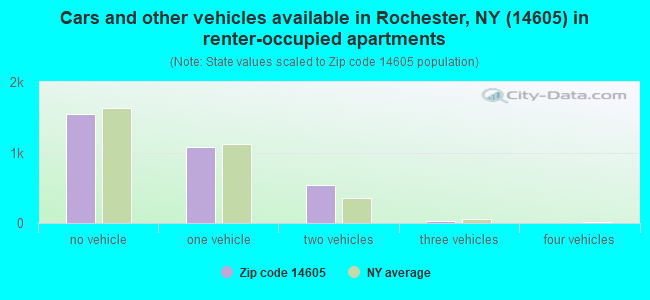
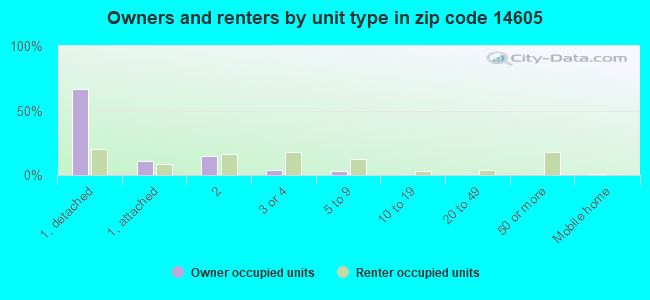
Houses and condos: 5,035 Renter-occupied apartments: 3,196
% of renters here:
74%
State:
46%
March 2022 cost of living index in zip code 14605: 102.6 (near average, U.S. average is 100)
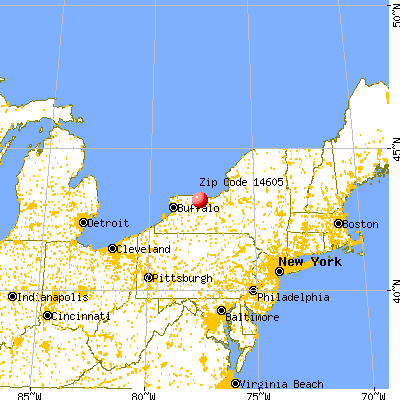
Land area: 1.8 sq. mi. Water area: 0.0 sq. mi.
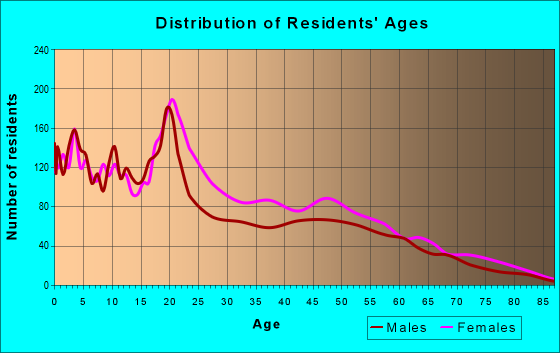
Population density: 6,178 people per square mile
(high).
OSM Map
General Map
Google Map
MSN Map
OSM Map
General Map
Google Map
MSN Map
OSM Map
General Map
Google Map
MSN Map
OSM Map
General Map
Google Map
MSN Map
Please wait while loading the map...
Real estate property taxes paid for housing units in 2022:
This zip code:
2.3% ($1,955)
New York:
1.5% ($6,180)
Median real estate property taxes paid for housing units with mortgages in 2022: $2,492 (2.8%) Median real estate property taxes paid for housing units with no mortgage in 2022: $1,632 (2.5%)
Averages for the 2020 tax year for zip code 14605, filed in 2021:
Average Adjusted Gross Income (AGI) in 2020: $26,656 (Individual Income Tax Returns)
Here:
$26,656
State:
$90,930
Salary/wage: $22,852 (reported on 90.2% of returns)
Here:
$22,852
State:
$72,104
(% of AGI for various income ranges: 1145.6% for AGIs below $25k, 3293.1% for AGIs $25k-50k, 6988.9% for AGIs $50k-75k, 11143.3% for AGIs $75k-100k, 23753.3% for AGIs $100k-200k)
Taxable interest for individuals: $324 (reported on 8.2% of returns)
This zip code:
$324
New York:
$3,075
(% of AGI for various income ranges: 0.9% for AGIs below $25k, 1.5% for AGIs $25k-50k, 3.7% for AGIs $50k-75k, 243.3% for AGIs $100k-200k)
Ordinary dividends: $6,989 (reported on 2.0% of returns)
Here:
$6,989
State:
$11,095
(% of AGI for various income ranges: 2.4% for AGIs $25k-50k, 1990.0% for AGIs $100k-200k)
Net capital gain/loss in AGI: +$8,000 (reported on 1.8% of returns)
Here:
+$8,000
State:
+$44,925
(% of AGI for various income ranges: 0.5% for AGIs $25k-50k, 2110.0% for AGIs $100k-200k)
Profit/loss from business: +$6,963 (reported on 9.1% of returns)
Here:
+$6,963
State:
+$14,940
(% of AGI for various income ranges: 64.2% for AGIs below $25k, 68.5% for AGIs $25k-50k, 274.2% for AGIs $50k-75k)
Taxable individual retirement arrangement distribution: $23,786 (reported on 1.6% of returns)
14605:
$23,786
New York:
$19,609
(% of AGI for various income ranges: 4.4% for AGIs below $25k, 14.4% for AGIs $25k-50k, 4590.0% for AGIs $75k-100k)
Total itemized deductions: $32,675 (reported on 0.9% of returns)
Here:
$32,675
State:
$39,326
(% of AGI for various income ranges: 4356.7% for AGIs $75k-100k)
Charity contributions: $10,250 (reported on 0.9% of returns)
Here:
$10,250
State:
$15,420
(% of AGI for various income ranges: 1366.7% for AGIs $75k-100k)
Taxes paid: $8,825 (reported on 0.9% of returns)
14605:
$8,825
State:
$9,183
(% of AGI for various income ranges: 1176.7% for AGIs $75k-100k)
Earned income credit: $2,705 (reported on 49.2% of returns)
Here:
$2,705
State:
$2,138
(% of AGI for various income ranges: 180.6% for AGIs below $25k, 147.6% for AGIs $25k-50k)
Percentage of individuals using paid preparers for their 2020 taxes: 94.9%
Here:
95%
State:
95%
(% for various income ranges: 94.2% for AGIs below $25k, 96.1% for AGIs $25k-50k, 92.6% for AGIs $50k-75k, 100.0% for AGIs $75k-100k, 100.0% for AGIs $100k-200k, 100.0% for AGIs over 200k)
Averages for the 2012 tax year for zip code 14605, filed in 2013:
Average Adjusted Gross Income (AGI) in 2012: $20,913 (Individual Income Tax Returns)
Here:
$20,913
State:
$77,088
Salary/wage: $18,845 (reported on 88.6% of returns)
Here:
$18,845
State:
$60,593
(% of AGI for various income ranges: 82.2% for AGIs below $25k, 88.9% for AGIs $25k-50k, 86.8% for AGIs $50k-75k, 66.5% for AGIs $75k-100k, 46.5% for AGIs $100k-200k)
Taxable interest for individuals: $250 (reported on 8.6% of returns)
This zip code:
$250
New York:
$3,125
(% of AGI for various income ranges: 0.3% for AGIs $50k-75k, 0.3% for AGIs $100k-200k)
Ordinary dividends: $10,610 (reported on 2.5% of returns)
Here:
$10,610
State:
$10,299
(% of AGI for various income ranges: 1.3% for AGIs below $25k, 5.5% for AGIs $100k-200k)
Net capital gain/loss in AGI: +$6,140 (reported on 1.3% of returns)
Here:
+$6,140
State:
+$42,474
Profit/loss from business: +$8,746 (reported on 11.7% of returns)
Here:
+$8,746
State:
+$16,168
(% of AGI for various income ranges: 7.4% for AGIs below $25k, 3.1% for AGIs $25k-50k, 6.7% for AGIs $50k-75k)
Taxable individual retirement arrangement distribution: $8,375 (reported on 2.0% of returns)
14605:
$8,375
New York:
$17,621
Total itemized deductions: $19,047 (23% of AGI, reported on 4.8% of returns)
Here:
$19,047
State:
$34,985
Here:
22.9% of AGI
State:
21.3% of AGI
(% of AGI for various income ranges: 0.9% for AGIs below $25k, 2.9% for AGIs $25k-50k, 12.6% for AGIs $50k-75k, 15.5% for AGIs $100k-200k)
Charity contributions: $5,364 (reported on 3.6% of returns)
Here:
$5,364
State:
$5,572
(% of AGI for various income ranges: 0.1% for AGIs below $25k, 0.6% for AGIs $25k-50k, 2.6% for AGIs $50k-75k, 3.5% for AGIs $100k-200k)
Taxes paid: $8,305 (reported on 4.8% of returns)
14605:
$8,305
State:
$18,656
(% of AGI for various income ranges: 0.2% for AGIs below $25k, 1.0% for AGIs $25k-50k, 5.0% for AGIs $50k-75k, 8.4% for AGIs $100k-200k)
Earned income credit: $2,723 (reported on 59.4% of returns)
Here:
$2,723
State:
$2,230
(% of AGI for various income ranges: 15.3% for AGIs below $25k, 2.8% for AGIs $25k-50k)
Percentage of individuals using paid preparers for their 2012 taxes: 47.5%
Here:
47%
State:
66%
(% for various income ranges: 47.0% for AGIs below $25k, 47.4% for AGIs $25k-50k, 61.5% for AGIs $50k-75k, 75.0% for AGIs $100k-200k)
Averages for the 2004 tax year for zip code 14605, filed in 2005:
Average Adjusted Gross Income (AGI) in 2004: $18,579 (Individual Income Tax Returns)
Here:
$18,579
State:
$59,519
Salary/wage: $17,424 (reported on 91.7% of returns)
Here:
$17,424
State:
$50,673
(% of AGI for various income ranges: 91.8% for AGIs below $10k, 91.8% for AGIs $10k-25k, 91.9% for AGIs $25k-50k, 79.4% for AGIs $50k-75k, 72.3% for AGIs $75k-100k, 54.4% for AGIs over 100k)
Taxable interest for individuals: $351 (reported on 11.2% of returns)
This zip code:
$351
New York:
$2,377
(% of AGI for various income ranges: 0.2% for AGIs below $10k, 0.2% for AGIs $10k-25k, 0.1% for AGIs $25k-50k, 0.1% for AGIs $50k-75k, 0.1% for AGIs $75k-100k, 0.7% for AGIs over 100k)
Taxable dividends: $5,203 (reported on 3.1% of returns)
Here:
$5,203
State:
$5,394
(% of AGI for various income ranges: 0.1% for AGIs below $10k, 0.1% for AGIs $10k-25k, 0.2% for AGIs $25k-50k, 1.5% for AGIs $50k-75k, 5.6% for AGIs over 100k)
Net capital gain/loss: +$4,678 (reported on 2.2% of returns)
Here:
+$4,678
State:
+$23,581
(% of AGI for various income ranges: -0.2% for AGIs below $10k, -0.0% for AGIs $10k-25k, -0.0% for AGIs $25k-50k, 0.2% for AGIs $50k-75k, 4.8% for AGIs over 100k)
Profit/loss from business: +$5,991 (reported on 8.7% of returns)
Here:
+$5,991
State:
+$13,809
(% of AGI for various income ranges: 9.3% for AGIs below $10k, 3.0% for AGIs $10k-25k, 1.3% for AGIs $25k-50k, 3.6% for AGIs over 100k)
IRA payment deduction: $1,071 (reported on 0.4% of returns)
14605:
$1,071
New York:
$3,115
Total itemized deductions: $16,089 (25% of AGI, reported on 6.6% of returns)
Here:
$16,089
State:
$25,864
Here:
24.8% of AGI
State:
21.9% of AGI
(% of AGI for various income ranges: 2.3% for AGIs $10k-25k, 5.5% for AGIs $25k-50k, 10.0% for AGIs $50k-75k, 13.1% for AGIs $75k-100k, 17.7% for AGIs over 100k)
Charity contributions deductions: $3,894 (6% of AGI, reported on 5.8% of returns)
Here:
$3,894
State:
$4,439
Here:
5.7% of AGI
State:
3.6% of AGI
(% of AGI for various income ranges: 0.5% for AGIs $10k-25k, 1.4% for AGIs $25k-50k, 2.8% for AGIs $50k-75k, 2.6% for AGIs $75k-100k, 2.8% for AGIs over 100k)
Total tax: $2,751 (reported on 40.7% of returns)
14605:
$2,751
State:
$11,730
(% of AGI for various income ranges: 2.0% for AGIs below $10k, 2.1% for AGIs $10k-25k, 5.4% for AGIs $25k-50k, 9.2% for AGIs $50k-75k, 11.6% for AGIs $75k-100k, 20.7% for AGIs over 100k)
Earned income credit: $2,101 (reported on 60.9% of returns)
Here:
$2,101
State:
$1,757
Percentage of individuals using paid preparers for their 2004 taxes: 75.3%
Here:
75%
State:
67%
(% for various income ranges: 72.8% for AGIs below $10k, 80.8% for AGIs $10k-25k, 67.2% for AGIs $25k-50k, 65.6% for AGIs $50k-75k, 78.9% for AGIs $75k-100k, 84.2% for AGIs over 100k)
Likely homosexual households (counted as self-reported same-sex unmarried-partner households)
Lesbian couples: 0.2% of all households
Gay men: 0.1% of all households
Household received Food Stamps/SNAP in the past 12 months: 2,644 Household did not receive Food Stamps/SNAP in the past 12 months: 1,894
Women who had a birth in the past 12 months: 76 (26 now married, 51 unmarried) Women who did not have a birth in the past 12 months: 2,545 (539 now married, 2,024 unmarried)
Housing units in zip code 14605 with a mortgage: 536 (31 second mortgage, 26 both second mortgage and home equity loan) Houses without a mortgage: 28
Median monthly owner costs for units with a mortgage: $1,013 Median monthly owner costs for units without a mortgage: $509
Residents with income below the poverty level in 2022:
This zip code:
45.2%
Whole state:
14.3%
Residents with income below 50% of the poverty level in 2022:
This zip code:
20.6%
Whole state:
6.8%
Median number of rooms in houses and condos:
Here:
6.2
State:
6.3
Median number of rooms in apartments:
Here:
4.3
State:
3.8
Notable locations in this zip code not listed on our city pages
Churches in zip code 14605 include: Antioch Baptist Church (A), Bethesda Church of God in Christ (B), Corpus Christi Church (C), Eden Christian Church (D), Faith Chapel Apostolic Church (E), Faith Deliverance Christian Church (F), First Born Church of the Living God (G), First Church Divine (H), First Genesis Baptist Church (I). Display/hide their locations on the map
509 married couples with children.
2,124 single-parent households (93 men, 2,031 women).
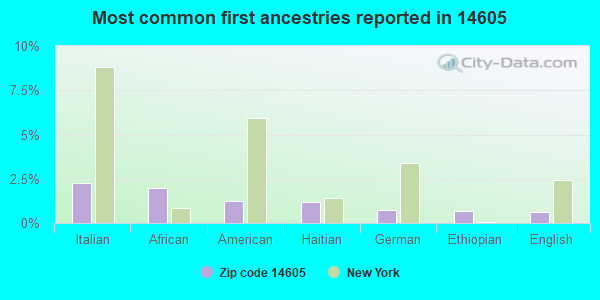
61.3% of residents of 14605 zip code speak English at home.
29.3% of residents speak Spanish at home (42% very well, 19% well, 26% not well, 13% not at all).
5.3% of residents speak other Indo-European language at home (49% very well, 33% well, 16% not well, 1% not at all).
0.4% of residents speak Asian or Pacific Island language at home (78% very well, 22% not well).
3.8% of residents speak other language at home (42% very well, 47% well, 9% not well, 2% not at all).
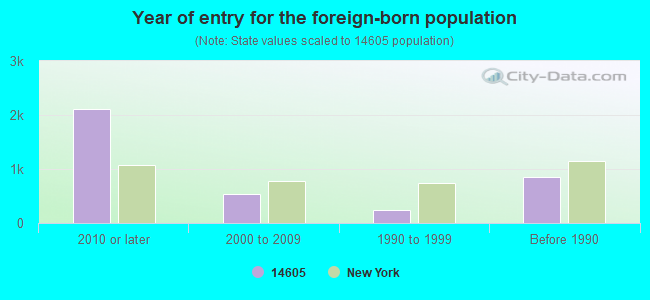
Foreign born population: 1,283 (11.5%) (68.1% of them are naturalized citizens)
Major facilities with environmental interests located in this zip code:
HIGH FALLS BREWING COMPANY (445 SAINT PAUL STREET in ROCHESTER, NY)
AIR SYNTHETIC MINOR (AIRS/AFS) - ICIS-, ENFORCEMENT/COMPLIANCE ACTIVITY STATE MASTER (New York facility tracking) - AIR PROGRAM, REFUSE DISPOSAL, HAZARDOUS WASTE PROGRAM CRITERIA AND HAZARDOUS AIR POLLUTANT INVENTORY (Inventory of air pollution sources) Small Quantity Generators, between 100 kg and 1000 kg of hazardous waste/month (Resource Conservation and Recovery Act (tracking hazardous waste)) - notification TRI REPORTER (Tracking of toxic chemicals releasing facilities) Business SIC classification: MALT BEVERAGES Organizations: GENESEE BREWING CO INC (CONTACT/OWNER)
, HIGH FALLS BREWING CO LLC (CONTACT/OWNER)
Alternative names: GENESEE BREWING CO INC, GENESEE BREWING ROCHES, HIGH FALLS BREWING CO LLC, HIGH FALLS BREWING CO. L.L.C.
AMETEK INC (255 NORTH UNION STREET in ROCHESTER, NY)
AIR SYNTHETIC MINOR (AIRS/AFS) STATE MASTER (New York facility tracking) - AIR PROGRAM, HAZARDOUS WASTE PROGRAM CRITERIA AND HAZARDOUS AIR POLLUTANT INVENTORY (Inventory of air pollution sources) HAZARDOUS WASTE BIENNIAL REPORTER (Resource Conservation and Recovery Act (tracking hazardous waste)) Large Quantity Generators, more that 1000 kg of hazardous waste/month (Resource Conservation and Recovery Act (tracking hazardous waste)) - notification TRI REPORTER (Tracking of toxic chemicals releasing facilities) Business SIC classification: RELAYS AND INDUSTRIAL CONTROLS; INDUSTRIAL INSTRUMENTS FOR MEASUREMENT, DISPLAY, AND CONTROL OF PROCESS VARIABLES; AND RELATED PRODUCTS; INSTRUMENTS FOR MEASURING AND TESTING OF ELECTRICITY AND ELECTRICAL SIGNALS Business NAICS classification: POWER, DISTRIBUTION, AND SPECIALTY TRANSFORMER MANUFACTURING.; RELAY AND INDUSTRIAL CONTROL MANUFACTURING. Organizations: ROCHESTER INSTRUMENT SYSTEMS INC (LEGALLY RESPONSIBLE PARTY)
Alternative names: AMETEK POWER INSTRUMENTS, ROCHESTER INSTRUMENT SYSTEMS
COATING TECHNOLOGY (800 ST PAUL ST MAIN FLOOR in ROCHESTER, NY)
STATE MASTER (New York facility tracking) - AIR PROGRAM, REFUSE DISPOSAL, HAZARDOUS WASTE PROGRAM, (Resource Conservation and Recovery Act (tracking hazardous waste)) Business SIC and NAICS classification: ELECTROPLATING, PLATING, POLISHING, ANODIZING, AND COLORING Organizations: CASE HOYT CORP (LEGALLY RESPONSIBLE PARTY)
, COATING TECHNOLOGY INC (LEGALLY RESPONSIBLE PARTY)
GERMANOW-SIMON CORP (408 SAINT PAUL ST in ROCHESTER, NY)
(Integrated Compliance Information System) - ICIS-02-1991-0017, FORMAL ENFORCEMENT ACTION COMPLIANCE ACTIVITY (Tracking inspections of insecticide, fungicide, and rodenticide, and toxic substances) Conditionally Exempt Small Quantity Generators, less than 100 kg/month of hazardous waste (Resource Conservation and Recovery Act (tracking hazardous waste)) HAZARDOUS WASTE BIENNIAL REPORTER (Resource Conservation and Recovery Act (tracking hazardous waste)) Business SIC classification: PLASTICS PRODUCTS; SPECIAL INDUSTRY MACHINERY; MEASURING AND CONTROLLING DEVICES
GLASS FAB (257 ORMOND ST in ROCHESTER, NY)
STATE MASTER (New York facility tracking) - AIR PROGRAM, HAZARDOUS WASTE PROGRAM Small Quantity Generators, between 100 kg and 1000 kg of hazardous waste/month (Resource Conservation and Recovery Act (tracking hazardous waste)) - notification Business SIC classification: CEMENT, HYDRAULIC Business NAICS classification: CEMENT MANUFACTURING. Organizations: ROBERT SALTZMAN (CONTACT/OWNER)
, GLASS FAB INC (LEGALLY RESPONSIBLE PARTY)
ADFLEX CORP (300 ORMOND ST in ROCHESTER, NY)
Conditionally Exempt Small Quantity Generators, less than 100 kg/month of hazardous waste (Resource Conservation and Recovery Act (tracking hazardous waste)) Organizations: JOSEPH ANDOLORA (CONTACT/OPERATOR)
AMTRAK NRPC ROCHESTER STATION (320 CENTRAL AVE in ROCHESTER, NY)
Conditionally Exempt Small Quantity Generators, less than 100 kg/month of hazardous waste (Resource Conservation and Recovery Act (tracking hazardous waste)) Organizations: NATIONAL RAILROAD PASS CORP (CONTACT/OWNER)
APPLIED FINISHING TECHNOLOGIES (33 HUDSON AVE in ROCHESTER, NY)
(Resource Conservation and Recovery Act (tracking hazardous waste))
HALLENBECK RITZ INC (658 NORTH ST in ROCHESTER, NY)
(Resource Conservation and Recovery Act (tracking hazardous waste))
CONRAIL C&S ROCHESTER (27 MARIATTA ST in ROCHESTER, NY)
(Resource Conservation and Recovery Act (tracking hazardous waste))
CRAIG AUTOMETRICS INC (74 GROVE ST in ROCHESTER, NY)
(Resource Conservation and Recovery Act (tracking hazardous waste))
ALLIANCE COLLISION (532 NORTH ST in ROCHESTER, NY)
Small Quantity Generators, between 100 kg and 1000 kg of hazardous waste/month (Resource Conservation and Recovery Act (tracking hazardous waste)) - notification Organizations: DANIEL & ANTHONY TANTALO (CONTACT/OWNER)
Alternative names: ALLIANCE GARAGE
ARMORED MOTOR SERVICE OF AMERICA INC (15 HUDSON AVE in ROCHESTER, NY)
Housing units lacking complete plumbing facilities: 4.4% Housing units lacking complete kitchen facilities: 5.2%
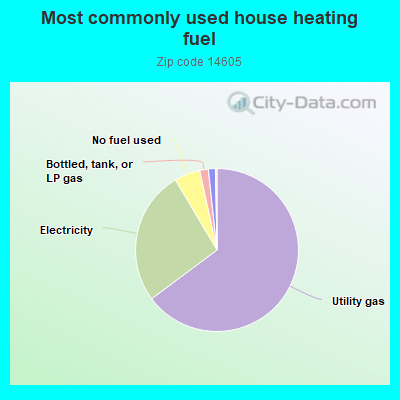
64.8%Utility gas
26.7%Electricity
5.1%No fuel used
1.7%Bottled, tank, or LP gas
1.4%Fuel oil, kerosene, etc.
Population in 1990: 15,196.
Place of birth for U.S.-born residents:
This state: 6,139
Northeast: 208
Midwest: 136
South: 962
West: 169
45% of the 14605 zip code residents lived in the same house 5 years ago. Out of people who lived in different houses, 82% lived in this county. Out of people who lived in different counties, 50% lived in New York.
89% of the 14605 zip code residents lived in the same house 1 year ago. Out of people who lived in different houses, 70% moved from this county. Out of people who lived in different houses, 15% moved from different county within same state. Out of people who lived in different houses, 8% moved from different state. Out of people who lived in different houses, 6% moved from abroad.
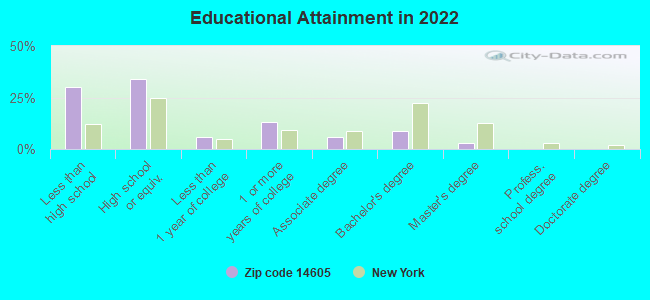
Private vs. public school enrollment:
Students in private schools in grades 1 to 8 (elementary and middle school): 136
Here:
9.5%
New York:
15.6%
Students in private schools in grades 9 to 12 (high school): 73
Here:
10.7%
New York:
15.0%
Students in private undergraduate colleges: 274
Here:
42.6%
New York:
39.2%
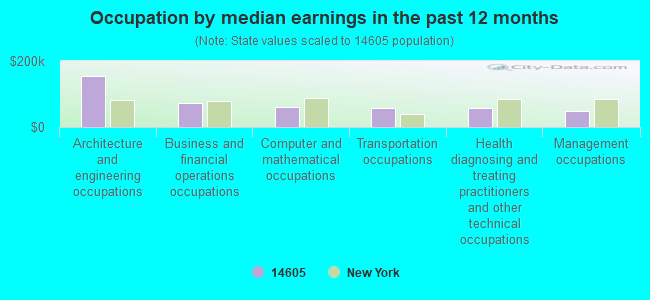
Occupation by median earnings in the past 12 months ($)
155,321Architecture and engineering occupations
71,877Business and financial operations occupations
60,440Computer and mathematical occupations
58,771Transportation occupations
57,345Health diagnosing and treating practitioners and other technical occupations
48,199Management occupations
Companies with federal contracts located in this zip code (ROCHESTER, NY):
AMETEK POWER INSTRUMENTS (255 NORTH UNION STREET) : $1,359,258 in 49 contractsfrom 2000 to 2006
Contracts for Communications Security Equipment and Components, Miscellaneous Electric Power and Distribution Equipment, Sound Recording and Reproducing Equipment, Cable, Cord, and Wire Assemblies: Communications Equipment, and moreby U.S. Army Corps of Engineers - civil program financing only, ENERGY, Department of, Tennessee Valley Authority, Defense Logistics Agency, and others Signed by year:2000: $117,975; 2001: $577,769; 2002: $81,865; 2003: $50,341; 2004: $314,146; 2005: $210,190; 2006: $6,972.
Biggest contracts:
$567,381 with U.S. Army Corps of Engineers - civil program financing only for Communications Security Equipment and Components. Signed on 2001-09-10. Completion date: 2001-02-08.
$113,430 with ENERGY, Department of for Miscellaneous Electric Power and Distribution Equipment. Signed on 2005-01-19. Completion date: 2005-03-11.
$100,574, same as above.Signed on 2004-03-18. Completion date: 2004-04-30.
$84,600 with ENERGY, Department of for Sound Recording and Reproducing Equipment. Signed on 2004-03-19. Completion date: 2004-04-02.
ELTREX INDUSTRIES, INC (65 SULLIVAN ST; small business) : $40,287 in 3 contractsin 2005
$33,015 with Navy for Floor Polishers and Vacuum Cleaning Equipment. Signed on 2005-11-15. Completion date: 2006-03-31.
$3,636, same as above.Signed on 2005-09-07. Completion date: 2005-09-30.
$3,636, same as above.Signed on 2005-07-13. Completion date: 2006-01-13.
TY ELECTRIC CORP (464 PORTLAND AVE - SUITE 2; small business) : $28,200 in 2 contractsfrom 2002 to 2004
$24,300 with Navy for Maintenance, Repair or Alteration of Real Property -- Other Administrative Facilities and Service Buildings. Signed on 2004-09-30. Completion date: 2005-01-28.
$3,900, same as above.Signed on 2002-09-30. Completion date: 2002-10-21.
MEDCARE TECHNOLOGIES, INC (850 SAINT PAUL STREET; small business)
$4,860 with Navy for Medical and Surgical Instruments, Equipment, and Supplies. Taking place in VA. Signed on 2005-05-03. Completion date: 2005-05-05.
Top industries in this zip code by the number of employees in 2005:
Health Care and Social Assistance: Ambulance Services (250-499 employees: 1 establishment, 100-249 employees: 1 establishment, 10-19 employees: 1 establishment)
Other Services (except Public Administration): Industrial Launderers (250-499: 1, 50-99: 1, 20-49: 1)
Health Care and Social Assistance: Other Individual and Family Services (100-249: 1, 20-49: 2, 1-4: 1)
Health Care and Social Assistance: Child and Youth Services (100-249: 1, 20-49: 1)
Wholesale Trade: Motor Vehicle Supplies and New Parts Merchant Wholesalers (100-249: 1, 1-4: 2)
Wholesale Trade: Roofing, Siding, and Insulation Material Merchant Wholesalers (100-249: 1)
Health Care and Social Assistance: Family Planning Centers (100-249: 1)
People in group quarters in 2010:
324 people in college/university student housing
317 people in emergency and transitional shelters (with sleeping facilities) for people experiencing homelessness
67 people in other noninstitutional facilities
31 people in group homes for juveniles (non-correctional)
29 people in correctional residential facilities
18 people in group homes intended for adults
People in group quarters in 2000:
316 people in college dormitories (includes college quarters off campus)
156 people in other noninstitutional group quarters
36 people in religious group quarters
2 people in hospitals/wards and hospices for chronically ill
2 people in hospices or homes for chronically ill
Fatal accident statistics in 2014:
Fatal accident count: 2
Vehicles involved in fatal accidents: 2
Fatal accidents caused by drunken drivers: 0
Fatalities: 3
Persons involved in fatal accidents: 3
Pedestrians involved in fatal accidents: 1
Fatal accident statistics in 2013:
Fatal accident count: 1
Vehicles involved in fatal accidents: 1
Fatal accidents caused by drunken drivers: 1
Fatalities: 1
Persons involved in fatal accidents: 1
Pedestrians involved in fatal accidents: 0
Home Mortgage Disclosure Act Aggregated Statistics For Year 2009 (Based on 6 full and 8 partial tracts)
A) FHA, FSA/RHS & VA Home Purchase Loans
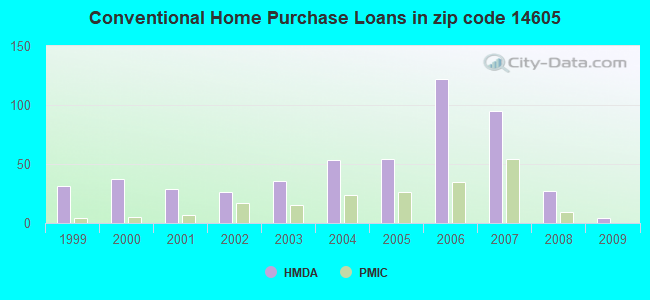
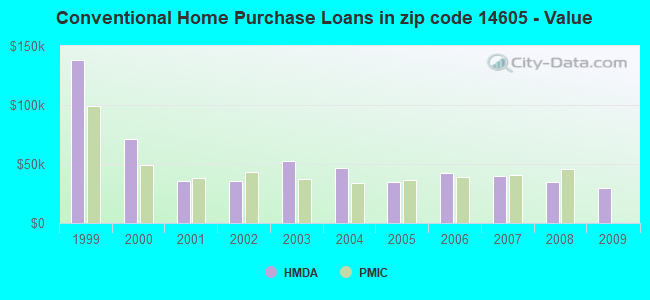
B) Conventional Home Purchase Loans
C) Refinancings
D) Home Improvement Loans
F) Non-occupant Loans on < 5 Family Dwellings (A B C & D)
Number
Average Value
Number
Average Value
Number
Average Value
Number
Average Value
Number
Average Value
LOANS ORIGINATED
8
$41,400
4
$29,748
13
$42,462
18
$10,328
6
$41,422
APPLICATIONS APPROVED, NOT ACCEPTED
0
$0
2
$33,880
4
$58,792
2
$7,565
4
$33,382
APPLICATIONS DENIED
0
$0
4
$27,088
20
$37,406
45
$11,636
8
$18,141
APPLICATIONS WITHDRAWN
2
$106,515
4
$39,148
8
$33,780
0
$0
4
$39,148
FILES CLOSED FOR INCOMPLETENESS
0
$0
2
$23,450
2
$25,215
0
$0
2
$23,450
Aggregated Statistics For Year 2008 (Based on 6 full and 8 partial tracts)
A) FHA, FSA/RHS & VA Home Purchase Loans
B) Conventional Home Purchase Loans
C) Refinancings
D) Home Improvement Loans
E) Loans on Dwellings For 5+ Families
F) Non-occupant Loans on < 5 Family Dwellings (A B C & D)
G) Loans On Manufactured Home Dwelling (A B C & D)
Number
Average Value
Number
Average Value
Number
Average Value
Number
Average Value
Number
Average Value
Number
Average Value
Number
Average Value
LOANS ORIGINATED
8
$61,526
27
$34,966
27
$36,842
21
$13,579
0
$0
39
$35,179
0
$0
APPLICATIONS APPROVED, NOT ACCEPTED
2
$33,285
6
$28,755
6
$34,977
7
$8,609
2
$29,600
4
$25,640
2
$29,895
APPLICATIONS DENIED
4
$78,000
18
$41,016
82
$45,923
54
$14,582
2
$129,545
36
$38,513
0
$0
APPLICATIONS WITHDRAWN
0
$0
5
$33,232
22
$59,924
2
$52,165
0
$0
7
$90,347
0
$0
FILES CLOSED FOR INCOMPLETENESS
0
$0
6
$35,647
0
$0
0
$0
0
$0
4
$29,008
0
$0
Aggregated Statistics For Year 2007 (Based on 6 full and 8 partial tracts)
A) FHA, FSA/RHS & VA Home Purchase Loans
B) Conventional Home Purchase Loans
C) Refinancings
D) Home Improvement Loans
E) Loans on Dwellings For 5+ Families
F) Non-occupant Loans on < 5 Family Dwellings (A B C & D)
Number
Average Value
Number
Average Value
Number
Average Value
Number
Average Value
Number
Average Value
Number
Average Value
LOANS ORIGINATED
4
$114,718
95
$40,041
56
$37,318
31
$15,627
0
$0
94
$37,552
APPLICATIONS APPROVED, NOT ACCEPTED
0
$0
30
$44,741
17
$44,429
8
$14,462
0
$0
22
$30,238
APPLICATIONS DENIED
2
$32,885
74
$41,691
168
$53,091
84
$16,788
4
$324,825
77
$37,780
APPLICATIONS WITHDRAWN
0
$0
17
$46,854
56
$82,054
8
$19,614
0
$0
15
$42,498
FILES CLOSED FOR INCOMPLETENESS
0
$0
5
$128,154
8
$74,936
0
$0
0
$0
4
$89,000
Aggregated Statistics For Year 2006 (Based on 6 full and 8 partial tracts)
A) FHA, FSA/RHS & VA Home Purchase Loans
B) Conventional Home Purchase Loans
C) Refinancings
D) Home Improvement Loans
F) Non-occupant Loans on < 5 Family Dwellings (A B C & D)
G) Loans On Manufactured Home Dwelling (A B C & D)
Number
Average Value
Number
Average Value
Number
Average Value
Number
Average Value
Number
Average Value
Number
Average Value
LOANS ORIGINATED
14
$53,353
122
$42,790
84
$37,432
28
$14,459
107
$36,053
2
$21,925
APPLICATIONS APPROVED, NOT ACCEPTED
0
$0
31
$43,037
15
$44,998
9
$22,598
25
$41,422
2
$46,835
APPLICATIONS DENIED
4
$30,892
102
$33,702
218
$52,149
158
$18,772
123
$32,718
0
$0
APPLICATIONS WITHDRAWN
2
$33,035
18
$66,098
51
$59,895
5
$39,548
18
$51,999
0
$0
FILES CLOSED FOR INCOMPLETENESS
2
$33,035
0
$0
8
$77,229
0
$0
2
$76,730
0
$0
Aggregated Statistics For Year 2005 (Based on 7 full and 8 partial tracts)
A) FHA, FSA/RHS & VA Home Purchase Loans
B) Conventional Home Purchase Loans
C) Refinancings
D) Home Improvement Loans
E) Loans on Dwellings For 5+ Families
F) Non-occupant Loans on < 5 Family Dwellings (A B C & D)
G) Loans On Manufactured Home Dwelling (A B C & D)
Number
Average Value
Number
Average Value
Number
Average Value
Number
Average Value
Number
Average Value
Number
Average Value
Number
Average Value
LOANS ORIGINATED
9
$62,042
54
$35,029
61
$40,247
28
$14,118
0
$0
54
$30,176
0
$0
APPLICATIONS APPROVED, NOT ACCEPTED
3
$102,590
16
$76,307
40
$50,078
6
$19,053
0
$0
8
$50,480
0
$0
APPLICATIONS DENIED
2
$34,010
49
$48,582
282
$47,290
111
$16,224
2
$221,695
102
$30,977
2
$47,360
APPLICATIONS WITHDRAWN
2
$43,470
12
$150,633
81
$64,683
6
$87,705
2
$68,760
20
$69,607
0
$0
FILES CLOSED FOR INCOMPLETENESS
0
$0
6
$52,185
24
$60,029
2
$24,030
0
$0
7
$51,234
0
$0
Aggregated Statistics For Year 2004 (Based on 7 full and 8 partial tracts)
A) FHA, FSA/RHS & VA Home Purchase Loans
B) Conventional Home Purchase Loans
C) Refinancings
D) Home Improvement Loans
F) Non-occupant Loans on < 5 Family Dwellings (A B C & D)
G) Loans On Manufactured Home Dwelling (A B C & D)
Number
Average Value
Number
Average Value
Number
Average Value
Number
Average Value
Number
Average Value
Number
Average Value
LOANS ORIGINATED
6
$49,112
53
$46,921
58
$48,821
11
$10,230
28
$64,878
2
$20,000
APPLICATIONS APPROVED, NOT ACCEPTED
2
$91,000
12
$40,372
58
$46,849
2
$15,065
19
$36,218
0
$0
APPLICATIONS DENIED
4
$51,300
22
$37,084
316
$47,337
84
$22,841
42
$38,668
2
$69,515
APPLICATIONS WITHDRAWN
0
$0
7
$66,740
82
$40,308
9
$21,367
7
$41,373
0
$0
FILES CLOSED FOR INCOMPLETENESS
0
$0
4
$28,720
14
$136,883
2
$19,930
4
$63,422
0
$0
Aggregated Statistics For Year 2003 (Based on 7 full and 8 partial tracts)
A) FHA, FSA/RHS & VA Home Purchase Loans
B) Conventional Home Purchase Loans
C) Refinancings
D) Home Improvement Loans
E) Loans on Dwellings For 5+ Families
F) Non-occupant Loans on < 5 Family Dwellings (A B C & D)
Number
Average Value
Number
Average Value
Number
Average Value
Number
Average Value
Number
Average Value
Number
Average Value
LOANS ORIGINATED
7
$77,101
36
$52,549
62
$46,071
9
$6,621
0
$0
25
$41,390
APPLICATIONS APPROVED, NOT ACCEPTED
0
$0
7
$42,826
41
$45,288
0
$0
0
$0
9
$30,642
APPLICATIONS DENIED
0
$0
22
$47,024
243
$46,676
54
$14,898
0
$0
43
$31,630
APPLICATIONS WITHDRAWN
0
$0
2
$35,875
76
$52,849
5
$29,646
2
$28,000
9
$36,122
FILES CLOSED FOR INCOMPLETENESS
2
$63,775
0
$0
7
$50,854
0
$0
0
$0
0
$0
Aggregated Statistics For Year 2002 (Based on 7 full and 8 partial tracts)
A) FHA, FSA/RHS & VA Home Purchase Loans
B) Conventional Home Purchase Loans
C) Refinancings
D) Home Improvement Loans
F) Non-occupant Loans on < 5 Family Dwellings (A B C & D)
Number
Average Value
Number
Average Value
Number
Average Value
Number
Average Value
Number
Average Value
LOANS ORIGINATED
12
$45,763
26
$35,849
61
$42,452
17
$11,118
35
$31,095
APPLICATIONS APPROVED, NOT ACCEPTED
0
$0
3
$82,333
39
$38,761
9
$14,671
4
$41,860
APPLICATIONS DENIED
6
$45,985
19
$37,015
229
$41,642
27
$12,038
47
$33,192
APPLICATIONS WITHDRAWN
2
$57,325
2
$146,305
86
$48,189
14
$22,966
2
$18,915
FILES CLOSED FOR INCOMPLETENESS
0
$0
0
$0
19
$43,306
0
$0
2
$23,680
Aggregated Statistics For Year 2001 (Based on 7 full and 8 partial tracts)
A) FHA, FSA/RHS & VA Home Purchase Loans
B) Conventional Home Purchase Loans
C) Refinancings
D) Home Improvement Loans
E) Loans on Dwellings For 5+ Families
F) Non-occupant Loans on < 5 Family Dwellings (A B C & D)
Number
Average Value
Number
Average Value
Number
Average Value
Number
Average Value
Number
Average Value
Number
Average Value
LOANS ORIGINATED
13
$53,285
29
$35,518
59
$41,741
26
$12,246
6
$84,563
20
$28,423
APPLICATIONS APPROVED, NOT ACCEPTED
2
$52,165
2
$37,725
26
$44,274
13
$16,544
0
$0
8
$37,755
APPLICATIONS DENIED
0
$0
16
$36,969
267
$44,435
103
$11,944
0
$0
22
$33,031
APPLICATIONS WITHDRAWN
2
$19,930
0
$0
133
$49,870
13
$10,337
0
$0
6
$31,823
FILES CLOSED FOR INCOMPLETENESS
0
$0
0
$0
16
$40,277
2
$30,260
0
$0
2
$40,140
Aggregated Statistics For Year 2000 (Based on 7 full and 8 partial tracts)
A) FHA, FSA/RHS & VA Home Purchase Loans
B) Conventional Home Purchase Loans
C) Refinancings
D) Home Improvement Loans
F) Non-occupant Loans on < 5 Family Dwellings (A B C & D)
Number
Average Value
Number
Average Value
Number
Average Value
Number
Average Value
Number
Average Value
LOANS ORIGINATED
16
$37,573
37
$70,913
98
$38,009
47
$5,574
45
$37,669
APPLICATIONS APPROVED, NOT ACCEPTED
0
$0
12
$36,133
42
$35,742
16
$18,991
14
$38,042
APPLICATIONS DENIED
7
$8,506,856
41
$36,335
207
$36,004
57
$15,504
34
$28,872
APPLICATIONS WITHDRAWN
6
$40,125
19
$35,885
92
$45,758
6
$37,325
18
$47,979
FILES CLOSED FOR INCOMPLETENESS
0
$0
2
$47,145
31
$50,416
2
$15,000
7
$44,031
Aggregated Statistics For Year 1999 (Based on 6 full and 5 partial tracts)
A) FHA, FSA/RHS & VA Home Purchase Loans
B) Conventional Home Purchase Loans
C) Refinancings
D) Home Improvement Loans
F) Non-occupant Loans on < 5 Family Dwellings (A B C & D)
2006 - 2018 National Fire Incident Reporting System (NFIRS) incidents
Based on the data from the years 2006 - 2018 the average number of fires per year is 115. The highest number of fires - 139 took place in 2009, and the least - 94 in 2017. The data has a declining trend.
When looking into fire subcategories, the most incidents belonged to: Structure Fires (53.0%), and Outside Fires (30.7%).
Fire incident types reported to NFIRS in Zip Code 14605


 Nearest zip codes: 14604, 14614, 14621, 14607, 14608, 14613.


 Based on the data from the years 2006 - 2018 the average number of fires per year is 115. The highest number of fires - 139 took place in 2009, and the least - 94 in 2017. The data has a declining trend.
 When looking into fire subcategories, the most incidents belonged to: Structure Fires (53.0%), and Outside Fires (30.7%).