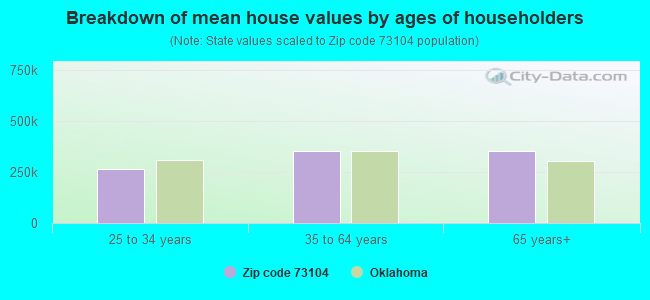
Estimated median house/condo value in 2022: $367,097
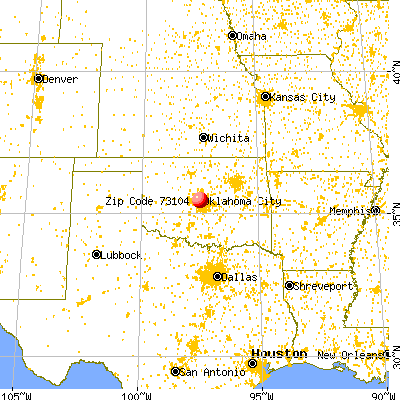
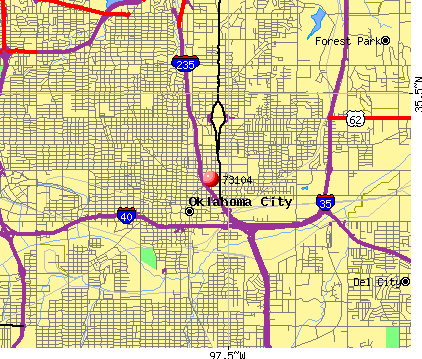
73104:
$367,097
Oklahoma:
$191,700
According to our research of Oklahoma and other state lists, there was 1 registered sex offender living in 73104 zip code as of June 08, 2024. The ratio of all residents to sex offenders in zip code 73104 is 2,266 to 1. The ratio of registered sex offenders to all residents in this zip code is much lower than the state average.
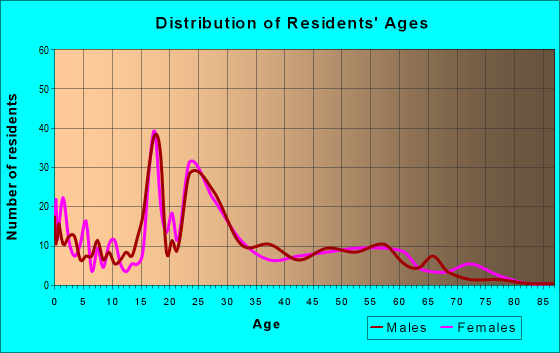
Median resident age:
This zip code:
29.4 years
Oklahoma median age:
37.1 years
Average household size:
This zip code:
1.6 people
Oklahoma:
2.5 people
Averages for the 2020 tax year for zip code 73104, filed in 2021:
Average Adjusted Gross Income (AGI) in 2020: $91,435 (Individual Income Tax Returns)
Here:
$91,435
State:
$63,060
Salary/wage: $71,024 (reported on 93.0% of returns)
Here:
$71,024
State:
$52,427
(% of AGI for various income ranges: 1251.4% for AGIs below $25k, 3883.5% for AGIs $25k-50k, 7039.2% for AGIs $50k-75k, 12083.0% for AGIs $75k-100k, 18425.8% for AGIs $100k-200k, 90172.5% for AGIs over 200k)
Taxable interest for individuals: $944 (reported on 25.9% of returns)
This zip code:
$944
Oklahoma:
$1,603
(% of AGI for various income ranges: 2.8% for AGIs below $25k, 1.9% for AGIs $25k-50k, 4.0% for AGIs $50k-75k, 30.0% for AGIs $75k-100k, 30.0% for AGIs $100k-200k, 737.5% for AGIs over 200k)
Ordinary dividends: $3,559 (reported on 23.4% of returns)
Here:
$3,559
State:
$7,001
(% of AGI for various income ranges: 6.4% for AGIs below $25k, 6.1% for AGIs $25k-50k, 21.2% for AGIs $50k-75k, 115.0% for AGIs $75k-100k, 107.5% for AGIs $100k-200k, 2445.0% for AGIs over 200k)
Net capital gain/loss in AGI: +$16,075 (reported on 22.8% of returns)
Here:
+$16,075
State:
+$19,855
(% of AGI for various income ranges: 18.4% for AGIs $25k-50k, 35.2% for AGIs $50k-75k, 315.0% for AGIs $75k-100k, 332.5% for AGIs $100k-200k, 12330.0% for AGIs over 200k)
Profit/loss from business: +$13,944 (reported on 15.8% of returns)
Here:
+$13,944
State:
+$9,904
(% of AGI for various income ranges: 128.9% for AGIs below $25k, 139.0% for AGIs $25k-50k, 71.2% for AGIs $50k-75k, 421.0% for AGIs $75k-100k, 544.2% for AGIs $100k-200k, 3347.5% for AGIs over 200k)
Taxable individual retirement arrangement distribution: $18,525 (reported on 2.5% of returns)
73104:
$18,525
Oklahoma:
$20,476
(% of AGI for various income ranges: 617.5% for AGIs $100k-200k)
Total itemized deductions: $44,407 (reported on 8.9% of returns)
Here:
$44,407
State:
$39,736
(% of AGI for various income ranges: 302.0% for AGIs $50k-75k, 552.5% for AGIs $100k-200k, 11997.5% for AGIs over 200k)
Charity contributions: $31,720 (reported on 6.3% of returns)
Here:
$31,720
State:
$17,288
(% of AGI for various income ranges: 16.9% for AGIs below $25k, 152.5% for AGIs $100k-200k, 7320.0% for AGIs over 200k)
Taxes paid: $8,400 (reported on 8.2% of returns)
73104:
$8,400
State:
$7,046
(% of AGI for various income ranges: 69.2% for AGIs $50k-75k, 155.8% for AGIs $100k-200k, 1830.0% for AGIs over 200k)
Earned income credit: $2,015 (reported on 12.7% of returns)
Here:
$2,015
State:
$2,435
(% of AGI for various income ranges: 90.6% for AGIs below $25k, 24.8% for AGIs $25k-50k)
Percentage of individuals using paid preparers for their 2020 taxes: 93.7%
Here:
94%
State:
94%
(% for various income ranges: 95.3% for AGIs below $25k, 91.9% for AGIs $25k-50k, 96.7% for AGIs $50k-75k, 93.8% for AGIs $75k-100k, 89.5% for AGIs $100k-200k, 92.3% for AGIs over 200k)
Averages for the 2012 tax year for zip code 73104, filed in 2013:
Average Adjusted Gross Income (AGI) in 2012: $64,362 (Individual Income Tax Returns)
Here:
$64,362
State:
$58,581
Salary/wage: $50,795 (reported on 92.9% of returns)
Here:
$50,795
State:
$45,973
(% of AGI for various income ranges: 86.0% for AGIs below $25k, 97.5% for AGIs $25k-50k, 91.7% for AGIs $50k-75k, 84.5% for AGIs $75k-100k, 82.2% for AGIs $100k-200k, 43.8% for AGIs over 200k)
Taxable interest for individuals: $446 (reported on 24.5% of returns)
This zip code:
$446
Oklahoma:
$1,625
(% of AGI for various income ranges: 0.2% for AGIs $25k-50k, 0.1% for AGIs $75k-100k, 0.2% for AGIs $100k-200k, 0.2% for AGIs over 200k)
Ordinary dividends: $3,888 (reported on 17.3% of returns)
Here:
$3,888
State:
$6,374
(% of AGI for various income ranges: 0.6% for AGIs $50k-75k, 0.8% for AGIs $100k-200k, 2.3% for AGIs over 200k)
Net capital gain/loss in AGI: +$45,820 (reported on 15.3% of returns)
Here:
+$45,820
State:
+$24,023
(% of AGI for various income ranges: 0.9% for AGIs $100k-200k, 31.9% for AGIs over 200k)
Profit/loss from business: +$11,650 (reported on 12.2% of returns)
Here:
+$11,650
State:
+$11,913
(% of AGI for various income ranges: 8.3% for AGIs below $25k, 10.5% for AGIs $50k-75k, 0.9% for AGIs $100k-200k)
Taxable individual retirement arrangement distribution: $9,950 (reported on 2.0% of returns)
73104:
$9,950
Oklahoma:
$15,242
Total itemized deductions: $27,791 (17% of AGI, reported on 22.4% of returns)
Here:
$27,791
State:
$24,882
Here:
16.9% of AGI
State:
18.8% of AGI
(% of AGI for various income ranges: 5.5% for AGIs $25k-50k, 10.0% for AGIs $50k-75k, 7.0% for AGIs $75k-100k, 13.0% for AGIs $100k-200k, 12.6% for AGIs over 200k)
Charity contributions: $5,719 (reported on 16.3% of returns)
Here:
$5,719
State:
$6,591
(% of AGI for various income ranges: 1.0% for AGIs below $25k, 1.3% for AGIs $50k-75k, 0.9% for AGIs $75k-100k, 2.1% for AGIs $100k-200k, 2.0% for AGIs over 200k)
Taxes paid: $9,248 (reported on 21.4% of returns)
73104:
$9,248
State:
$7,196
(% of AGI for various income ranges: 1.5% for AGIs $25k-50k, 2.1% for AGIs $50k-75k, 2.4% for AGIs $75k-100k, 4.8% for AGIs $100k-200k, 4.1% for AGIs over 200k)
Earned income credit: $2,117 (reported on 18.4% of returns)
Here:
$2,117
State:
$2,354
(% of AGI for various income ranges: 6.4% for AGIs below $25k, 0.7% for AGIs $25k-50k)
Percentage of individuals using paid preparers for their 2012 taxes: 39.8%
Here:
40%
State:
56%
(% for various income ranges: 36.8% for AGIs below $25k, 32.0% for AGIs $25k-50k, 35.7% for AGIs $50k-75k, 50.0% for AGIs $75k-100k, 55.6% for AGIs $100k-200k, 75.0% for AGIs over 200k)
Averages for the 2004 tax year for zip code 73104, filed in 2005:
Average Adjusted Gross Income (AGI) in 2004: $32,091 (Individual Income Tax Returns)
Here:
$32,091
State:
$41,245
Salary/wage: $29,963 (reported on 90.3% of returns)
Here:
$29,963
State:
$35,318
(% of AGI for various income ranges: 101.2% for AGIs below $10k, 83.8% for AGIs $10k-25k, 93.0% for AGIs $25k-50k, 93.1% for AGIs $50k-75k, 88.2% for AGIs $75k-100k, 65.5% for AGIs over 100k)
Taxable interest for individuals: $367 (reported on 24.0% of returns)
This zip code:
$367
Oklahoma:
$1,745
(% of AGI for various income ranges: 0.1% for AGIs below $10k, 0.3% for AGIs $10k-25k, 0.3% for AGIs $25k-50k, 0.2% for AGIs $50k-75k, 0.3% for AGIs $75k-100k, 0.3% for AGIs over 100k)
Taxable dividends: $625 (reported on 11.5% of returns)
Here:
$625
State:
$2,920
(% of AGI for various income ranges: 0.3% for AGIs below $10k, 0.3% for AGIs $25k-50k, 0.4% for AGIs $50k-75k, 0.2% for AGIs over 100k)
Net capital gain/loss: +$271 (reported on 7.7% of returns)
Here:
+$271
State:
+$10,653
Profit/loss from business: +$6,000 (reported on 9.4% of returns)
Here:
+$6,000
State:
+$8,532
(% of AGI for various income ranges: 7.2% for AGIs below $10k, 3.0% for AGIs $10k-25k, 1.1% for AGIs $25k-50k, 3.7% for AGIs $50k-75k)
Total itemized deductions: $14,373 (19% of AGI, reported on 18.8% of returns)
Here:
$14,373
State:
$17,093
Here:
18.5% of AGI
State:
20.5% of AGI
(% of AGI for various income ranges: 5.2% for AGIs $10k-25k, 5.6% for AGIs $25k-50k, 10.4% for AGIs $50k-75k, 13.1% for AGIs $75k-100k, 11.1% for AGIs over 100k)
Charity contributions deductions: $3,524 (4% of AGI, reported on 13.4% of returns)
Here:
$3,524
State:
$4,240
Here:
4.0% of AGI
State:
4.8% of AGI
(% of AGI for various income ranges: 2.6% for AGIs below $10k, 0.9% for AGIs $25k-50k, 3.5% for AGIs $50k-75k, 1.6% for AGIs $75k-100k, 1.2% for AGIs over 100k)
Total tax: $6,382 (reported on 60.2% of returns)
73104:
$6,382
State:
$6,542
(% of AGI for various income ranges: 1.4% for AGIs below $10k, 3.6% for AGIs $10k-25k, 8.3% for AGIs $25k-50k, 11.9% for AGIs $50k-75k, 11.7% for AGIs $75k-100k, 22.3% for AGIs over 100k)
Earned income credit: $1,881 (reported on 32.1% of returns)
Here:
$1,881
State:
$1,830
Percentage of individuals using paid preparers for their 2004 taxes: 55.3%
Here:
55%
State:
63%
(% for various income ranges: 54.5% for AGIs below $10k, 62.8% for AGIs $10k-25k, 49.0% for AGIs $25k-50k, 48.5% for AGIs $50k-75k, 52.2% for AGIs $75k-100k, 61.5% for AGIs over 100k)
Likely homosexual households (counted as self-reported same-sex unmarried-partner households)
Lesbian couples: 0.0% of all households
Gay men: 0.2% of all households
Household received Food Stamps/SNAP in the past 12 months: 209 Household did not receive Food Stamps/SNAP in the past 12 months: 1,914
Women who had a birth in the past 12 months: 43 (6 now married, 35 unmarried) Women who did not have a birth in the past 12 months: 1,083 (338 now married, 744 unmarried)
Housing units in zip code 73104 with a mortgage: 228 (3 second mortgage) Median monthly owner costs for units with a mortgage: $2,033 Median monthly owner costs for units without a mortgage: $784
Residents with income below the poverty level in 2022:
This zip code:
21.3%
Whole state:
15.7%
Residents with income below 50% of the poverty level in 2022:
This zip code:
5.2%
Whole state:
8.3%
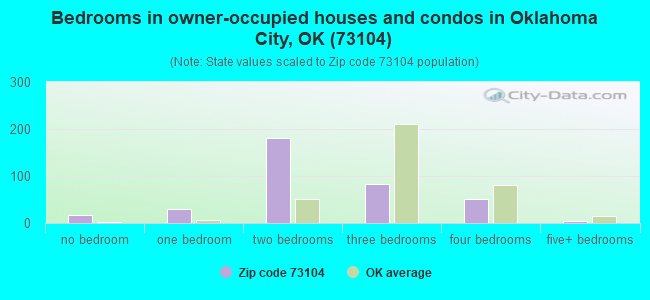
Median number of rooms in houses and condos:
Here:
4.7
State:
6.1
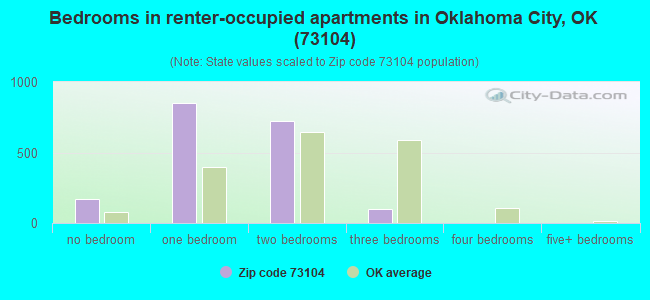
Median number of rooms in apartments:
Here:
3.0
State:
4.5
Notable locations in this zip code not listed on our city pages
Churches in zip code 73104 include: Power House Church of God (A), Joy Mennonite Church (B), Corpus Christi Church (C), Church of God in Christ (D), Canon Baptist Church (E), Calvary Baptist Church (F). Display/hide their locations on the map
Tourist attractions (not listed on the city page) : Harn Homestead & 1889'er Museum (313 Ne 16th St), Dungeon (Amusement & Theme Parks; 101 East California Avenue), Water Taxi of Oklahoma (115 East California Avenue), Mickey Mantle's Restaurant (Tours & Charters; 7 South Mickey Mantle Drive).
In group quarters: 178 (-1 institutionalized population)
Size of family households: 526 2-persons, 153 3-persons, 52 4-persons, 17 5-persons
Size of nonfamily households: 1,101 1-person, 266 2-persons, 32 3-persons
131 married couples with children.
229 single-parent households (53 men, 176 women).
85.6% of residents of 73104 zip code speak English at home.
5.9% of residents speak Spanish at home (84% very well, 5% well, 11% not well).
4.4% of residents speak other Indo-European language at home (68% very well, 10% well, 23% not well).
3.2% of residents speak Asian or Pacific Island language at home (58% very well, 42% well).
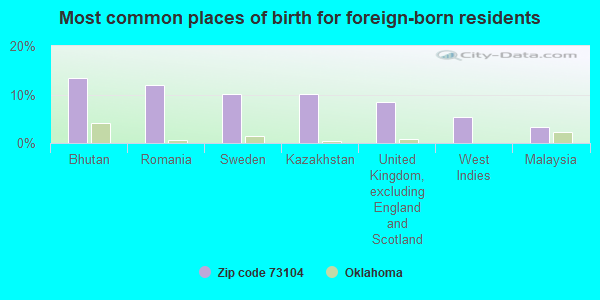
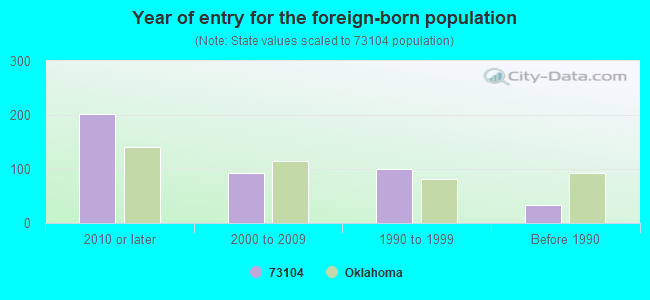
Foreign born population: 334 (9.3%) (42.1% of them are naturalized citizens)
Facilities with environmental interests located in this zip code:
ANALYTICAL RESEARCH LABORATORIES (840 RESEARCH PARKWAY in OKLAHOMA CITY, OK)
(Resource Conservation and Recovery Act (tracking hazardous waste)) HAZARDOUS WASTE BIENNIAL REPORTER (Resource Conservation and Recovery Act (tracking hazardous waste)) Large Quantity Generators, more that 1000 kg of hazardous waste/month (Resource Conservation and Recovery Act (tracking hazardous waste)) - notification Small Quantity Generators, between 100 kg and 1000 kg of hazardous waste/month (Resource Conservation and Recovery Act (tracking hazardous waste)) Business NAICS classification: MEDICAL LABORATORIES. Organizations: UROCOR (CONTACT/OPERATOR)
, LAPCORP (CONTACT/OPERATOR)
, THOMAS C. KUPIEC (CONTACT/OPERATOR)
, UROCOR INC (CONTACT/OWNER)
, PRESBYTERIAN HEALTH FOUNDATION (CONTACT/OWNER)
, THOMAS C. KUPIEC (CONTACT/OWNER)
Alternative names: DIANON SYSTEMS INC, UROCOR INC, UROCOR DIAGNOSTICS
BLACK AND PURYEAR PAINT MANUFACTURING COMPANY INCORPORATED (13 NORTHEAST 13TH STREET in OKLAHOMA CITY, OK)
STATE MASTER (Oklahoma environmental compliance activities data) (Resource Conservation and Recovery Act (tracking hazardous waste)) Organizations: UNKNOWN (CONTACT/OWNER)
FARM FRESH DAIRY NOVELTY PLANT (101 E. MAIN ST. in OKLAHOMA CITY, OK)
(Resource Conservation and Recovery Act (tracking hazardous waste)) TRI REPORTER (Tracking of toxic chemicals releasing facilities) Business SIC classification: ICE CREAM AND FROZEN DESSERTS Organizations: FARM FRESH NOVELTY PLANT (CONTACT/OWNER)
Alternative names: FARM FRESH NOVELTY PLANT
DRIVE LINE TECHNOLOGIES INC (600 E SHERIDAN in OKLAHOMA CITY, OK)
Conditionally Exempt Small Quantity Generators, less than 100 kg/month of hazardous waste (Resource Conservation and Recovery Act (tracking hazardous waste)) - notification USED OIL PROGRAM (Resource Conservation and Recovery Act (tracking hazardous waste)) Business NAICS classification: BALL AND ROLLER BEARING MANUFACTURING. Organizations: MC AUTOMOTIVE ACQUISITIONS CORP (CONTACT/OWNER)
Alternative names: ROTEX CORPORATION
BROADWAY MACHINE (29 NE 8TH ST in OKLAHOMA CITY, OK)
Conditionally Exempt Small Quantity Generators, less than 100 kg/month of hazardous waste (Resource Conservation and Recovery Act (tracking hazardous waste)) - notification Organizations: DIESEL CASTING SVC (CONTACT/OWNER)
GENERAL PUMP MFG INC (507 E CALIFORNIA in OKLAHOMA CITY, OK)
Small Quantity Generators, between 100 kg and 1000 kg of hazardous waste/month (Resource Conservation and Recovery Act (tracking hazardous waste)) - notification Organizations: GENERAL PUMP MANUF (CONTACT/OWNER)
Housing units lacking complete plumbing facilities: 0.7% Housing units lacking complete kitchen facilities: 0.9%
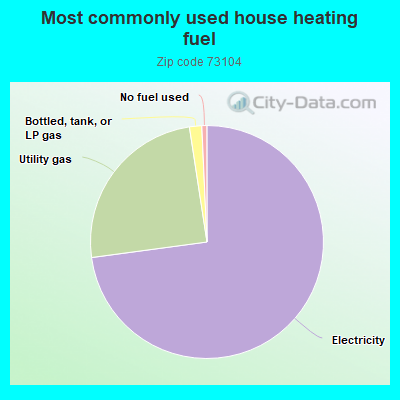
72.8%Electricity
24.7%Utility gas
1.7%Bottled, tank, or LP gas
0.7%No fuel used
Population in 1990: 2,534.
Place of birth for U.S.-born residents:
This state: 1,606
Northeast: 159
Midwest: 432
South: 756
West: 235
49% of the 73104 zip code residents lived in the same house 5 years ago. Out of people who lived in different houses, 77% lived in this county. Out of people who lived in different counties, 50% lived in Oklahoma.
65% of the 73104 zip code residents lived in the same house 1 year ago. Out of people who lived in different houses, 36% moved from this county. Out of people who lived in different houses, 13% moved from different county within same state. Out of people who lived in different houses, 49% moved from different state. Out of people who lived in different houses, 0% moved from abroad.
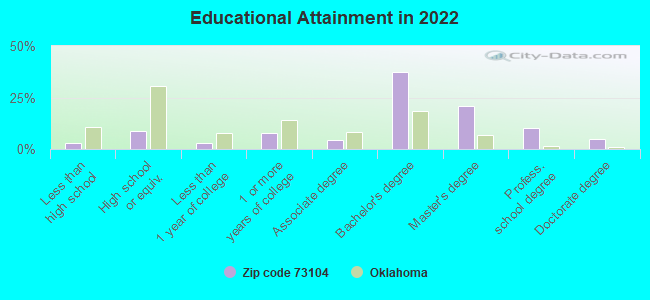
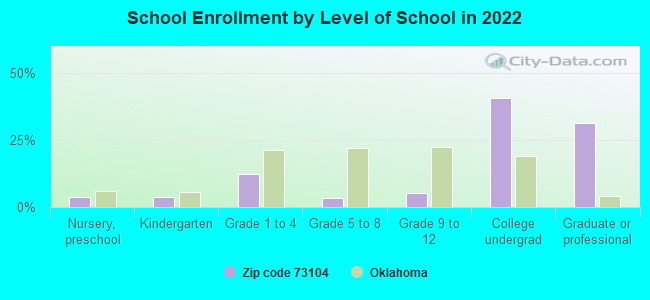
Private vs. public school enrollment:
Students in private schools in grades 1 to 8 (elementary and middle school): 9
Here:
7.6%
Oklahoma:
11.7%
Students in private schools in grades 9 to 12 (high school): 5
Here:
12.7%
Oklahoma:
11.7%
Students in private undergraduate colleges: 208
Here:
60.0%
Oklahoma:
19.3%
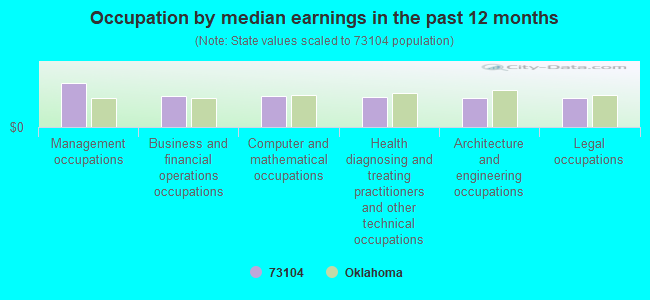
Occupation by median earnings in the past 12 months ($)
114,359Management occupations
79,639Business and financial operations occupations
79,627Computer and mathematical occupations
78,711Health diagnosing and treating practitioners and other technical occupations
75,326Architecture and engineering occupations
74,757Legal occupations
Companies with federal contracts located in this zip code (OKLAHOMA CITY, OK):
SGS LLC (25 S OKLAHOMA AVE STE 310; small business) : $54,971,892 in 24 contractsfrom 2000 to 2006
Contracts for Maintenance, Repair or Alteration of Real Property -- Miscellaneous Buildings, Construction of Structures and Facilities -- Highways, Roads, Streets, Bridges, and Railways (includes resurfacing), Construction of Structures and Facilities -- Other Administrative Facilities and Service Buildings, Construction of Structures and Facilities -- Maintenance Buildings, and moreby Army, Navy, Indian Affairs (Assistant Secretary), U.S. Army Corps of Engineers - civil program financing only, and others Signed by year:2000: $18,079,143; 2001: $240,833; 2002: $123,851; 2003: $175,066; 2004: $37,439; 2005: $3,604,360; 2006: $32,711,200.
Biggest contracts:
$25,144,683 with Army for Maintenance, Repair or Alteration of Real Property -- Miscellaneous Buildings. Taking place in LA. Signed on 2006-06-29. Completion date: 2007-12-31.
$9,093,093 with Army for Construction of Structures and Facilities -- Highways, Roads, Streets, Bridges, and Railways (includes resurfacing). Taking place in LA. Signed on 2000-11-13. Completion date: 2000-09-30.
$9,025,606, same as above.Signed on 2000-12-28. Completion date: 2000-09-30.
$7,549,000 with Army for Construction of Structures and Facilities -- Other Administrative Facilities and Service Buildings. Taking place in IL. Signed on 2006-06-29. Completion date: 2007-11-30.
ADVANCIA CORPORATION (655 RESEARCH PKWY; small business) : $8,535,474 in 42 contractsfrom 1999 to 2006
Contracts for ADP Backup and Security Services, Program Management/Support Services, Operations Research and Quantitative Analysis Services, Other Management Support Services, and moreby Army, Immigration and Naturalization Service Signed by year:2000: $683,401; 2001: $737,756; 2002: -$8,915; 2003: $0; 2004: $3,578,639; 2005: $3,436,217; 2006: $39,376.
Biggest contracts:
$2,200,450 with Army for ADP Backup and Security Services. Taking place in AZ. Signed on 2004-08-26. Completion date: 2005-09-30.
$1,164,757 with Army for Program Management/Support Services. Taking place in AZ. Signed on 2005-10-20. Completion date: 2006-09-30.
$626,874 with Army for Operations Research and Quantitative Analysis Services. Signed on 2005-04-22. Completion date: 2006-10-25.
$590,564 with Army for Operations Research and Quantitative Analysis Services. Taking place in MO. Signed on 2004-09-30. Completion date: 2005-09-28.
OKLAHOMA BLOOD INSTITUTE (1001 N LINCOLN BLVD) : $2,854,531 in 112 contractsfrom 1999 to 2006
Contracts for AIDS Research -- Applied Research and Exploratory Development (R&D), Blood, Blood Derivatives, Hematology Services, and moreby National Institutes of Health, Public Health Service, Army, Department of Veterans Affairs, and others Signed by year:2000: $532,000; 2001: $159,627; 2002: $969,003; 2003: $304,721; 2004: $363,730; 2005: $458,259; 2006: $28,191.
Biggest contracts:
$454,000 with National Institutes of Health for AIDS Research -- Applied Research and Exploratory Development (R&D). Signed on 2002-04-15. Completion date: 2003-09-15.
$391,000, same as above.Signed on 2002-09-15. Completion date: 2004-06-15.
$386,000, same as above.Signed on 2000-09-15. Completion date: 2003-09-15.
$150,000 with Public Health Service for Blood. Signed on 2005-10-01. Completion date: 2006-09-30.
LONG WAVE INCORPORATED (120 E SHERIDAN; small business) : $905,592 in 10 contractsfrom 2001 to 2006
Contracts for Maintenance, Repair and Rebuilding of Equipment -- Weapons, Engineering and Technical Services, Maintenance, Repair and Rebuilding of Equipment -- Communication, Detection, and Coherent Radiation Equipment by Navy Signed by year:2000: $0; 2001: $96,835; 2002: $192,927; 2003: $0; 2004: $210,336; 2005: $110,000; 2006: $295,494.
Biggest contracts:
$295,494 with Navy for Maintenance, Repair and Rebuilding of Equipment -- Weapons. Signed on 2006-06-22. Completion date: 2006-09-30.
$239,212 with Navy for Engineering and Technical Services. Signed on 2002-06-07. Completion date: 2003-09-30.
$96,835, same as above.Signed on 2001-12-31. Completion date: 2002-12-30.
$80,000 with Navy for Maintenance, Repair and Rebuilding of Equipment -- Communication, Detection, and Coherent Radiation Equipment. Signed on 2005-03-08. Completion date: 2005-09-30.
D N A SOLUTIONS INC (840 RESEARCH PKWY STE 546; small business) : $433,184 in 2 contractsfrom 2003 to 2004
$364,048 with Army for Other Medical -- Basic Research (R&D). Signed on 2004-09-28. Completion date: 2004-06-14.
$69,136, same as above.Signed on 2003-12-12. Completion date: 2004-06-14.
EXECUTIVE TRAINING, INC (327 N E 2ND STREET, SUITE; small business)
$27,750 with Air Force for Other Education and Training Services. Signed on 2002-06-05. Completion date: 2002-06-28.
AMERICAN RED CROSS OKLAHOMA CO (601 NE 6TH ST) : $24,268 in 11 contractsfrom 2004 to 2006
Contracts for Other Education and Training Services, Other Medical Services, Education Services by Indian Affairs (Assistant Secretary), Defense Logistics Agency, Army Signed by year:2000: $0; 2001: $0; 2002: $0; 2003: $0; 2004: $17,563; 2005: $4,850; 2006: $1,855.
Biggest contracts:
$7,658 with Indian Affairs (Assistant Secretary) for Other Education and Training Services. Signed on 2004-07-25. Effective on 2004-08-25. Completion date: 2004-08-27.
$4,850 with Defense Logistics Agency for Other Education and Training Services. Signed on 2005-07-08. Effective on 2005-08-18. Completion date: 2005-08-18.
$3,360 with Army for Other Medical Services. Signed on 2004-08-08. Completion date: 2004-08-08.
$2,040 with Army for Other Education and Training Services. Signed on 2004-04-26. Completion date: 2004-04-26.
9-1-1 ASSOCIATION OF CENTRAL O (21 E MAIN ST , SUITE 100)
$23,789 with Air Force for Telephone and/or Communications Services (includes Telegraph, Telex, and Cablevision Services). Signed on 2004-11-12. Completion date: 2005-10-03.
ONSA (; small business)
$550 with Bureau of Prisoners/Federal Prison System for Tuition, Registration, and Membership Fees. Signed on 2005-07-29. Completion date: 2005-10-14.
H T B, INC (900 N STILES AVE) : -$44,017 in 2 contractsin 2001
$0 with Navy for Architect - Engineer Services (including landscaping, interior layout, and designing). Taking place in MD. Signed on 2001-10-01. Completion date: 1996-01-15.
-$44,017, same as above.Signed on 2001-10-01. Completion date: 1996-01-15.
Top industries in this zip code by the number of employees in 2005:
Health Care and Social Assistance: General Medical and Surgical Hospitals (over 1000 employees: 2 establishments, 500-999 employees: 2 establishments)
Finance and Insurance: Direct Property and Casualty Insurance Carriers (over 1000: 1, 50-99: 1)
Health Care and Social Assistance: Offices of Physicians (except Mental Health Specialists) (100-249: 3, 10-19: 4, 5-9: 3, 1-4: 6)
Professional, Scientific, and Technical Services: Research and Development in the Physical, Engineering, and Life Sciences (250-499: 1, 50-99: 1, 10-19: 3, 1-4: 2)
Health Care and Social Assistance: Blood and Organ Banks (250-499: 1, 5-9: 1)
Real Estate and Rental and Leasing: Lessors of Nonfinancial Intangible Assets (except Copyrighted Works) (250-499: 1)
Accommodation and Food Services: Food Service Contractors (100-249: 1, 50-99: 1, 5-9: 1, 1-4: 2)
Administrative and Support and Waste Management and Remediation Services: Janitorial Services (100-249: 1, 50-99: 1)
Health Care and Social Assistance: All Other Outpatient Care Centers (100-249: 1, 20-49: 1)
People in group quarters in 2010:
134 people in workers' group living quarters and job corps centers
36 people in group homes for juveniles (non-correctional)
People in group quarters in 2000:
24 people in unknown juvenile institutions
13 people in orthopedic wards and institutions for the physically handicapped
12 people in wards in general hospitals for patients who have no usual home elsewhere
7 people in mental (psychiatric) hospitals or wards
Fatal accident statistics in 2013:
Fatal accident count: 2
Vehicles involved in fatal accidents: 4
Fatal accidents caused by drunken drivers: 0
Fatalities: 2
Persons involved in fatal accidents: 6
Pedestrians involved in fatal accidents: 0
Home Mortgage Disclosure Act Aggregated Statistics For Year 2009 (Based on 8 partial tracts)
A) FHA, FSA/RHS & VA Home Purchase Loans
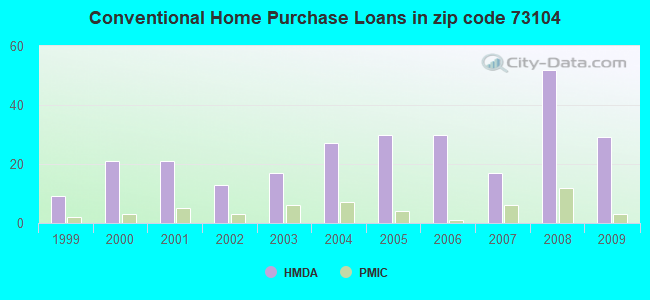
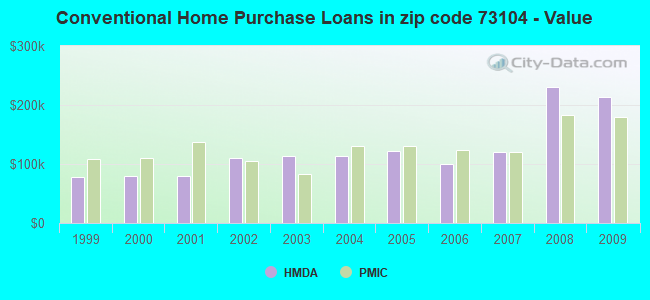
B) Conventional Home Purchase Loans
C) Refinancings
D) Home Improvement Loans
E) Loans on Dwellings For 5+ Families
F) Non-occupant Loans on < 5 Family Dwellings (A B C & D)
Number
Average Value
Number
Average Value
Number
Average Value
Number
Average Value
Number
Average Value
Number
Average Value
LOANS ORIGINATED
8
$184,272
29
$214,165
21
$182,167
4
$50,408
4
$697,512
15
$218,740
APPLICATIONS APPROVED, NOT ACCEPTED
2
$172,495
4
$224,615
5
$141,744
0
$0
0
$0
0
$0
APPLICATIONS DENIED
2
$161,920
6
$170,592
7
$132,111
8
$53,100
0
$0
4
$108,430
APPLICATIONS WITHDRAWN
2
$150,220
1
$155,760
11
$122,957
1
$65,110
0
$0
2
$108,060
FILES CLOSED FOR INCOMPLETENESS
1
$106,480
1
$248,220
0
$0
0
$0
0
$0
0
$0
Aggregated Statistics For Year 2008 (Based on 8 partial tracts)
A) FHA, FSA/RHS & VA Home Purchase Loans
B) Conventional Home Purchase Loans
C) Refinancings
D) Home Improvement Loans
E) Loans on Dwellings For 5+ Families
F) Non-occupant Loans on < 5 Family Dwellings (A B C & D)
G) Loans On Manufactured Home Dwelling (A B C & D)
Number
Average Value
Number
Average Value
Number
Average Value
Number
Average Value
Number
Average Value
Number
Average Value
Number
Average Value
LOANS ORIGINATED
4
$143,552
52
$230,496
21
$135,199
2
$38,995
3
$236,677
17
$169,828
0
$0
APPLICATIONS APPROVED, NOT ACCEPTED
0
$0
8
$164,159
1
$54,260
1
$12,890
0
$0
1
$83,420
0
$0
APPLICATIONS DENIED
1
$81,160
12
$200,213
20
$95,616
7
$31,929
0
$0
4
$126,988
3
$101,323
APPLICATIONS WITHDRAWN
0
$0
4
$264,172
6
$92,712
0
$0
0
$0
1
$42,050
0
$0
FILES CLOSED FOR INCOMPLETENESS
0
$0
0
$0
0
$0
1
$81,380
0
$0
0
$0
0
$0
Aggregated Statistics For Year 2007 (Based on 10 partial tracts)
A) FHA, FSA/RHS & VA Home Purchase Loans
B) Conventional Home Purchase Loans
C) Refinancings
D) Home Improvement Loans
E) Loans on Dwellings For 5+ Families
F) Non-occupant Loans on < 5 Family Dwellings (A B C & D)
G) Loans On Manufactured Home Dwelling (A B C & D)
Number
Average Value
Number
Average Value
Number
Average Value
Number
Average Value
Number
Average Value
Number
Average Value
Number
Average Value
LOANS ORIGINATED
1
$162,090
17
$119,797
22
$89,268
7
$25,074
1
$465,920
10
$55,880
1
$4,070
APPLICATIONS APPROVED, NOT ACCEPTED
0
$0
3
$95,610
3
$110,150
4
$60,248
0
$0
0
$0
0
$0
APPLICATIONS DENIED
0
$0
13
$119,167
32
$114,416
9
$31,246
0
$0
8
$70,252
0
$0
APPLICATIONS WITHDRAWN
1
$84,770
4
$103,105
11
$72,636
1
$115,290
1
$206,850
3
$63,120
0
$0
FILES CLOSED FOR INCOMPLETENESS
0
$0
3
$88,177
2
$84,000
0
$0
0
$0
0
$0
0
$0
Aggregated Statistics For Year 2006 (Based on 10 partial tracts)
A) FHA, FSA/RHS & VA Home Purchase Loans
B) Conventional Home Purchase Loans
C) Refinancings
D) Home Improvement Loans
E) Loans on Dwellings For 5+ Families
F) Non-occupant Loans on < 5 Family Dwellings (A B C & D)
G) Loans On Manufactured Home Dwelling (A B C & D)
Number
Average Value
Number
Average Value
Number
Average Value
Number
Average Value
Number
Average Value
Number
Average Value
Number
Average Value
LOANS ORIGINATED
6
$111,113
30
$100,065
40
$109,454
15
$24,907
6
$5,205,762
20
$101,546
1
$117,040
APPLICATIONS APPROVED, NOT ACCEPTED
1
$116,570
6
$99,973
8
$84,614
1
$192,610
0
$0
2
$124,110
0
$0
APPLICATIONS DENIED
0
$0
18
$117,662
36
$100,475
20
$38,280
0
$0
8
$95,234
0
$0
APPLICATIONS WITHDRAWN
1
$160,160
6
$83,038
24
$89,424
1
$103,290
0
$0
6
$71,078
0
$0
FILES CLOSED FOR INCOMPLETENESS
2
$92,290
3
$110,320
7
$127,793
0
$0
0
$0
2
$97,660
0
$0
Aggregated Statistics For Year 2005 (Based on 10 partial tracts)
A) FHA, FSA/RHS & VA Home Purchase Loans
B) Conventional Home Purchase Loans
C) Refinancings
D) Home Improvement Loans
E) Loans on Dwellings For 5+ Families
F) Non-occupant Loans on < 5 Family Dwellings (A B C & D)
G) Loans On Manufactured Home Dwelling (A B C & D)
Number
Average Value
Number
Average Value
Number
Average Value
Number
Average Value
Number
Average Value
Number
Average Value
Number
Average Value
LOANS ORIGINATED
6
$74,788
30
$121,244
43
$97,302
13
$69,224
2
$606,780
22
$102,441
0
$0
APPLICATIONS APPROVED, NOT ACCEPTED
0
$0
3
$85,227
6
$74,150
3
$51,720
0
$0
4
$91,895
1
$67,820
APPLICATIONS DENIED
2
$78,860
27
$80,439
48
$78,200
19
$26,864
0
$0
18
$60,797
2
$30,360
APPLICATIONS WITHDRAWN
0
$0
29
$99,352
30
$91,105
13
$95,293
0
$0
14
$93,897
0
$0
FILES CLOSED FOR INCOMPLETENESS
0
$0
5
$81,644
8
$64,062
0
$0
0
$0
3
$68,450
0
$0
Aggregated Statistics For Year 2004 (Based on 10 partial tracts)
A) FHA, FSA/RHS & VA Home Purchase Loans
B) Conventional Home Purchase Loans
C) Refinancings
D) Home Improvement Loans
E) Loans on Dwellings For 5+ Families
F) Non-occupant Loans on < 5 Family Dwellings (A B C & D)
G) Loans On Manufactured Home Dwelling (A B C & D)
Number
Average Value
Number
Average Value
Number
Average Value
Number
Average Value
Number
Average Value
Number
Average Value
Number
Average Value
LOANS ORIGINATED
2
$102,410
27
$112,898
43
$84,214
12
$39,678
5
$3,493,532
19
$75,857
0
$0
APPLICATIONS APPROVED, NOT ACCEPTED
0
$0
6
$86,518
8
$73,258
1
$52,900
0
$0
2
$101,735
0
$0
APPLICATIONS DENIED
4
$108,170
14
$85,819
46
$90,049
17
$27,904
0
$0
11
$96,741
1
$28,160
APPLICATIONS WITHDRAWN
2
$100,450
4
$55,465
20
$68,056
1
$64,430
0
$0
6
$73,460
0
$0
FILES CLOSED FOR INCOMPLETENESS
1
$144,610
0
$0
1
$118,680
0
$0
0
$0
0
$0
0
$0
Aggregated Statistics For Year 2003 (Based on 10 partial tracts)
A) FHA, FSA/RHS & VA Home Purchase Loans
B) Conventional Home Purchase Loans
C) Refinancings
D) Home Improvement Loans
E) Loans on Dwellings For 5+ Families
F) Non-occupant Loans on < 5 Family Dwellings (A B C & D)
Number
Average Value
Number
Average Value
Number
Average Value
Number
Average Value
Number
Average Value
Number
Average Value
LOANS ORIGINATED
2
$100,035
17
$113,921
44
$110,917
9
$25,860
1
$302,480
8
$62,954
APPLICATIONS APPROVED, NOT ACCEPTED
1
$47,520
7
$70,726
8
$56,710
1
$6,780
0
$0
4
$78,345
APPLICATIONS DENIED
1
$99,700
5
$81,720
44
$78,077
3
$26,223
0
$0
7
$58,404
APPLICATIONS WITHDRAWN
0
$0
7
$106,009
17
$85,158
1
$3,520
0
$0
4
$36,085
FILES CLOSED FOR INCOMPLETENESS
1
$43,400
1
$206,170
4
$98,052
0
$0
0
$0
1
$104,440
Aggregated Statistics For Year 2002 (Based on 10 partial tracts)
A) FHA, FSA/RHS & VA Home Purchase Loans
B) Conventional Home Purchase Loans
C) Refinancings
D) Home Improvement Loans
E) Loans on Dwellings For 5+ Families
F) Non-occupant Loans on < 5 Family Dwellings (A B C & D)
Number
Average Value
Number
Average Value
Number
Average Value
Number
Average Value
Number
Average Value
Number
Average Value
LOANS ORIGINATED
5
$89,020
13
$110,247
36
$93,201
7
$51,156
1
$94,950
12
$78,808
APPLICATIONS APPROVED, NOT ACCEPTED
1
$75,260
3
$49,020
16
$76,212
0
$0
0
$0
1
$67,880
APPLICATIONS DENIED
1
$66,460
9
$64,383
36
$67,981
6
$10,790
0
$0
9
$69,307
APPLICATIONS WITHDRAWN
0
$0
4
$108,560
13
$91,818
1
$47,470
0
$0
1
$42,240
FILES CLOSED FOR INCOMPLETENESS
0
$0
4
$81,702
8
$80,695
0
$0
0
$0
1
$99,020
Aggregated Statistics For Year 2001 (Based on 10 partial tracts)
A) FHA, FSA/RHS & VA Home Purchase Loans
B) Conventional Home Purchase Loans
C) Refinancings
D) Home Improvement Loans
E) Loans on Dwellings For 5+ Families
F) Non-occupant Loans on < 5 Family Dwellings (A B C & D)
Number
Average Value
Number
Average Value
Number
Average Value
Number
Average Value
Number
Average Value
Number
Average Value
LOANS ORIGINATED
3
$78,670
21
$79,896
39
$92,040
9
$22,018
1
$86,810
11
$110,404
APPLICATIONS APPROVED, NOT ACCEPTED
1
$143,780
2
$50,970
12
$70,138
3
$20,117
0
$0
1
$78,670
APPLICATIONS DENIED
0
$0
10
$65,457
36
$57,272
11
$12,223
0
$0
3
$46,237
APPLICATIONS WITHDRAWN
1
$83,420
4
$82,098
13
$62,795
4
$17,802
0
$0
1
$29,840
FILES CLOSED FOR INCOMPLETENESS
0
$0
0
$0
5
$71,076
0
$0
0
$0
2
$42,385
Aggregated Statistics For Year 2000 (Based on 10 partial tracts)
A) FHA, FSA/RHS & VA Home Purchase Loans
B) Conventional Home Purchase Loans
C) Refinancings
D) Home Improvement Loans
F) Non-occupant Loans on < 5 Family Dwellings (A B C & D)
Number
Average Value
Number
Average Value
Number
Average Value
Number
Average Value
Number
Average Value
LOANS ORIGINATED
8
$88,101
21
$80,458
34
$55,435
11
$13,115
9
$25,701
APPLICATIONS APPROVED, NOT ACCEPTED
0
$0
1
$33,910
6
$49,132
3
$17,973
1
$33,910
APPLICATIONS DENIED
1
$116,570
9
$79,256
42
$48,945
14
$18,304
4
$73,925
APPLICATIONS WITHDRAWN
1
$74,600
9
$77,289
12
$45,684
1
$30,520
2
$81,725
FILES CLOSED FOR INCOMPLETENESS
0
$0
1
$217,020
4
$78,895
0
$0
0
$0
Aggregated Statistics For Year 1999 (Based on 1 full and 4 partial tracts)
A) FHA, FSA/RHS & VA Home Purchase Loans
B) Conventional Home Purchase Loans
C) Refinancings
D) Home Improvement Loans
F) Non-occupant Loans on < 5 Family Dwellings (A B C & D)
2002 - 2018 National Fire Incident Reporting System (NFIRS) incidents
According to the data from the years 2002 - 2018 the average number of fires per year is 29. The highest number of fires - 38 took place in 2002, and the least - 19 in 2013. The data has a dropping trend.
When looking into fire subcategories, the most reports belonged to: Outside Fires (45.5%), and Mobile Property/Vehicle Fires (24.2%).
Fire incident types reported to NFIRS in Zip Code 73104


 Nearest zip codes: 73102, 73103, 73106, 73117, 73105, 73109.


 According to the data from the years 2002 - 2018 the average number of fires per year is 29. The highest number of fires - 38 took place in 2002, and the least - 19 in 2013. The data has a dropping trend.
 When looking into fire subcategories, the most reports belonged to: Outside Fires (45.5%), and Mobile Property/Vehicle Fires (24.2%).