Estimated zip code population in 2022: 7,790 Zip code population in 2010: 7,490 Zip code population in 2000: 7,595
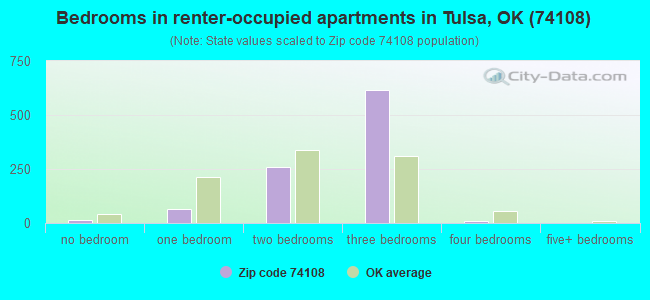
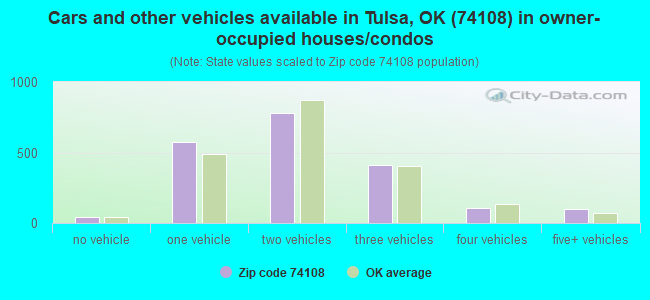
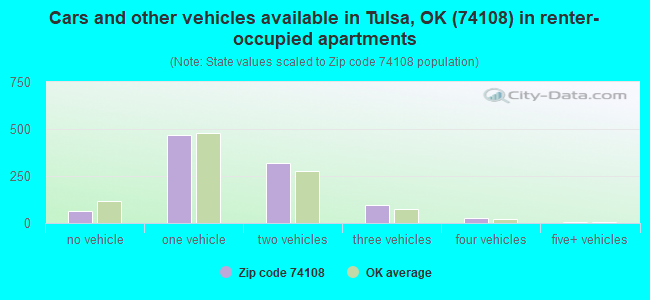
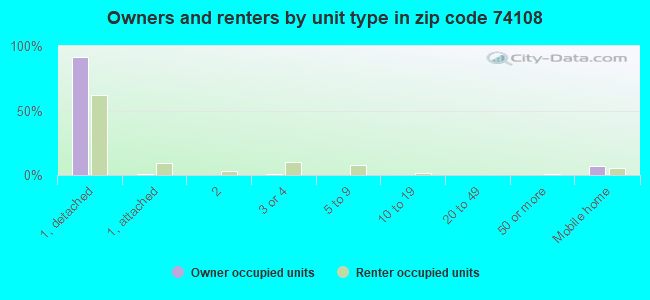
Houses and condos: 3,213 Renter-occupied apartments: 976
% of renters here:
33%
State:
35%
March 2022 cost of living index in zip code 74108: 85.8 (less than average, U.S. average is 100)
Land area: 8.1 sq. mi. Water area: 0.0 sq. mi.
Population density: 956 people per square mile
(low).
OSM Map
General Map
Google Map
MSN Map
OSM Map
General Map
Google Map
MSN Map
OSM Map
General Map
Google Map
MSN Map
OSM Map
General Map
Google Map
MSN Map
Please wait while loading the map...
Real estate property taxes paid for housing units in 2022:
This zip code:
1.0% ($1,303)
Oklahoma:
0.8% ($1,501)
Median real estate property taxes paid for housing units with mortgages in 2022: $1,422 (1.0%) Median real estate property taxes paid for housing units with no mortgage in 2022: $1,154 (0.9%)
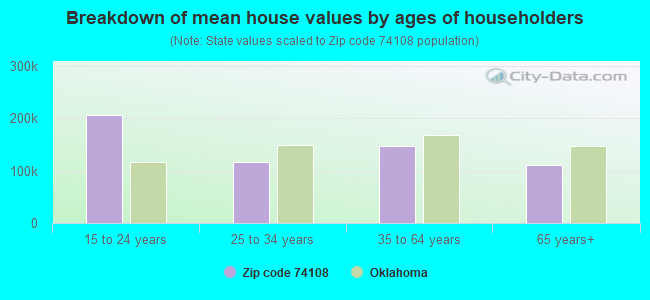
Estimated median house/condo value in 2022: $129,412
74108:
$129,412
Oklahoma:
$191,700
According to our research of Oklahoma and other state lists, there were 14 registered sex offenders living in 74108 zip code as of May 29, 2024. The ratio of all residents to sex offenders in zip code 74108 is 518 to 1. The ratio of registered sex offenders to all residents in this zip code is near the state average.
Median resident age:
This zip code:
34.7 years
Oklahoma median age:
37.1 years
Average household size:
This zip code:
2.6 people
Oklahoma:
2.5 people
Averages for the 2020 tax year for zip code 74108, filed in 2021:
Average Adjusted Gross Income (AGI) in 2020: $41,020 (Individual Income Tax Returns)
Here:
$41,020
State:
$63,060
Salary/wage: $36,637 (reported on 84.2% of returns)
Here:
$36,637
State:
$52,427
(% of AGI for various income ranges: 1101.3% for AGIs below $25k, 3544.0% for AGIs $25k-50k, 6655.8% for AGIs $50k-75k, 9615.4% for AGIs $75k-100k, 12941.0% for AGIs $100k-200k)
Taxable interest for individuals: $1,690 (reported on 17.2% of returns)
This zip code:
$1,690
Oklahoma:
$1,603
(% of AGI for various income ranges: 7.1% for AGIs below $25k, 7.4% for AGIs $25k-50k, 15.5% for AGIs $50k-75k, 23.8% for AGIs $75k-100k, 666.0% for AGIs $100k-200k)
Ordinary dividends: $2,371 (reported on 6.9% of returns)
Here:
$2,371
State:
$7,001
(% of AGI for various income ranges: 6.8% for AGIs below $25k, 11.7% for AGIs $25k-50k, 14.8% for AGIs $50k-75k, 40.0% for AGIs $75k-100k, 230.0% for AGIs $100k-200k)
Net capital gain/loss in AGI: +$4,941 (reported on 5.6% of returns)
Here:
+$4,941
State:
+$19,855
(% of AGI for various income ranges: 0.1% for AGIs below $25k, 9.8% for AGIs $25k-50k, 23.9% for AGIs $50k-75k, 675.0% for AGIs $100k-200k)
Profit/loss from business: +$10,327 (reported on 15.8% of returns)
Here:
+$10,327
State:
+$9,904
(% of AGI for various income ranges: 197.5% for AGIs below $25k, 140.5% for AGIs $25k-50k, 248.8% for AGIs $50k-75k, 274.6% for AGIs $75k-100k, 681.0% for AGIs $100k-200k)
Taxable individual retirement arrangement distribution: $10,983 (reported on 5.9% of returns)
74108:
$10,983
Oklahoma:
$20,476
(% of AGI for various income ranges: 27.3% for AGIs below $25k, 57.4% for AGIs $25k-50k, 165.2% for AGIs $50k-75k, 674.0% for AGIs $100k-200k)
Total itemized deductions: $45,357 (reported on 2.3% of returns)
Here:
$45,357
State:
$39,736
(% of AGI for various income ranges: 241.8% for AGIs $50k-75k, 2377.0% for AGIs $100k-200k)
Charity contributions: $13,167 (reported on 2.0% of returns)
Here:
$13,167
State:
$17,288
(% of AGI for various income ranges: 25.7% for AGIs $25k-50k, 566.0% for AGIs $100k-200k)
Taxes paid: $6,471 (reported on 2.3% of returns)
74108:
$6,471
State:
$7,046
(% of AGI for various income ranges: 41.2% for AGIs $50k-75k, 317.0% for AGIs $100k-200k)
Earned income credit: $2,670 (reported on 25.1% of returns)
Here:
$2,670
State:
$2,435
(% of AGI for various income ranges: 135.6% for AGIs below $25k, 85.2% for AGIs $25k-50k)
Percentage of individuals using paid preparers for their 2020 taxes: 92.7%
Here:
93%
State:
94%
(% for various income ranges: 92.4% for AGIs below $25k, 93.3% for AGIs $25k-50k, 93.0% for AGIs $50k-75k, 94.4% for AGIs $75k-100k, 86.7% for AGIs $100k-200k, 100.0% for AGIs over 200k)
Averages for the 2012 tax year for zip code 74108, filed in 2013:
Average Adjusted Gross Income (AGI) in 2012: $36,530 (Individual Income Tax Returns)
Here:
$36,530
State:
$58,581
Salary/wage: $34,325 (reported on 86.0% of returns)
Here:
$34,325
State:
$45,973
(% of AGI for various income ranges: 77.7% for AGIs below $25k, 87.9% for AGIs $25k-50k, 81.8% for AGIs $50k-75k, 84.5% for AGIs $75k-100k, 65.6% for AGIs $100k-200k)
Taxable interest for individuals: $734 (reported on 21.2% of returns)
This zip code:
$734
Oklahoma:
$1,625
(% of AGI for various income ranges: 0.6% for AGIs below $25k, 0.3% for AGIs $25k-50k, 0.4% for AGIs $50k-75k, 0.4% for AGIs $75k-100k, 0.6% for AGIs $100k-200k)
Ordinary dividends: $2,295 (reported on 7.5% of returns)
Here:
$2,295
State:
$6,374
(% of AGI for various income ranges: 0.5% for AGIs below $25k, 0.3% for AGIs $25k-50k, 0.3% for AGIs $50k-75k, 0.3% for AGIs $75k-100k, 1.2% for AGIs $100k-200k)
Net capital gain/loss in AGI: +$507 (reported on 5.1% of returns)
Here:
+$507
State:
+$24,023
(% of AGI for various income ranges: 0.3% for AGIs $50k-75k, 0.1% for AGIs $100k-200k)
Profit/loss from business: +$8,676 (reported on 14.0% of returns)
Here:
+$8,676
State:
+$11,913
(% of AGI for various income ranges: 10.2% for AGIs below $25k, 2.8% for AGIs $25k-50k, 2.0% for AGIs $50k-75k, 1.4% for AGIs $75k-100k, 1.2% for AGIs $100k-200k)
Taxable individual retirement arrangement distribution: $10,922 (reported on 6.2% of returns)
74108:
$10,922
Oklahoma:
$15,242
(% of AGI for various income ranges: 2.0% for AGIs below $25k, 0.7% for AGIs $25k-50k, 2.3% for AGIs $50k-75k, 2.1% for AGIs $75k-100k, 2.8% for AGIs $100k-200k)
Total itemized deductions: $18,487 (28% of AGI, reported on 16.1% of returns)
Here:
$18,487
State:
$24,882
Here:
27.7% of AGI
State:
18.8% of AGI
(% of AGI for various income ranges: 4.9% for AGIs below $25k, 5.2% for AGIs $25k-50k, 7.6% for AGIs $50k-75k, 9.3% for AGIs $75k-100k, 16.7% for AGIs $100k-200k)
Charity contributions: $5,224 (reported on 11.6% of returns)
Here:
$5,224
State:
$6,591
(% of AGI for various income ranges: 0.6% for AGIs below $25k, 1.1% for AGIs $25k-50k, 1.5% for AGIs $50k-75k, 2.4% for AGIs $75k-100k, 3.5% for AGIs $100k-200k)
Taxes paid: $4,226 (reported on 15.8% of returns)
74108:
$4,226
State:
$7,196
(% of AGI for various income ranges: 0.6% for AGIs below $25k, 1.0% for AGIs $25k-50k, 1.6% for AGIs $50k-75k, 2.5% for AGIs $75k-100k, 4.3% for AGIs $100k-200k)
Earned income credit: $2,595 (reported on 27.4% of returns)
Here:
$2,595
State:
$2,354
(% of AGI for various income ranges: 9.2% for AGIs below $25k, 1.7% for AGIs $25k-50k)
Percentage of individuals using paid preparers for their 2012 taxes: 47.9%
Here:
48%
State:
56%
(% for various income ranges: 46.6% for AGIs below $25k, 43.7% for AGIs $25k-50k, 54.5% for AGIs $50k-75k, 50.0% for AGIs $75k-100k, 66.7% for AGIs $100k-200k)
Averages for the 2004 tax year for zip code 74108, filed in 2005:
Average Adjusted Gross Income (AGI) in 2004: $31,166 (Individual Income Tax Returns)
Here:
$31,166
State:
$41,245
Salary/wage: $29,378 (reported on 88.7% of returns)
Here:
$29,378
State:
$35,318
(% of AGI for various income ranges: 87.6% for AGIs below $10k, 83.6% for AGIs $10k-25k, 87.4% for AGIs $25k-50k, 86.4% for AGIs $50k-75k, 85.1% for AGIs $75k-100k, 61.7% for AGIs over 100k)
Taxable interest for individuals: $1,134 (reported on 31.3% of returns)
This zip code:
$1,134
Oklahoma:
$1,745
(% of AGI for various income ranges: 2.3% for AGIs below $10k, 1.2% for AGIs $10k-25k, 1.0% for AGIs $25k-50k, 1.1% for AGIs $50k-75k, 0.6% for AGIs $75k-100k, 1.9% for AGIs over 100k)
Taxable dividends: $1,292 (reported on 10.4% of returns)
Here:
$1,292
State:
$2,920
(% of AGI for various income ranges: 0.4% for AGIs below $10k, 0.4% for AGIs $10k-25k, 0.2% for AGIs $25k-50k, 0.4% for AGIs $50k-75k, 0.2% for AGIs $75k-100k, 1.6% for AGIs over 100k)
Net capital gain/loss: +$4,054 (reported on 8.6% of returns)
Here:
+$4,054
State:
+$10,653
(% of AGI for various income ranges: -1.0% for AGIs below $10k, -0.0% for AGIs $10k-25k, 0.1% for AGIs $25k-50k, 1.6% for AGIs $50k-75k, 2.3% for AGIs $75k-100k, 4.3% for AGIs over 100k)
Profit/loss from business: +$5,294 (reported on 13.7% of returns)
Here:
+$5,294
State:
+$8,532
(% of AGI for various income ranges: 8.0% for AGIs below $10k, 6.2% for AGIs $10k-25k, 1.9% for AGIs $25k-50k, 1.1% for AGIs $50k-75k, 1.2% for AGIs $75k-100k, 0.1% for AGIs over 100k)
IRA payment deduction: $3,089 (reported on 1.6% of returns)
74108:
$3,089
Oklahoma:
$3,127
Total itemized deductions: $13,769 (25% of AGI, reported on 25.8% of returns)
Here:
$13,769
State:
$17,093
Here:
25.1% of AGI
State:
20.5% of AGI
(% of AGI for various income ranges: 8.9% for AGIs below $10k, 6.1% for AGIs $10k-25k, 9.5% for AGIs $25k-50k, 12.5% for AGIs $50k-75k, 14.7% for AGIs $75k-100k, 20.2% for AGIs over 100k)
Charity contributions deductions: $3,428 (6% of AGI, reported on 20.8% of returns)
Here:
$3,428
State:
$4,240
Here:
6.0% of AGI
State:
4.8% of AGI
(% of AGI for various income ranges: 0.5% for AGIs below $10k, 1.0% for AGIs $10k-25k, 1.4% for AGIs $25k-50k, 2.7% for AGIs $50k-75k, 4.0% for AGIs $75k-100k, 4.8% for AGIs over 100k)
Total tax: $3,428 (reported on 66.8% of returns)
74108:
$3,428
State:
$6,542
(% of AGI for various income ranges: 2.4% for AGIs below $10k, 3.7% for AGIs $10k-25k, 5.6% for AGIs $25k-50k, 8.4% for AGIs $50k-75k, 11.0% for AGIs $75k-100k, 13.8% for AGIs over 100k)
Earned income credit: $1,864 (reported on 27.2% of returns)
Here:
$1,864
State:
$1,830
Percentage of individuals using paid preparers for their 2004 taxes: 58.1%
Here:
58%
State:
63%
(% for various income ranges: 55.6% for AGIs below $10k, 61.7% for AGIs $10k-25k, 57.0% for AGIs $25k-50k, 54.4% for AGIs $50k-75k, 61.7% for AGIs $75k-100k, 63.1% for AGIs over 100k)
Likely homosexual households (counted as self-reported same-sex unmarried-partner households)
Lesbian couples: 0.2% of all households
Gay men: 0.0% of all households
Household received Food Stamps/SNAP in the past 12 months: 587 Household did not receive Food Stamps/SNAP in the past 12 months: 2,418
Women who had a birth in the past 12 months: 141 (72 now married, 67 unmarried) Women who did not have a birth in the past 12 months: 1,601 (777 now married, 824 unmarried)
Housing units in zip code 74108 with a mortgage: 1,035 (25 second mortgage, 7 both second mortgage and home equity loan) Houses without a mortgage: 9
Median monthly owner costs for units with a mortgage: $1,044 Median monthly owner costs for units without a mortgage: $458
Residents with income below the poverty level in 2022:
This zip code:
24.8%
Whole state:
15.7%
Residents with income below 50% of the poverty level in 2022:
This zip code:
12.3%
Whole state:
8.3%
Median number of rooms in houses and condos:
Here:
5.9
State:
6.1
Median number of rooms in apartments:
Here:
4.8
State:
4.5
Notable locations in this zip code not listed on our city pages
Notable locations in zip code 74108: Eastland Plaza (A), Rolling Hills Fire Department (B), Tulsa Fire Department Station 30 (C). Display/hide their locations on the map
Churches in zip code 74108 include: Family Worship Center (A), Vietnamese Community Saint Joseph Church (B), Tulsa Chinese Christian Church (C), Tam-Bao Buddhist Temple (D), Saint Pauls Church of the Nazarene (E), Jubilee Worship Center (F), Restoration Church (G), Eastland Hills Christian Church (H), Eastland Baptist Church (I). Display/hide their locations on the map
Tourist attraction (not listed on the city page) : Action Sports Photography (Arcades & Amusements; 18559 East 3rd Street).
In group quarters: 10 (-1 institutionalized population)
Size of family households: 970 2-persons, 411 3-persons, 324 4-persons, 101 5-persons, 162 6-persons, 87 7-or-more-persons
Size of nonfamily households: 752 1-person, 157 2-persons, 18 3-persons
876 married couples with children.
690 single-parent households (211 men, 479 women).
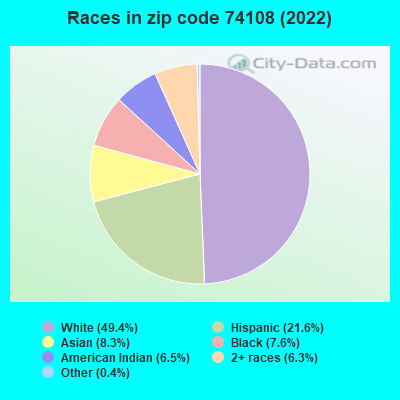
75.1% of residents of 74108 zip code speak English at home.
18.6% of residents speak Spanish at home (57% very well, 15% well, 24% not well, 4% not at all).
0.4% of residents speak other Indo-European language at home (34% very well, 66% not well).
4.6% of residents speak Asian or Pacific Island language at home (40% very well, 39% well, 12% not well, 8% not at all).
1.3% of residents speak other language at home (100% very well).
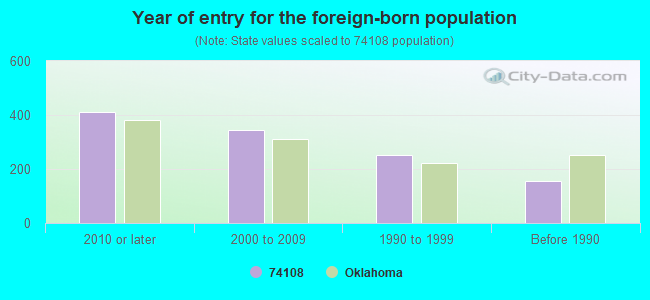
Foreign born population: 1,100 (14.1%) (34.5% of them are naturalized citizens)
BRYAN ADAIR CONST C/BRYAN PORTABLE BATCH (410 S 145TH E AVE in TULSA, OK)
AIR MINOR (AIRS/AFS) Business SIC classification: CONCRETE WORK Alternative names: BRYAN ADAIR CONSTRU BRYAN PORTABLE BATCH
FORD OF TULSA (320 S 164TH EAST PL in TULSA, OK)
Conditionally Exempt Small Quantity Generators, less than 100 kg/month of hazardous waste (Resource Conservation and Recovery Act (tracking hazardous waste)) Organizations: UNITED AUTO GROUP (CONTACT/OPERATOR)
Housing units lacking complete plumbing facilities: 0.7% Housing units lacking complete kitchen facilities: 2.6%
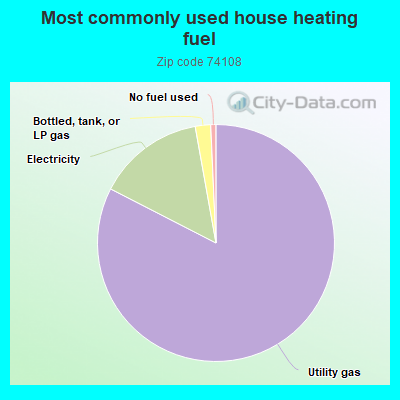
82.3%Utility gas
14.6%Electricity
2.1%Bottled, tank, or LP gas
0.7%No fuel used
Population in 1990: 8,018.
Place of birth for U.S.-born residents:
This state: 4,133
Northeast: 321
Midwest: 592
South: 773
West: 819
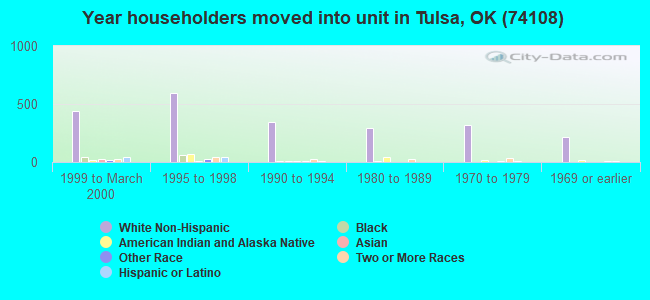
54% of the 74108 zip code residents lived in the same house 5 years ago. Out of people who lived in different houses, 56% lived in this county. Out of people who lived in different counties, 50% lived in Oklahoma.
90% of the 74108 zip code residents lived in the same house 1 year ago. Out of people who lived in different houses, 56% moved from this county. Out of people who lived in different houses, 24% moved from different county within same state. Out of people who lived in different houses, 20% moved from different state.
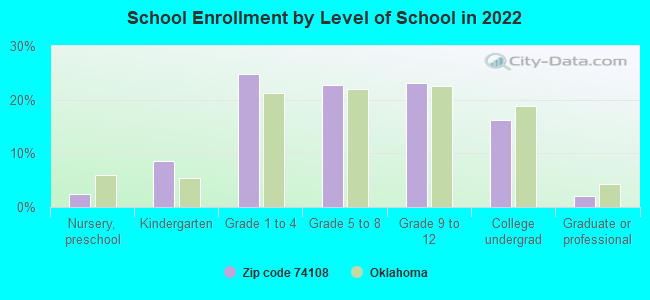
Private vs. public school enrollment:
Students in private schools in grades 1 to 8 (elementary and middle school): 103
Here:
12.8%
Oklahoma:
11.7%
Students in private schools in grades 9 to 12 (high school): 42
Here:
10.9%
Oklahoma:
11.7%
Students in private undergraduate colleges: 32
Here:
11.9%
Oklahoma:
19.3%
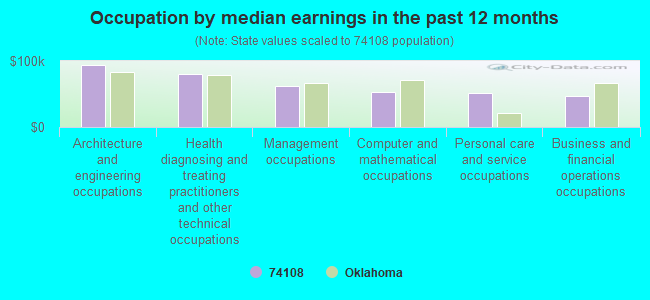
Occupation by median earnings in the past 12 months ($)
94,078Architecture and engineering occupations
80,284Health diagnosing and treating practitioners and other technical occupations
62,127Management occupations
53,248Computer and mathematical occupations
51,826Personal care and service occupations
46,303Business and financial operations occupations
Companies with federal contracts located in this zip code:
PEEVY CONSTRUCTION CO INC (20 S 129TH EAST AVE in TULSA, OK; small business)
$57,569 with Army for Construction of Structures and Facilities -- Airport Runways. Signed on 2000-09-18. Completion date: 2000-12-18.
Top industries in this zip code by the number of employees in 2005:
Other Services (except Public Administration): Commercial and Industrial Machinery and Equipment (except Automotive and Electronic) Repair and Maintenance (20-49: 1, 5-9: 1)
Other Services (except Public Administration): Religious Organizations (10-19: 1, 5-9: 1, 1-4: 7)
Management of Companies and Enterprises: Corporate, Subsidiary, and Regional Managing Offices (20-49: 1)
Wholesale Trade: Tire and Tube Merchant Wholesalers (20-49: 1)
Health Care and Social Assistance: Child Day Care Services (10-19: 1, 5-9: 1)
People in group quarters in 2010:
8 people in group homes intended for adults
People in group quarters in 2000:
6 people in hospitals/wards and hospices for chronically ill
6 people in other hospitals or wards for chronically ill
Fatal accident statistics in 2014:
Fatal accident count: 1
Vehicles involved in fatal accidents: 1
Fatal accidents caused by drunken drivers: 1
Fatalities: 1
Persons involved in fatal accidents: 1
Pedestrians involved in fatal accidents: 0
Fatal accident statistics in 2011:
Fatal accident count: 1
Vehicles involved in fatal accidents: 1
Fatal accidents caused by drunken drivers: 1
Fatalities: 2
Persons involved in fatal accidents: 2
Pedestrians involved in fatal accidents: 0
Home Mortgage Disclosure Act Aggregated Statistics For Year 2009 (Based on 2 full and 4 partial tracts)
A) FHA, FSA/RHS & VA Home Purchase Loans
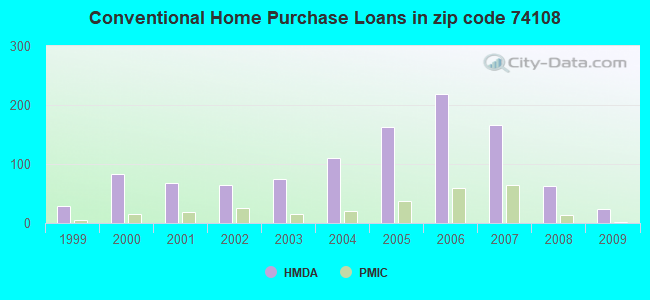
B) Conventional Home Purchase Loans
C) Refinancings
D) Home Improvement Loans
F) Non-occupant Loans on < 5 Family Dwellings (A B C & D)
G) Loans On Manufactured Home Dwelling (A B C & D)
Number
Average Value
Number
Average Value
Number
Average Value
Number
Average Value
Number
Average Value
Number
Average Value
LOANS ORIGINATED
81
$98,141
23
$65,404
97
$86,494
22
$36,021
21
$49,542
5
$15,592
APPLICATIONS APPROVED, NOT ACCEPTED
5
$116,434
3
$150,080
10
$91,095
0
$0
0
$0
3
$42,013
APPLICATIONS DENIED
11
$83,805
11
$69,983
42
$96,875
6
$23,215
5
$74,118
3
$34,217
APPLICATIONS WITHDRAWN
14
$114,125
5
$102,392
37
$100,185
1
$263,780
0
$0
0
$0
FILES CLOSED FOR INCOMPLETENESS
0
$0
0
$0
13
$141,654
2
$4,930
0
$0
0
$0
Aggregated Statistics For Year 2008 (Based on 2 full and 4 partial tracts)
A) FHA, FSA/RHS & VA Home Purchase Loans
B) Conventional Home Purchase Loans
C) Refinancings
D) Home Improvement Loans
E) Loans on Dwellings For 5+ Families
F) Non-occupant Loans on < 5 Family Dwellings (A B C & D)
G) Loans On Manufactured Home Dwelling (A B C & D)
Number
Average Value
Number
Average Value
Number
Average Value
Number
Average Value
Number
Average Value
Number
Average Value
Number
Average Value
LOANS ORIGINATED
66
$87,698
62
$118,510
74
$92,911
20
$43,083
2
$4,041,780
24
$102,573
6
$67,435
APPLICATIONS APPROVED, NOT ACCEPTED
1
$240,390
6
$149,878
18
$67,974
3
$62,307
0
$0
2
$32,775
0
$0
APPLICATIONS DENIED
5
$94,488
20
$89,876
84
$116,147
28
$49,167
0
$0
4
$56,980
3
$23,590
APPLICATIONS WITHDRAWN
2
$63,595
6
$177,212
36
$108,153
4
$32,942
0
$0
4
$45,512
0
$0
FILES CLOSED FOR INCOMPLETENESS
1
$72,770
3
$120,843
6
$124,202
0
$0
0
$0
1
$79,260
0
$0
Aggregated Statistics For Year 2007 (Based on 2 full and 4 partial tracts)
A) FHA, FSA/RHS & VA Home Purchase Loans
B) Conventional Home Purchase Loans
C) Refinancings
D) Home Improvement Loans
F) Non-occupant Loans on < 5 Family Dwellings (A B C & D)
G) Loans On Manufactured Home Dwelling (A B C & D)
Number
Average Value
Number
Average Value
Number
Average Value
Number
Average Value
Number
Average Value
Number
Average Value
LOANS ORIGINATED
29
$114,323
166
$97,971
89
$83,088
13
$17,153
26
$87,754
12
$39,523
APPLICATIONS APPROVED, NOT ACCEPTED
4
$99,072
17
$78,743
26
$94,071
3
$33,783
3
$83,807
5
$53,276
APPLICATIONS DENIED
2
$107,450
30
$99,241
111
$91,543
26
$46,798
9
$79,838
4
$68,725
APPLICATIONS WITHDRAWN
0
$0
10
$83,777
42
$100,992
5
$46,792
7
$98,134
0
$0
FILES CLOSED FOR INCOMPLETENESS
0
$0
2
$53,770
19
$108,100
0
$0
0
$0
0
$0
Aggregated Statistics For Year 2006 (Based on 2 full and 4 partial tracts)
A) FHA, FSA/RHS & VA Home Purchase Loans
B) Conventional Home Purchase Loans
C) Refinancings
D) Home Improvement Loans
F) Non-occupant Loans on < 5 Family Dwellings (A B C & D)
G) Loans On Manufactured Home Dwelling (A B C & D)
Number
Average Value
Number
Average Value
Number
Average Value
Number
Average Value
Number
Average Value
Number
Average Value
LOANS ORIGINATED
24
$89,872
219
$75,650
115
$80,439
31
$38,794
43
$66,349
8
$44,991
APPLICATIONS APPROVED, NOT ACCEPTED
2
$29,575
28
$85,319
36
$86,926
2
$88,110
9
$57,424
5
$27,422
APPLICATIONS DENIED
5
$79,980
70
$61,969
131
$98,448
39
$38,743
7
$77,133
24
$42,076
APPLICATIONS WITHDRAWN
2
$37,925
31
$79,086
92
$88,838
7
$30,226
13
$61,902
1
$75,370
FILES CLOSED FOR INCOMPLETENESS
0
$0
14
$90,401
17
$93,102
3
$80,370
0
$0
0
$0
Aggregated Statistics For Year 2005 (Based on 2 full and 4 partial tracts)
A) FHA, FSA/RHS & VA Home Purchase Loans
B) Conventional Home Purchase Loans
C) Refinancings
D) Home Improvement Loans
F) Non-occupant Loans on < 5 Family Dwellings (A B C & D)
G) Loans On Manufactured Home Dwelling (A B C & D)
Number
Average Value
Number
Average Value
Number
Average Value
Number
Average Value
Number
Average Value
Number
Average Value
LOANS ORIGINATED
21
$79,859
162
$66,034
135
$83,547
34
$27,156
19
$58,491
2
$63,090
APPLICATIONS APPROVED, NOT ACCEPTED
0
$0
28
$75,288
30
$83,293
3
$44,270
4
$59,672
4
$52,820
APPLICATIONS DENIED
2
$104,755
60
$64,913
150
$84,948
40
$25,965
13
$69,139
14
$40,572
APPLICATIONS WITHDRAWN
3
$106,983
24
$71,448
102
$89,019
12
$97,489
2
$81,820
1
$110,450
FILES CLOSED FOR INCOMPLETENESS
2
$76,890
15
$66,880
19
$85,066
2
$17,365
1
$67,570
0
$0
Aggregated Statistics For Year 2004 (Based on 2 full and 4 partial tracts)
A) FHA, FSA/RHS & VA Home Purchase Loans
B) Conventional Home Purchase Loans
C) Refinancings
D) Home Improvement Loans
F) Non-occupant Loans on < 5 Family Dwellings (A B C & D)
G) Loans On Manufactured Home Dwelling (A B C & D)
Number
Average Value
Number
Average Value
Number
Average Value
Number
Average Value
Number
Average Value
Number
Average Value
LOANS ORIGINATED
23
$92,523
111
$72,825
159
$78,398
25
$37,586
22
$62,297
3
$23,300
APPLICATIONS APPROVED, NOT ACCEPTED
2
$87,735
29
$50,484
26
$97,370
1
$9,700
2
$49,675
13
$37,294
APPLICATIONS DENIED
4
$76,928
50
$62,024
167
$87,499
39
$20,268
15
$246,003
30
$39,376
APPLICATIONS WITHDRAWN
1
$88,360
11
$103,050
95
$77,175
5
$24,408
4
$31,062
1
$64,970
FILES CLOSED FOR INCOMPLETENESS
1
$102,650
7
$58,186
16
$94,561
0
$0
0
$0
0
$0
Aggregated Statistics For Year 2003 (Based on 2 full and 4 partial tracts)
A) FHA, FSA/RHS & VA Home Purchase Loans
B) Conventional Home Purchase Loans
C) Refinancings
D) Home Improvement Loans
F) Non-occupant Loans on < 5 Family Dwellings (A B C & D)
Number
Average Value
Number
Average Value
Number
Average Value
Number
Average Value
Number
Average Value
LOANS ORIGINATED
34
$78,905
74
$68,333
384
$60,993
18
$25,559
73
$27,605
APPLICATIONS APPROVED, NOT ACCEPTED
0
$0
12
$61,872
53
$65,618
1
$88,360
4
$57,822
APPLICATIONS DENIED
0
$0
37
$52,989
168
$74,808
14
$25,316
5
$52,076
APPLICATIONS WITHDRAWN
3
$63,237
13
$66,898
92
$77,871
5
$25,058
1
$100,050
FILES CLOSED FOR INCOMPLETENESS
0
$0
3
$53,710
17
$84,195
4
$48,305
1
$66,270
Aggregated Statistics For Year 2002 (Based on 2 full and 2 partial tracts)
A) FHA, FSA/RHS & VA Home Purchase Loans
B) Conventional Home Purchase Loans
C) Refinancings
D) Home Improvement Loans
E) Loans on Dwellings For 5+ Families
F) Non-occupant Loans on < 5 Family Dwellings (A B C & D)
Number
Average Value
Number
Average Value
Number
Average Value
Number
Average Value
Number
Average Value
Number
Average Value
LOANS ORIGINATED
35
$72,194
65
$65,501
227
$64,201
27
$24,191
0
$0
18
$45,372
APPLICATIONS APPROVED, NOT ACCEPTED
0
$0
22
$69,093
38
$66,413
10
$35,833
0
$0
4
$57,498
APPLICATIONS DENIED
0
$0
33
$50,661
132
$63,378
19
$10,065
0
$0
12
$49,061
APPLICATIONS WITHDRAWN
3
$72,767
8
$142,231
86
$69,793
3
$13,503
0
$0
1
$29,890
FILES CLOSED FOR INCOMPLETENESS
3
$73,950
6
$80,885
14
$72,890
0
$0
2
$5,185,310
0
$0
Aggregated Statistics For Year 2001 (Based on 2 full and 2 partial tracts)
A) FHA, FSA/RHS & VA Home Purchase Loans
B) Conventional Home Purchase Loans
C) Refinancings
D) Home Improvement Loans
F) Non-occupant Loans on < 5 Family Dwellings (A B C & D)
Number
Average Value
Number
Average Value
Number
Average Value
Number
Average Value
Number
Average Value
LOANS ORIGINATED
54
$73,419
68
$58,050
124
$62,908
27
$19,969
23
$45,250
APPLICATIONS APPROVED, NOT ACCEPTED
2
$83,795
23
$47,488
29
$58,907
0
$0
3
$41,147
APPLICATIONS DENIED
1
$85,760
66
$46,136
99
$54,100
16
$12,782
7
$44,040
APPLICATIONS WITHDRAWN
1
$97,450
10
$55,861
91
$63,853
6
$7,617
0
$0
FILES CLOSED FOR INCOMPLETENESS
0
$0
1
$71,470
11
$87,335
0
$0
0
$0
Aggregated Statistics For Year 2000 (Based on 2 full and 2 partial tracts)
A) FHA, FSA/RHS & VA Home Purchase Loans
B) Conventional Home Purchase Loans
C) Refinancings
D) Home Improvement Loans
F) Non-occupant Loans on < 5 Family Dwellings (A B C & D)
Number
Average Value
Number
Average Value
Number
Average Value
Number
Average Value
Number
Average Value
LOANS ORIGINATED
46
$70,438
83
$64,987
73
$61,668
29
$18,362
25
$41,934
APPLICATIONS APPROVED, NOT ACCEPTED
3
$48,943
23
$60,720
28
$78,665
9
$42,612
1
$64,970
APPLICATIONS DENIED
6
$59,325
73
$46,238
65
$49,638
22
$13,039
12
$61,192
APPLICATIONS WITHDRAWN
3
$70,230
6
$81,862
28
$68,208
0
$0
0
$0
FILES CLOSED FOR INCOMPLETENESS
0
$0
4
$56,525
5
$57,434
0
$0
0
$0
Aggregated Statistics For Year 1999 (Based on 1 full and 1 partial tracts)
A) FHA, FSA/RHS & VA Home Purchase Loans
B) Conventional Home Purchase Loans
C) Refinancings
D) Home Improvement Loans
F) Non-occupant Loans on < 5 Family Dwellings (A B C & D)
2002 - 2018 National Fire Incident Reporting System (NFIRS) incidents
According to the data from the years 2002 - 2018 the average number of fires per year is 42. The highest number of reported fire incidents - 93 took place in 2011, and the least - 16 in 2002. The data has an increasing trend.
When looking into fire subcategories, the most reports belonged to: Outside Fires (57.3%), and Structure Fires (22.3%).
Fire incident types reported to NFIRS in Zip Code 74108

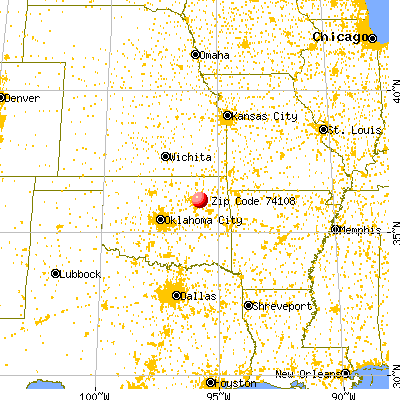


 Nearest zip codes: 74134, 74128, 74116, 74146, 74129, 74012.


 According to the data from the years 2002 - 2018 the average number of fires per year is 42. The highest number of reported fire incidents - 93 took place in 2011, and the least - 16 in 2002. The data has an increasing trend.
 When looking into fire subcategories, the most reports belonged to: Outside Fires (57.3%), and Structure Fires (22.3%).