Estimated zip code population in 2022: 2,133 Zip code population in 2010: 1,905 Zip code population in 2000: 1,622
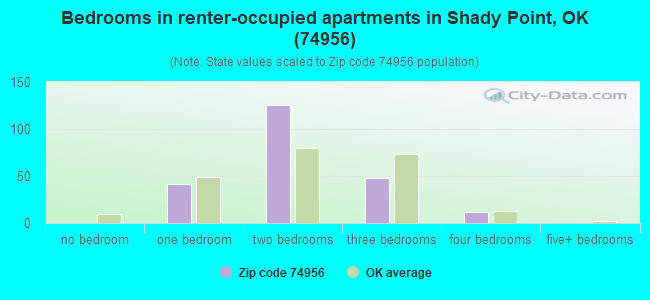
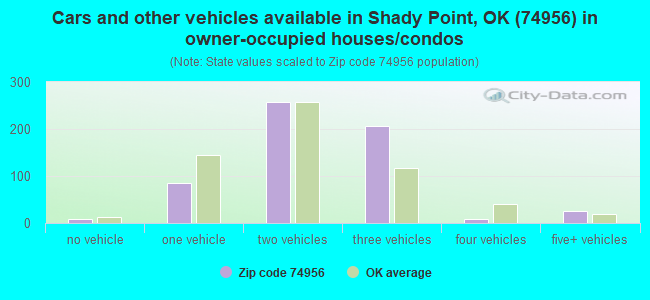
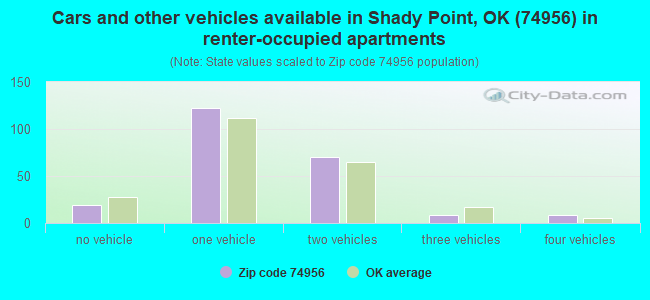
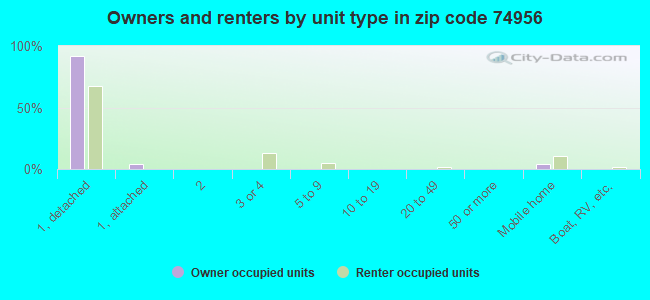
Houses and condos: 943 Renter-occupied apartments: 227
% of renters here:
28%
State:
35%
March 2022 cost of living index in zip code 74956: 79.4 (low, U.S. average is 100)
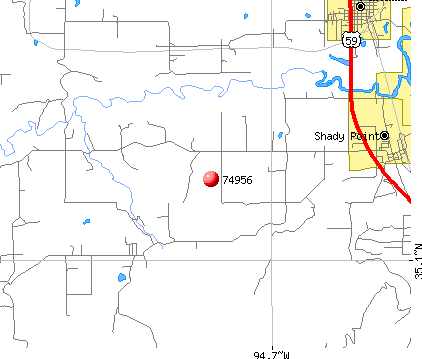
Land area: 41.3 sq. mi. Water area: 0.2 sq. mi.
Population density: 52 people per square mile
(very low).
OSM Map
General Map
Google Map
MSN Map
OSM Map
General Map
Google Map
MSN Map
OSM Map
General Map
Google Map
MSN Map
OSM Map
General Map
Google Map
MSN Map
Please wait while loading the map...
Real estate property taxes paid for housing units in 2022:
This zip code:
0.7% ($1,025)
Oklahoma:
0.8% ($1,501)
Median real estate property taxes paid for housing units with mortgages in 2022: $1,356 (0.8%) Median real estate property taxes paid for housing units with no mortgage in 2022: $758 (0.6%)
Averages for the 2020 tax year for zip code 74956, filed in 2021:
Average Adjusted Gross Income (AGI) in 2020: $41,571 (Individual Income Tax Returns)
Here:
$41,571
State:
$63,060
Salary/wage: $38,053 (reported on 80.5% of returns)
Here:
$38,053
State:
$52,427
(% of AGI for various income ranges: 1212.4% for AGIs below $25k, 3337.2% for AGIs $25k-50k, 6184.4% for AGIs $50k-75k, 9328.0% for AGIs $75k-100k, 14416.7% for AGIs $100k-200k)
Taxable interest for individuals: $115 (reported on 16.9% of returns)
This zip code:
$115
Oklahoma:
$1,603
(% of AGI for various income ranges: 1.2% for AGIs below $25k, 4.4% for AGIs $25k-50k, 8.0% for AGIs $75k-100k)
Ordinary dividends: $467 (reported on 3.9% of returns)
Here:
$467
State:
$7,001
(% of AGI for various income ranges: 7.8% for AGIs $25k-50k)
Net capital gain/loss in AGI: +$1,933 (reported on 7.8% of returns)
Here:
+$1,933
State:
+$19,855
(% of AGI for various income ranges: 0.4% for AGIs below $25k, 127.8% for AGIs $50k-75k)
Profit/loss from business: +$6,358 (reported on 15.6% of returns)
Here:
+$6,358
State:
+$9,904
(% of AGI for various income ranges: 160.0% for AGIs below $25k, 77.2% for AGIs $25k-50k, 87.8% for AGIs $50k-75k, 290.0% for AGIs $75k-100k)
Taxable individual retirement arrangement distribution: $9,233 (reported on 3.9% of returns)
74956:
$9,233
Oklahoma:
$20,476
(% of AGI for various income ranges: 153.9% for AGIs $25k-50k)
Taxes paid: $6,450 (reported on 2.6% of returns)
74956:
$6,450
State:
$7,046
(% of AGI for various income ranges: 143.3% for AGIs $50k-75k)
Earned income credit: $2,505 (reported on 27.3% of returns)
Here:
$2,505
State:
$2,435
(% of AGI for various income ranges: 137.2% for AGIs below $25k, 101.7% for AGIs $25k-50k)
Percentage of individuals using paid preparers for their 2020 taxes: 94.8%
Here:
95%
State:
94%
(% for various income ranges: 93.8% for AGIs below $25k, 95.2% for AGIs $25k-50k, 91.7% for AGIs $50k-75k, 100.0% for AGIs $75k-100k, 100.0% for AGIs $100k-200k)
Averages for the 2012 tax year for zip code 74956, filed in 2013:
Average Adjusted Gross Income (AGI) in 2012: $39,215 (Individual Income Tax Returns)
Here:
$39,215
State:
$58,581
Salary/wage: $36,546 (reported on 81.9% of returns)
Here:
$36,546
State:
$45,973
(% of AGI for various income ranges: 74.8% for AGIs below $25k, 79.3% for AGIs $25k-50k, 84.0% for AGIs $50k-75k, 78.2% for AGIs $75k-100k, 65.8% for AGIs $100k-200k)
Taxable interest for individuals: $633 (reported on 16.7% of returns)
This zip code:
$633
Oklahoma:
$1,625
(% of AGI for various income ranges: 1.5% for AGIs below $25k, 0.1% for AGIs $25k-50k, 0.1% for AGIs $75k-100k)
Ordinary dividends: $567 (reported on 4.2% of returns)
Here:
$567
State:
$6,374
Net capital gain/loss in AGI: +$3,425 (reported on 5.6% of returns)
Here:
+$3,425
State:
+$24,023
Profit/loss from business: +$6,250 (reported on 13.9% of returns)
Here:
+$6,250
State:
+$11,913
Taxable individual retirement arrangement distribution: $7,075 (reported on 5.6% of returns)
74956:
$7,075
Oklahoma:
$15,242
Total itemized deductions: $21,853 (28% of AGI, reported on 20.8% of returns)
Here:
$21,853
State:
$24,882
Here:
27.6% of AGI
State:
18.8% of AGI
(% of AGI for various income ranges: 12.1% for AGIs $25k-50k, 12.0% for AGIs $50k-75k, 14.2% for AGIs $75k-100k, 15.7% for AGIs $100k-200k)
Charity contributions: $3,325 (reported on 11.1% of returns)
Here:
$3,325
State:
$6,591
Taxes paid: $3,793 (reported on 20.8% of returns)
74956:
$3,793
State:
$7,196
(% of AGI for various income ranges: 1.4% for AGIs $25k-50k, 1.6% for AGIs $50k-75k, 2.7% for AGIs $75k-100k, 3.7% for AGIs $100k-200k)
Earned income credit: $2,420 (reported on 27.8% of returns)
Here:
$2,420
State:
$2,354
(% of AGI for various income ranges: 9.3% for AGIs below $25k, 1.8% for AGIs $25k-50k)
Percentage of individuals using paid preparers for their 2012 taxes: 75.0%
Here:
75%
State:
56%
(% for various income ranges: 67.7% for AGIs below $25k, 73.7% for AGIs $25k-50k, 80.0% for AGIs $50k-75k, 85.7% for AGIs $75k-100k, 100.0% for AGIs $100k-200k)
Averages for the 2004 tax year for zip code 74956, filed in 2005:
Average Adjusted Gross Income (AGI) in 2004: $27,204 (Individual Income Tax Returns)
Here:
$27,204
State:
$41,245
Salary/wage: $27,002 (reported on 84.4% of returns)
Here:
$27,002
State:
$35,318
(% of AGI for various income ranges: 75.9% for AGIs below $10k, 78.6% for AGIs $10k-25k, 88.8% for AGIs $25k-50k, 82.7% for AGIs $50k-75k, 82.7% for AGIs $75k-100k)
Taxable interest for individuals: $699 (reported on 23.2% of returns)
This zip code:
$699
Oklahoma:
$1,745
(% of AGI for various income ranges: 5.3% for AGIs below $10k, 1.0% for AGIs $10k-25k, 0.3% for AGIs $25k-50k, 0.2% for AGIs $50k-75k, 0.1% for AGIs $75k-100k)
Taxable dividends: $188 (reported on 7.2% of returns)
Here:
$188
State:
$2,920
Net capital gain/loss: +$800 (reported on 6.7% of returns)
Here:
+$800
State:
+$10,653
Profit/loss from business: +$3,391 (reported on 19.1% of returns)
Here:
+$3,391
State:
+$8,532
(% of AGI for various income ranges: 6.2% for AGIs below $10k, 8.0% for AGIs $10k-25k, 1.2% for AGIs $25k-50k, -0.4% for AGIs $50k-75k)
Total itemized deductions: $13,832 (28% of AGI, reported on 17.7% of returns)
Here:
$13,832
State:
$17,093
Here:
28.0% of AGI
State:
20.5% of AGI
(% of AGI for various income ranges: 6.1% for AGIs $10k-25k, 8.8% for AGIs $25k-50k, 10.0% for AGIs $50k-75k, 16.2% for AGIs $75k-100k)
Charity contributions deductions: $2,465 (5% of AGI, reported on 12.8% of returns)
Here:
$2,465
State:
$4,240
Here:
4.8% of AGI
State:
4.8% of AGI
(% of AGI for various income ranges: 1.0% for AGIs $10k-25k, 0.6% for AGIs $25k-50k, 1.3% for AGIs $50k-75k, 3.2% for AGIs $75k-100k)
Total tax: $2,458 (reported on 65.1% of returns)
74956:
$2,458
State:
$6,542
(% of AGI for various income ranges: 2.4% for AGIs below $10k, 3.4% for AGIs $10k-25k, 4.8% for AGIs $25k-50k, 8.2% for AGIs $50k-75k, 10.1% for AGIs $75k-100k)
Earned income credit: $1,823 (reported on 29.5% of returns)
Here:
$1,823
State:
$1,830
Percentage of individuals using paid preparers for their 2004 taxes: 82.7%
Here:
83%
State:
63%
(% for various income ranges: 75.7% for AGIs below $10k, 83.8% for AGIs $10k-25k, 85.6% for AGIs $25k-50k, 83.3% for AGIs $50k-75k, 91.7% for AGIs $75k-100k)
Likely homosexual households (counted as self-reported same-sex unmarried-partner households)
Lesbian couples: 0.2% of all households
Gay men: 0.0% of all households
Household received Food Stamps/SNAP in the past 12 months: 146 Household did not receive Food Stamps/SNAP in the past 12 months: 677
Women who had a birth in the past 12 months: 33 (34 now married, 0 unmarried) Women who did not have a birth in the past 12 months: 415 (246 now married, 169 unmarried)
Housing units in zip code 74956 with a mortgage: 263 (1 second mortgage) Median monthly owner costs for units with a mortgage: $1,186 Median monthly owner costs for units without a mortgage: $395
Residents with income below the poverty level in 2022:
This zip code:
21.6%
Whole state:
15.7%
Residents with income below 50% of the poverty level in 2022:
This zip code:
11.6%
Whole state:
8.3%
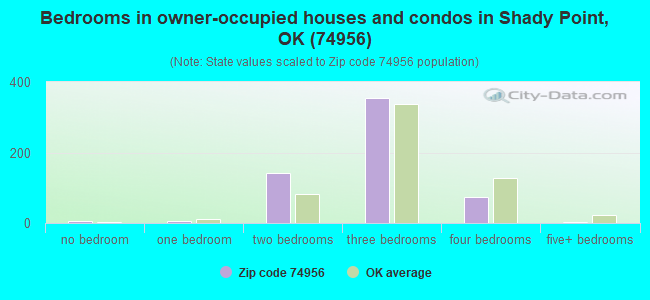
Median number of rooms in houses and condos:
Here:
5.6
State:
6.1
Median number of rooms in apartments:
Here:
4.8
State:
4.5
Notable locations in this zip code not listed on our city pages
Size of family households: 288 2-persons, 189 3-persons, 64 4-persons, 48 5-persons, 12 6-persons, 16 7-or-more-persons
Size of nonfamily households: 156 1-person, 44 2-persons, 3 5-persons
340 married couples with children.
105 single-parent households (9 men, 96 women).
96.5% of residents of 74956 zip code speak English at home.
0.4% of residents speak Spanish at home (78% very well, 11% well, 11% not well).
2.8% of residents speak Asian or Pacific Island language at home (42% very well, 58% well).
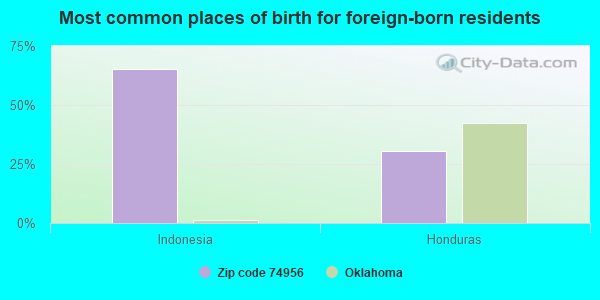
Foreign born population: 23 (1.1%) (71.0% of them are naturalized citizens)
This zip code:
1.1%
Whole state:
6.0%
65%Indonesia
30%Honduras
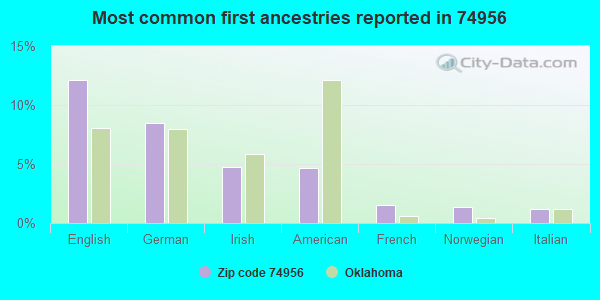
12%English
8%German
5%Irish
5%American
2%French
1%Norwegian
1%Italian
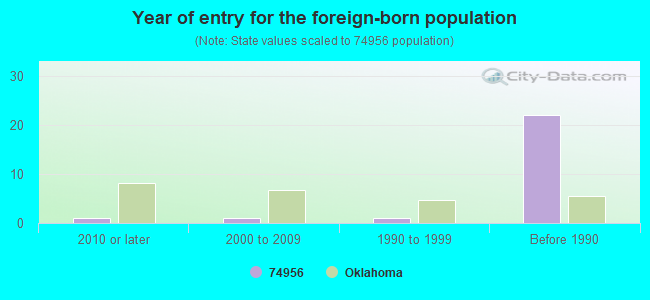
Year of entry for the foreign-born population
12010 or later
12000 to 2009
11990 to 1999
22Before 1990
Facilities with environmental interests located in this zip code:
BRAZIL CREEK MINERA/COAL MINING OPERATIO (CALHOUN RD in SHADY POINT, OK) . Tribal Land
AIR MINOR (AIRS/AFS) National Pollutant Discharge Elimination System NON-MAJOR (Tracking pollutant discharge elimination systems) - permit National Pollutant Discharge Elimination System NON-MAJOR (Tracking pollutant discharge elimination systems) - permit Business SIC classification: BITUMINOUS COAL AND LIGNITE SURFACE MINING Alternative names: BRAZIL CREEK MINERALS, INC., BRAZIL CREEK MINERALS, INC.-RE, BRAZIL CREEK MINERALS, INC-SHA, BRAZIL CREEK MINERALS-REED #2, BRAZIL CREEK MINERALS-SHADY PT, SHADY POINT MINE
Housing units lacking complete plumbing facilities: 1.8% Housing units lacking complete kitchen facilities: 3.5%
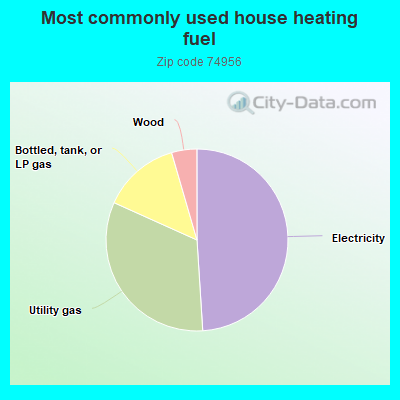
49.1%Electricity
32.8%Utility gas
13.8%Bottled, tank, or LP gas
4.5%Wood
Population in 1990: 937. Population change in the 1990s: +685 (+73.1%).
Place of birth for U.S.-born residents:
This state: 1,008
Northeast: 24
Midwest: 76
South: 705
West: 301
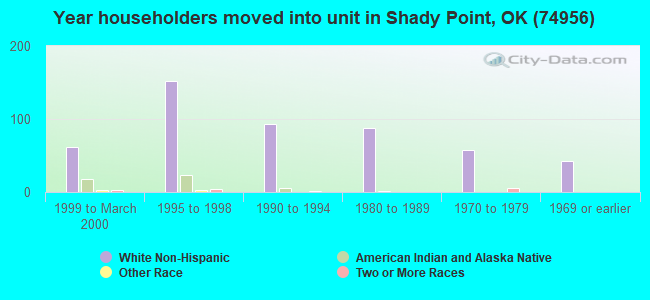
55% of the 74956 zip code residents lived in the same house 5 years ago. Out of people who lived in different houses, 65% lived in this county. Out of people who lived in different counties, 50% lived in Oklahoma.
91% of the 74956 zip code residents lived in the same house 1 year ago. Out of people who lived in different houses, 38% moved from this county. Out of people who lived in different houses, 8% moved from different county within same state. Out of people who lived in different houses, 61% moved from different state.
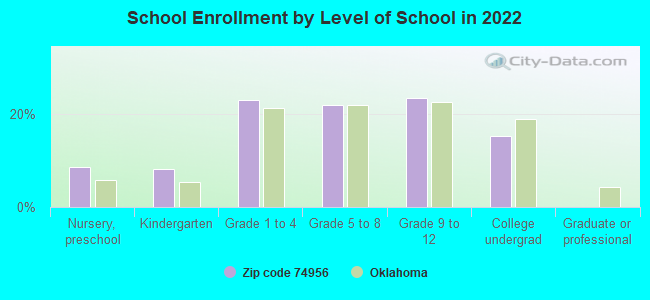
Private vs. public school enrollment:
Students in private schools in grades 1 to 8 (elementary and middle school): 4
Here:
1.9%
Oklahoma:
11.7%
Students in private schools in grades 9 to 12 (high school): 8
Here:
7.9%
Oklahoma:
11.7%
Students in private undergraduate colleges: 20
Here:
28.1%
Oklahoma:
19.3%
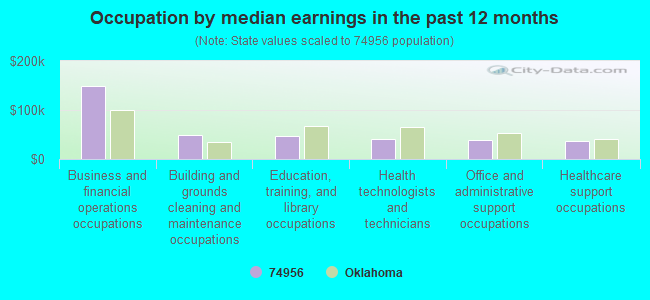
Occupation by median earnings in the past 12 months ($)
149,666Business and financial operations occupations
48,721Building and grounds cleaning and maintenance occupations
46,882Education, training, and library occupations
40,157Health technologists and technicians
39,157Office and administrative support occupations
36,723Healthcare support occupations
Companies with federal contracts located in this zip code:
FLOYD & JOYCE HARDWICK (R 1 BOX 770 in SHADY POINT, OK; small business) : -$437 in 3 contractsfrom 2002 to 2003
$284 with U.S. Army Corps of Engineers - civil program financing only for Operation of Government-Owned Facilities -- Recreation Facilities (Non-Building). Signed on 2002-10-28. Completion date: 2002-10-31.
$0 with U.S. Army Corps of Engineers - civil program financing only for Operation of Government-Owned Facilities -- Recreation Facilities (Non-Building). Taking place in AR. Signed on 2003-01-17. Completion date: 2002-10-31.
-$721, same as above.Signed on 2003-01-17. Completion date: 2002-10-31.
Top industries in this zip code by the number of employees in 2005:
Mining: Other Crushed and Broken Stone Mining and Quarrying (10-19 employees: 1 establishment)
Mining: Drilling Oil and Gas Wells (1-4: 1)
Real Estate and Rental and Leasing: Construction, Mining, and Forestry Machinery and Equipment Rental and Leasing (1-4: 1)
Other Services (except Public Administration): Religious Organizations (1-4: 1)
Wholesale Trade: Drugs and Druggists' Sundries Merchant Wholesalers (1-4: 1)
Fatal accident statistics in 2012:
Fatal accident count: 2
Vehicles involved in fatal accidents: 2
Fatal accidents caused by drunken drivers: 0
Fatalities: 2
Persons involved in fatal accidents: 3
Pedestrians involved in fatal accidents: 0
Fatal accident statistics in 2011:
Fatal accident count: 1
Vehicles involved in fatal accidents: 2
Fatal accidents caused by drunken drivers: 1
Fatalities: 1
Persons involved in fatal accidents: 4
Pedestrians involved in fatal accidents: 0
Home Mortgage Disclosure Act Aggregated Statistics For Year 2009 (Based on 4 partial tracts)
A) FHA, FSA/RHS & VA Home Purchase Loans
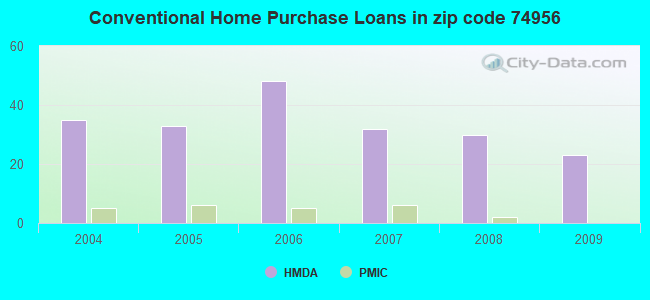
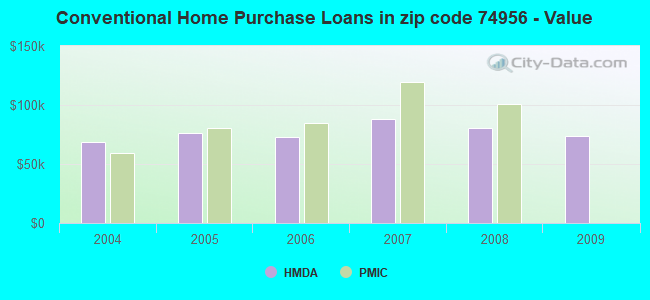
B) Conventional Home Purchase Loans
C) Refinancings
D) Home Improvement Loans
F) Non-occupant Loans on < 5 Family Dwellings (A B C & D)
G) Loans On Manufactured Home Dwelling (A B C & D)
Number
Average Value
Number
Average Value
Number
Average Value
Number
Average Value
Number
Average Value
Number
Average Value
LOANS ORIGINATED
13
$78,875
23
$73,650
48
$99,124
7
$24,611
7
$52,059
14
$46,920
APPLICATIONS APPROVED, NOT ACCEPTED
2
$132,040
3
$45,763
3
$93,613
0
$0
2
$28,995
3
$42,313
APPLICATIONS DENIED
1
$76,520
12
$47,472
21
$97,509
6
$43,008
1
$15,670
8
$52,091
APPLICATIONS WITHDRAWN
2
$106,720
2
$53,310
16
$108,420
1
$20,330
0
$0
2
$73,660
FILES CLOSED FOR INCOMPLETENESS
1
$66,660
2
$92,075
4
$115,238
1
$23,510
0
$0
1
$112,840
Aggregated Statistics For Year 2008 (Based on 4 partial tracts)
A) FHA, FSA/RHS & VA Home Purchase Loans
B) Conventional Home Purchase Loans
C) Refinancings
D) Home Improvement Loans
F) Non-occupant Loans on < 5 Family Dwellings (A B C & D)
G) Loans On Manufactured Home Dwelling (A B C & D)
Number
Average Value
Number
Average Value
Number
Average Value
Number
Average Value
Number
Average Value
Number
Average Value
LOANS ORIGINATED
14
$92,268
30
$80,629
30
$86,757
14
$52,682
2
$58,935
14
$73,187
APPLICATIONS APPROVED, NOT ACCEPTED
1
$72,870
6
$37,312
5
$70,252
2
$26,715
2
$33,405
6
$45,150
APPLICATIONS DENIED
1
$35,130
25
$66,143
31
$86,695
12
$30,789
2
$88,605
24
$49,441
APPLICATIONS WITHDRAWN
1
$74,440
4
$116,758
19
$106,388
5
$31,120
0
$0
2
$56,810
FILES CLOSED FOR INCOMPLETENESS
1
$42,310
2
$114,805
5
$148,830
0
$0
0
$0
1
$43,340
Aggregated Statistics For Year 2007 (Based on 4 partial tracts)
A) FHA, FSA/RHS & VA Home Purchase Loans
B) Conventional Home Purchase Loans
C) Refinancings
D) Home Improvement Loans
F) Non-occupant Loans on < 5 Family Dwellings (A B C & D)
G) Loans On Manufactured Home Dwelling (A B C & D)
Number
Average Value
Number
Average Value
Number
Average Value
Number
Average Value
Number
Average Value
Number
Average Value
LOANS ORIGINATED
11
$100,230
32
$87,963
58
$83,147
12
$26,657
13
$47,797
21
$51,954
APPLICATIONS APPROVED, NOT ACCEPTED
0
$0
10
$71,291
3
$101,197
2
$11,755
2
$41,470
5
$46,516
APPLICATIONS DENIED
1
$103,750
22
$84,521
33
$71,763
20
$36,768
2
$53,675
12
$55,065
APPLICATIONS WITHDRAWN
1
$76,010
5
$201,738
13
$82,875
2
$106,270
0
$0
2
$76,125
FILES CLOSED FOR INCOMPLETENESS
0
$0
2
$41,140
9
$83,697
0
$0
0
$0
0
$0
Aggregated Statistics For Year 2006 (Based on 4 partial tracts)
A) FHA, FSA/RHS & VA Home Purchase Loans
B) Conventional Home Purchase Loans
C) Refinancings
D) Home Improvement Loans
F) Non-occupant Loans on < 5 Family Dwellings (A B C & D)
G) Loans On Manufactured Home Dwelling (A B C & D)
Number
Average Value
Number
Average Value
Number
Average Value
Number
Average Value
Number
Average Value
Number
Average Value
LOANS ORIGINATED
8
$103,848
48
$72,735
54
$69,801
25
$26,690
7
$60,314
15
$49,830
APPLICATIONS APPROVED, NOT ACCEPTED
0
$0
8
$56,285
5
$104,020
2
$12,670
0
$0
6
$39,728
APPLICATIONS DENIED
2
$125,375
30
$63,076
52
$69,960
22
$33,114
5
$54,226
16
$49,472
APPLICATIONS WITHDRAWN
0
$0
10
$60,204
18
$74,076
4
$51,482
3
$72,400
0
$0
FILES CLOSED FOR INCOMPLETENESS
0
$0
2
$78,780
6
$104,163
2
$30,170
1
$40,750
0
$0
Aggregated Statistics For Year 2005 (Based on 4 partial tracts)
A) FHA, FSA/RHS & VA Home Purchase Loans
B) Conventional Home Purchase Loans
C) Refinancings
D) Home Improvement Loans
F) Non-occupant Loans on < 5 Family Dwellings (A B C & D)
G) Loans On Manufactured Home Dwelling (A B C & D)
Number
Average Value
Number
Average Value
Number
Average Value
Number
Average Value
Number
Average Value
Number
Average Value
LOANS ORIGINATED
6
$76,472
33
$76,681
52
$69,194
22
$28,268
8
$56,015
14
$59,620
APPLICATIONS APPROVED, NOT ACCEPTED
0
$0
11
$55,734
6
$121,730
2
$11,955
0
$0
9
$46,893
APPLICATIONS DENIED
2
$104,275
24
$62,965
58
$65,821
18
$27,796
2
$54,850
16
$46,191
APPLICATIONS WITHDRAWN
1
$102,650
10
$80,107
33
$82,503
7
$105,504
3
$103,887
2
$48,880
FILES CLOSED FOR INCOMPLETENESS
0
$0
1
$67,400
9
$63,418
0
$0
0
$0
0
$0
Aggregated Statistics For Year 2004 (Based on 4 partial tracts)
A) FHA, FSA/RHS & VA Home Purchase Loans
B) Conventional Home Purchase Loans
C) Refinancings
D) Home Improvement Loans
F) Non-occupant Loans on < 5 Family Dwellings (A B C & D)
G) Loans On Manufactured Home Dwelling (A B C & D)

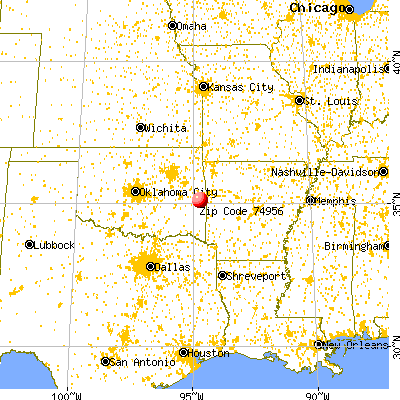


 Nearest zip codes: 74930, 74951, 74953, 74935, 74941, 74940.
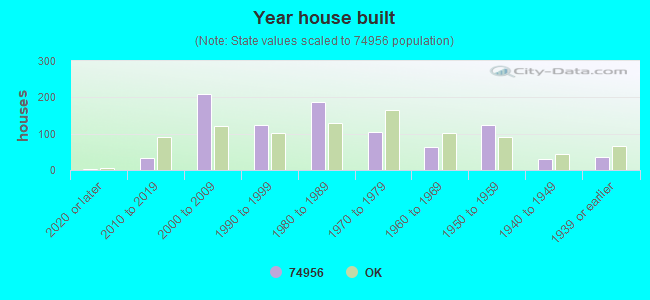


 . Tribal Land