Estimated zip code population in 2022: 63,346
Zip code population in 2010: 56,526
Zip code population in 2000: 51,716
Houses and condos: 21,339
Renter-occupied apartments: 10,969
% of renters here:
55%State:
38%
March 2022 cost of living index in zip code 77072: 96.1
(near average, U.S. average is 100)
Land area: 7.3
sq. mi.
Water area: 0.0
sq. mi.
Population density: 8,641 people per square mile (high).
OSM Map
General Map
Google Map
MSN Map
OSM Map
General Map
Google Map
MSN Map
OSM Map
General Map
Google Map
MSN Map
OSM Map
General Map
Google Map
MSN Map
Please wait while loading the map...
Real estate property taxes paid for housing units in 2022:
This zip code:
1.3% ($2,417)Texas:
1.5% ($4,050)
Median real estate property taxes paid for housing units with mortgages in 2022: $2,651 (1.4%)
Median real estate property taxes paid for housing units with no mortgage in 2022: $2,284 (1.2%)
Profiles of local businesses
Business Search - 14 Million verified businesses
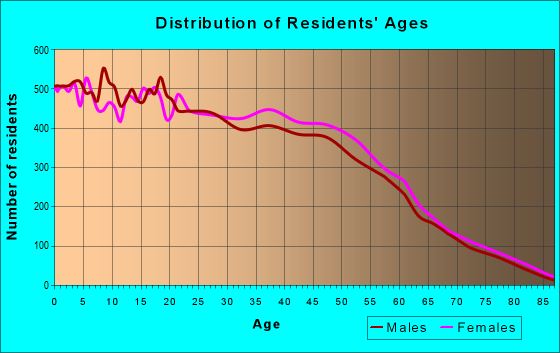
Males: 31,536 Females: 31,810
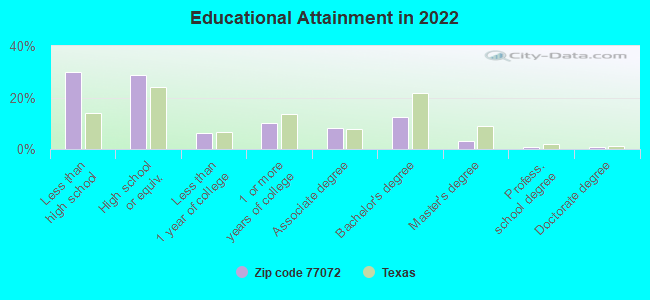
For population 25 years and over in 77072:
High school or higher: 69.4%Bachelor's degree or higher: 16.9%Graduate or professional degree: 4.7%Unemployed: 4.8%Mean travel time to work (commute): 30.3 minutes
For population 15 years and over in 77072:
Never married: 43.4%Now married: 43.4%Separated: 2.8%Widowed: 3.2%Divorced: 7.1%
Zip code 77072 compared to state average:
Black race population percentage above state average. Foreign-born population percentage significantly above state average. Length of stay since moving in significantly above state average. Percentage of population with a bachelor's degree or higher below state average. 30,375 48.0% Hispanic or Latino 14,508 22.9% Asian 14,050 22.2% Black 3,279 5.2% White 995 1.6% Two or more races 135 0.2% Some other race
Data:
Median household income ($)
Median household income (% change since 2000)
Household income diversity
Ratio of average income to average house value (%)
Ratio of average income to average rent
Median household income ($) - White
Median household income ($) - Black or African American
Median household income ($) - Asian
Median household income ($) - Hispanic or Latino
Median household income ($) - American Indian and Alaska Native
Median household income ($) - Multirace
Median household income ($) - Other Race
Median household income for houses/condos with a mortgage ($)
Median household income for apartments without a mortgage ($)
Races - White alone (%)
Races - White alone (% change since 2000)
Races - Black alone (%)
Races - Black alone (% change since 2000)
Races - American Indian alone (%)
Races - American Indian alone (% change since 2000)
Races - Asian alone (%)
Races - Asian alone (% change since 2000)
Races - Hispanic (%)
Races - Hispanic (% change since 2000)
Races - Native Hawaiian and Other Pacific Islander alone (%)
Races - Native Hawaiian and Other Pacific Islander alone (% change since 2000)
Races - Two or more races (%)
Races - Two or more races (% change since 2000)
Races - Other race alone (%)
Races - Other race alone (% change since 2000)
Racial diversity
Unemployment (%)
Unemployment (% change since 2000)
Unemployment (%) - White
Unemployment (%) - Black or African American
Unemployment (%) - Asian
Unemployment (%) - Hispanic or Latino
Unemployment (%) - American Indian and Alaska Native
Unemployment (%) - Multirace
Unemployment (%) - Other Race
Population density (people per square mile)
Population - Males (%)
Population - Females (%)
Population - Males (%) - White
Population - Males (%) - Black or African American
Population - Males (%) - Asian
Population - Males (%) - Hispanic or Latino
Population - Males (%) - American Indian and Alaska Native
Population - Males (%) - Multirace
Population - Males (%) - Other Race
Population - Females (%) - White
Population - Females (%) - Black or African American
Population - Females (%) - Asian
Population - Females (%) - Hispanic or Latino
Population - Females (%) - American Indian and Alaska Native
Population - Females (%) - Multirace
Population - Females (%) - Other Race
Coronavirus confirmed cases (Jun 08, 2024)
Deaths caused by coronavirus (Jun 08, 2024)
Coronavirus confirmed cases (per 100k population) (Jun 08, 2024)
Deaths caused by coronavirus (per 100k population) (Jun 08, 2024)
Daily increase in number of cases (Jun 08, 2024)
Weekly increase in number of cases (Jun 08, 2024)
Cases doubled (in days) (Jun 08, 2024)
Hospitalized patients (Apr 18, 2022)
Negative test results (Apr 18, 2022)
Total test results (Apr 18, 2022)
COVID Vaccine doses distributed (per 100k population) (Sep 19, 2023)
COVID Vaccine doses administered (per 100k population) (Sep 19, 2023)
COVID Vaccine doses distributed (Sep 19, 2023)
COVID Vaccine doses administered (Sep 19, 2023)
Likely homosexual households (%)
Likely homosexual households (% change since 2000)
Likely homosexual households - Lesbian couples (%)
Likely homosexual households - Lesbian couples (% change since 2000)
Likely homosexual households - Gay men (%)
Likely homosexual households - Gay men (% change since 2000)
Cost of living index
Median gross rent ($)
Median contract rent ($)
Median monthly housing costs ($)
Median house or condo value ($)
Median house or condo value ($ change since 2000)
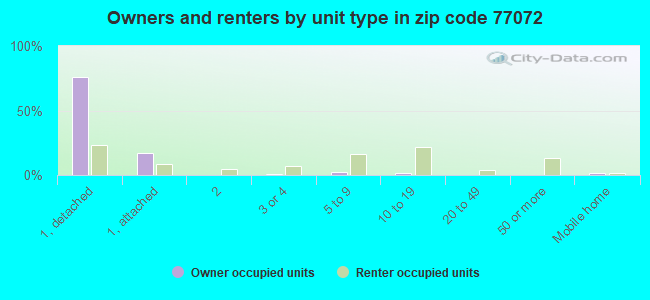
Mean house or condo value by units in structure - 1, detached ($)
Mean house or condo value by units in structure - 1, attached ($)
Mean house or condo value by units in structure - 2 ($)
Mean house or condo value by units in structure by units in structure - 3 or 4 ($)
Mean house or condo value by units in structure - 5 or more ($)
Mean house or condo value by units in structure - Boat, RV, van, etc. ($)
Mean house or condo value by units in structure - Mobile home ($)
Median house or condo value ($) - White
Median house or condo value ($) - Black or African American
Median house or condo value ($) - Asian
Median house or condo value ($) - Hispanic or Latino
Median house or condo value ($) - American Indian and Alaska Native
Median house or condo value ($) - Multirace
Median house or condo value ($) - Other Race
Median resident age
Resident age diversity
Median resident age - Males
Median resident age - Females
Median resident age - White
Median resident age - Black or African American
Median resident age - Asian
Median resident age - Hispanic or Latino
Median resident age - American Indian and Alaska Native
Median resident age - Multirace
Median resident age - Other Race
Median resident age - Males - White
Median resident age - Males - Black or African American
Median resident age - Males - Asian
Median resident age - Males - Hispanic or Latino
Median resident age - Males - American Indian and Alaska Native
Median resident age - Males - Multirace
Median resident age - Males - Other Race
Median resident age - Females - White
Median resident age - Females - Black or African American
Median resident age - Females - Asian
Median resident age - Females - Hispanic or Latino
Median resident age - Females - American Indian and Alaska Native
Median resident age - Females - Multirace
Median resident age - Females - Other Race
Commute - mean travel time to work (minutes)
Travel time to work - Less than 5 minutes (%)
Travel time to work - Less than 5 minutes (% change since 2000)
Travel time to work - 5 to 9 minutes (%)
Travel time to work - 5 to 9 minutes (% change since 2000)
Travel time to work - 10 to 19 minutes (%)
Travel time to work - 10 to 19 minutes (% change since 2000)
Travel time to work - 20 to 29 minutes (%)
Travel time to work - 20 to 29 minutes (% change since 2000)
Travel time to work - 30 to 39 minutes (%)
Travel time to work - 30 to 39 minutes (% change since 2000)
Travel time to work - 40 to 59 minutes (%)
Travel time to work - 40 to 59 minutes (% change since 2000)
Travel time to work - 60 to 89 minutes (%)
Travel time to work - 60 to 89 minutes (% change since 2000)
Travel time to work - 90 or more minutes (%)
Travel time to work - 90 or more minutes (% change since 2000)
Marital status - Never married (%)
Marital status - Now married (%)
Marital status - Separated (%)
Marital status - Widowed (%)
Marital status - Divorced (%)
Median family income ($)
Median family income (% change since 2000)
Median non-family income ($)
Median non-family income (% change since 2000)
Median per capita income ($)
Median per capita income (% change since 2000)
Median family income ($) - White
Median family income ($) - Black or African American
Median family income ($) - Asian
Median family income ($) - Hispanic or Latino
Median family income ($) - American Indian and Alaska Native
Median family income ($) - Multirace
Median family income ($) - Other Race
Median year house/condo built
Median year apartment built
Year house built - Built 2005 or later (%)
Year house built - Built 2000 to 2004 (%)
Year house built - Built 1990 to 1999 (%)
Year house built - Built 1980 to 1989 (%)
Year house built - Built 1970 to 1979 (%)
Year house built - Built 1960 to 1969 (%)
Year house built - Built 1950 to 1959 (%)
Year house built - Built 1940 to 1949 (%)
Year house built - Built 1939 or earlier (%)
Average household size
Household density (households per square mile)
Average household size - White
Average household size - Black or African American
Average household size - Asian
Average household size - Hispanic or Latino
Average household size - American Indian and Alaska Native
Average household size - Multirace
Average household size - Other Race
Occupied housing units (%)
Vacant housing units (%)
Owner occupied housing units (%)
Renter occupied housing units (%)
Vacancy status - For rent (%)
Vacancy status - For sale only (%)
Vacancy status - Rented or sold, not occupied (%)
Vacancy status - For seasonal, recreational, or occasional use (%)
Vacancy status - For migrant workers (%)
Vacancy status - Other vacant (%)
Residents with income below the poverty level (%)
Residents with income below 50% of the poverty level (%)
Children below poverty level (%)
Poor families by family type - Married-couple family (%)
Poor families by family type - Male, no wife present (%)
Poor families by family type - Female, no husband present (%)
Poverty status for native-born residents (%)
Poverty status for foreign-born residents (%)
Poverty among high school graduates not in families (%)
Poverty among people who did not graduate high school not in families (%)
Residents with income below the poverty level (%) - White
Residents with income below the poverty level (%) - Black or African American
Residents with income below the poverty level (%) - Asian
Residents with income below the poverty level (%) - Hispanic or Latino
Residents with income below the poverty level (%) - American Indian and Alaska Native
Residents with income below the poverty level (%) - Multirace
Residents with income below the poverty level (%) - Other Race
Air pollution - Air Quality Index (AQI)
Air pollution - CO
Air pollution - NO2
Air pollution - SO2
Air pollution - Ozone
Air pollution - PM10
Air pollution - PM25
Air pollution - Pb
Crime - Murders per 100,000 population
Crime - Rapes per 100,000 population
Crime - Robberies per 100,000 population
Crime - Assaults per 100,000 population
Crime - Burglaries per 100,000 population
Crime - Thefts per 100,000 population
Crime - Auto thefts per 100,000 population
Crime - Arson per 100,000 population
Crime - City-data.com crime index
Crime - Violent crime index
Crime - Property crime index
Crime - Murders per 100,000 population (5 year average)
Crime - Rapes per 100,000 population (5 year average)
Crime - Robberies per 100,000 population (5 year average)
Crime - Assaults per 100,000 population (5 year average)
Crime - Burglaries per 100,000 population (5 year average)
Crime - Thefts per 100,000 population (5 year average)
Crime - Auto thefts per 100,000 population (5 year average)
Crime - Arson per 100,000 population (5 year average)
Crime - City-data.com crime index (5 year average)
Crime - Violent crime index (5 year average)
Crime - Property crime index (5 year average)
1996 Presidential Elections Results (%) - Democratic Party (Clinton)
1996 Presidential Elections Results (%) - Republican Party (Dole)
1996 Presidential Elections Results (%) - Other
2000 Presidential Elections Results (%) - Democratic Party (Gore)
2000 Presidential Elections Results (%) - Republican Party (Bush)
2000 Presidential Elections Results (%) - Other
2004 Presidential Elections Results (%) - Democratic Party (Kerry)
2004 Presidential Elections Results (%) - Republican Party (Bush)
2004 Presidential Elections Results (%) - Other
2008 Presidential Elections Results (%) - Democratic Party (Obama)
2008 Presidential Elections Results (%) - Republican Party (McCain)
2008 Presidential Elections Results (%) - Other
2012 Presidential Elections Results (%) - Democratic Party (Obama)
2012 Presidential Elections Results (%) - Republican Party (Romney)
2012 Presidential Elections Results (%) - Other
2016 Presidential Elections Results (%) - Democratic Party (Clinton)
2016 Presidential Elections Results (%) - Republican Party (Trump)
2016 Presidential Elections Results (%) - Other
2020 Presidential Elections Results (%) - Democratic Party (Biden)
2020 Presidential Elections Results (%) - Republican Party (Trump)
2020 Presidential Elections Results (%) - Other
Ancestries Reported - Arab (%)
Ancestries Reported - Czech (%)
Ancestries Reported - Danish (%)
Ancestries Reported - Dutch (%)
Ancestries Reported - English (%)
Ancestries Reported - French (%)
Ancestries Reported - French Canadian (%)
Ancestries Reported - German (%)
Ancestries Reported - Greek (%)
Ancestries Reported - Hungarian (%)
Ancestries Reported - Irish (%)
Ancestries Reported - Italian (%)
Ancestries Reported - Lithuanian (%)
Ancestries Reported - Norwegian (%)
Ancestries Reported - Polish (%)
Ancestries Reported - Portuguese (%)
Ancestries Reported - Russian (%)
Ancestries Reported - Scotch-Irish (%)
Ancestries Reported - Scottish (%)
Ancestries Reported - Slovak (%)
Ancestries Reported - Subsaharan African (%)
Ancestries Reported - Swedish (%)
Ancestries Reported - Swiss (%)
Ancestries Reported - Ukrainian (%)
Ancestries Reported - United States (%)
Ancestries Reported - Welsh (%)
Ancestries Reported - West Indian (%)
Ancestries Reported - Other (%)
Educational Attainment - No schooling completed (%)
Educational Attainment - Less than high school (%)
Educational Attainment - High school or equivalent (%)
Educational Attainment - Less than 1 year of college (%)
Educational Attainment - 1 or more years of college (%)
Educational Attainment - Associate degree (%)
Educational Attainment - Bachelor's degree (%)
Educational Attainment - Master's degree (%)
Educational Attainment - Professional school degree (%)
Educational Attainment - Doctorate degree (%)
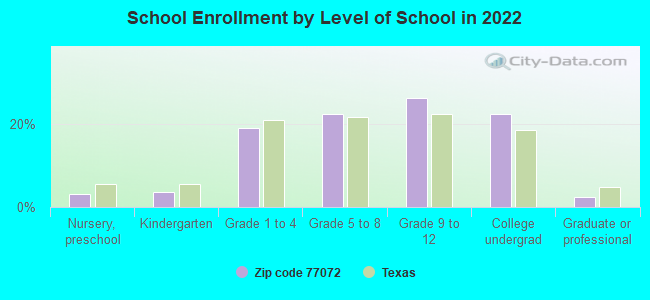
School Enrollment - Nursery, preschool (%)
School Enrollment - Kindergarten (%)
School Enrollment - Grade 1 to 4 (%)
School Enrollment - Grade 5 to 8 (%)
School Enrollment - Grade 9 to 12 (%)
School Enrollment - College undergrad (%)
School Enrollment - Graduate or professional (%)
School Enrollment - Not enrolled in school (%)
School enrollment - Public schools (%)
School enrollment - Private schools (%)
School enrollment - Not enrolled (%)
Median number of rooms in houses and condos
Median number of rooms in apartments
Housing units lacking complete plumbing facilities (%)
Housing units lacking complete kitchen facilities (%)
Density of houses
Urban houses (%)
Rural houses (%)
Households with people 60 years and over (%)
Households with people 65 years and over (%)
Households with people 75 years and over (%)
Households with one or more nonrelatives (%)
Households with no nonrelatives (%)
Population in households (%)
Family households (%)
Nonfamily households (%)
Population in families (%)
Family households with own children (%)
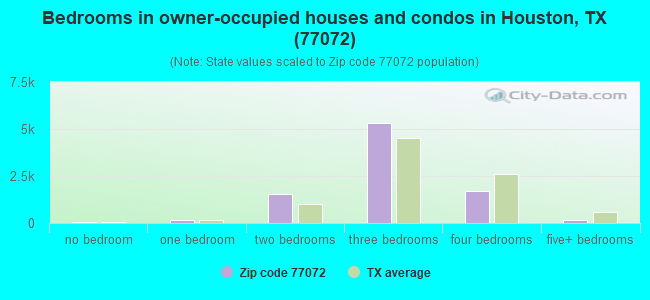
Median number of bedrooms in owner occupied houses
Mean number of bedrooms in owner occupied houses
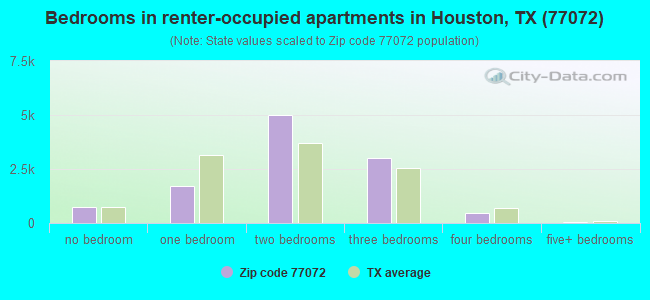
Median number of bedrooms in renter occupied houses
Mean number of bedrooms in renter occupied houses
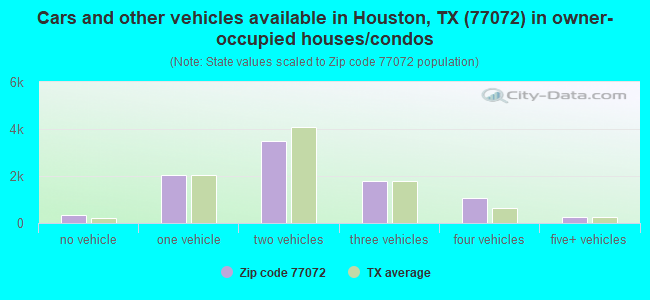
Median number of vehichles in owner occupied houses
Mean number of vehichles in owner occupied houses
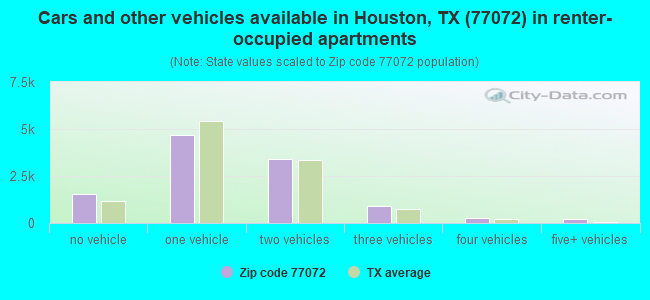
Median number of vehichles in renter occupied houses
Mean number of vehichles in renter occupied houses
Mortgage status - with mortgage (%)
Mortgage status - with second mortgage (%)
Mortgage status - with home equity loan (%)
Mortgage status - with both second mortgage and home equity loan (%)
Mortgage status - without a mortgage (%)
Average family size
Average family size - White
Average family size - Black or African American
Average family size - Asian
Average family size - Hispanic or Latino
Average family size - American Indian and Alaska Native
Average family size - Multirace
Average family size - Other Race
Geographical mobility - Same house 1 year ago (%)
Geographical mobility - Moved within same county (%)
Geographical mobility - Moved from different county within same state (%)
Geographical mobility - Moved from different state (%)
Geographical mobility - Moved from abroad (%)
Place of birth - Born in state of residence (%)
Place of birth - Born in other state (%)
Place of birth - Native, outside of US (%)
Place of birth - Foreign born (%)
Housing units in structures - 1, detached (%)
Housing units in structures - 1, attached (%)
Housing units in structures - 2 (%)
Housing units in structures - 3 or 4 (%)
Housing units in structures - 5 to 9 (%)
Housing units in structures - 10 to 19 (%)
Housing units in structures - 20 to 49 (%)
Housing units in structures - 50 or more (%)
Housing units in structures - Mobile home (%)
Housing units in structures - Boat, RV, van, etc. (%)
House/condo owner moved in on average (years ago)
Renter moved in on average (years ago)
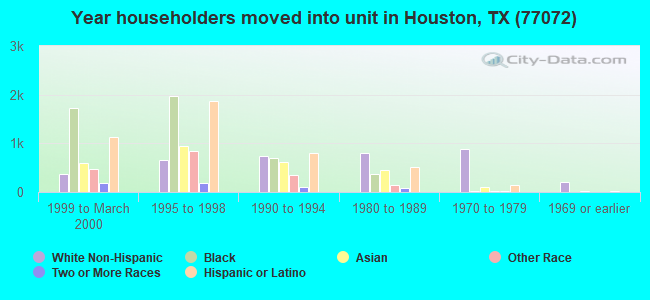
Year householder moved into unit - Moved in 1999 to March 2000 (%)
Year householder moved into unit - Moved in 1995 to 1998 (%)
Year householder moved into unit - Moved in 1990 to 1994 (%)
Year householder moved into unit - Moved in 1980 to 1989 (%)
Year householder moved into unit - Moved in 1970 to 1979 (%)
Year householder moved into unit - Moved in 1969 or earlier (%)
Means of transportation to work - Drove car alone (%)
Means of transportation to work - Carpooled (%)
Means of transportation to work - Public transportation (%)
Means of transportation to work - Bus or trolley bus (%)
Means of transportation to work - Streetcar or trolley car (%)
Means of transportation to work - Subway or elevated (%)
Means of transportation to work - Railroad (%)
Means of transportation to work - Ferryboat (%)
Means of transportation to work - Taxicab (%)
Means of transportation to work - Motorcycle (%)
Means of transportation to work - Bicycle (%)
Means of transportation to work - Walked (%)
Means of transportation to work - Other means (%)
Working at home (%)
Industry diversity
Most Common Industries - Agriculture, forestry, fishing and hunting, and mining (%)
Most Common Industries - Agriculture, forestry, fishing and hunting (%)
Most Common Industries - Mining, quarrying, and oil and gas extraction (%)
Most Common Industries - Construction (%)
Most Common Industries - Manufacturing (%)
Most Common Industries - Wholesale trade (%)
Most Common Industries - Retail trade (%)
Most Common Industries - Transportation and warehousing, and utilities (%)
Most Common Industries - Transportation and warehousing (%)
Most Common Industries - Utilities (%)
Most Common Industries - Information (%)
Most Common Industries - Finance and insurance, and real estate and rental and leasing (%)
Most Common Industries - Finance and insurance (%)
Most Common Industries - Real estate and rental and leasing (%)
Most Common Industries - Professional, scientific, and management, and administrative and waste management services (%)
Most Common Industries - Professional, scientific, and technical services (%)
Most Common Industries - Management of companies and enterprises (%)
Most Common Industries - Administrative and support and waste management services (%)
Most Common Industries - Educational services, and health care and social assistance (%)
Most Common Industries - Educational services (%)
Most Common Industries - Health care and social assistance (%)
Most Common Industries - Arts, entertainment, and recreation, and accommodation and food services (%)
Most Common Industries - Arts, entertainment, and recreation (%)
Most Common Industries - Accommodation and food services (%)
Most Common Industries - Other services, except public administration (%)
Most Common Industries - Public administration (%)
Occupation diversity
Most Common Occupations - Management, business, science, and arts occupations (%)
Most Common Occupations - Management, business, and financial occupations (%)
Most Common Occupations - Management occupations (%)
Most Common Occupations - Business and financial operations occupations (%)
Most Common Occupations - Computer, engineering, and science occupations (%)
Most Common Occupations - Computer and mathematical occupations (%)
Most Common Occupations - Architecture and engineering occupations (%)
Most Common Occupations - Life, physical, and social science occupations (%)
Most Common Occupations - Education, legal, community service, arts, and media occupations (%)
Most Common Occupations - Community and social service occupations (%)
Most Common Occupations - Legal occupations (%)
Most Common Occupations - Education, training, and library occupations (%)
Most Common Occupations - Arts, design, entertainment, sports, and media occupations (%)
Most Common Occupations - Healthcare practitioners and technical occupations (%)
Most Common Occupations - Health diagnosing and treating practitioners and other technical occupations (%)
Most Common Occupations - Health technologists and technicians (%)
Most Common Occupations - Service occupations (%)
Most Common Occupations - Healthcare support occupations (%)
Most Common Occupations - Protective service occupations (%)
Most Common Occupations - Fire fighting and prevention, and other protective service workers including supervisors (%)
Most Common Occupations - Law enforcement workers including supervisors (%)
Most Common Occupations - Food preparation and serving related occupations (%)
Most Common Occupations - Building and grounds cleaning and maintenance occupations (%)
Most Common Occupations - Personal care and service occupations (%)
Most Common Occupations - Sales and office occupations (%)
Most Common Occupations - Sales and related occupations (%)
Most Common Occupations - Office and administrative support occupations (%)
Most Common Occupations - Natural resources, construction, and maintenance occupations (%)
Most Common Occupations - Farming, fishing, and forestry occupations (%)
Most Common Occupations - Construction and extraction occupations (%)
Most Common Occupations - Installation, maintenance, and repair occupations (%)
Most Common Occupations - Production, transportation, and material moving occupations (%)
Most Common Occupations - Production occupations (%)
Most Common Occupations - Transportation occupations (%)
Most Common Occupations - Material moving occupations (%)
People in Group quarters - Institutionalized population (%)
People in Group quarters - Correctional institutions (%)
People in Group quarters - Federal prisons and detention centers (%)
People in Group quarters - Halfway houses (%)
People in Group quarters - Local jails and other confinement facilities (including police lockups) (%)
People in Group quarters - Military disciplinary barracks (%)
People in Group quarters - State prisons (%)
People in Group quarters - Other types of correctional institutions (%)
People in Group quarters - Nursing homes (%)
People in Group quarters - Hospitals/wards, hospices, and schools for the handicapped (%)
People in Group quarters - Hospitals/wards and hospices for chronically ill (%)
People in Group quarters - Hospices or homes for chronically ill (%)
People in Group quarters - Military hospitals or wards for chronically ill (%)
People in Group quarters - Other hospitals or wards for chronically ill (%)
People in Group quarters - Hospitals or wards for drug/alcohol abuse (%)
People in Group quarters - Mental (Psychiatric) hospitals or wards (%)
People in Group quarters - Schools, hospitals, or wards for the mentally retarded (%)
People in Group quarters - Schools, hospitals, or wards for the physically handicapped (%)
People in Group quarters - Institutions for the deaf (%)
People in Group quarters - Institutions for the blind (%)
People in Group quarters - Orthopedic wards and institutions for the physically handicapped (%)
People in Group quarters - Wards in general hospitals for patients who have no usual home elsewhere (%)
People in Group quarters - Wards in military hospitals for patients who have no usual home elsewhere (%)
People in Group quarters - Juvenile institutions (%)
People in Group quarters - Long-term care (%)
People in Group quarters - Homes for abused, dependent, and neglected children (%)
People in Group quarters - Residential treatment centers for emotionally disturbed children (%)
People in Group quarters - Training schools for juvenile delinquents (%)
People in Group quarters - Short-term care, detention or diagnostic centers for delinquent children (%)
People in Group quarters - Type of juvenile institution unknown (%)
People in Group quarters - Noninstitutionalized population (%)
People in Group quarters - College dormitories (includes college quarters off campus) (%)
People in Group quarters - Military quarters (%)
People in Group quarters - On base (%)
People in Group quarters - Barracks, unaccompanied personnel housing (UPH), (Enlisted/Officer), ;and similar group living quarters for military personnel (%)
People in Group quarters - Transient quarters for temporary residents (%)
People in Group quarters - Military ships (%)
People in Group quarters - Group homes (%)
People in Group quarters - Homes or halfway houses for drug/alcohol abuse (%)
People in Group quarters - Homes for the mentally ill (%)
People in Group quarters - Homes for the mentally retarded (%)
People in Group quarters - Homes for the physically handicapped (%)
People in Group quarters - Other group homes (%)
People in Group quarters - Religious group quarters (%)
People in Group quarters - Dormitories (%)
People in Group quarters - Agriculture workers' dormitories on farms (%)
People in Group quarters - Job Corps and vocational training facilities (%)
People in Group quarters - Other workers' dormitories (%)
People in Group quarters - Crews of maritime vessels (%)
People in Group quarters - Other nonhousehold living situations (%)
People in Group quarters - Other noninstitutional group quarters (%)
Residents speaking English at home (%)
Residents speaking English at home - Born in the United States (%)
Residents speaking English at home - Native, born elsewhere (%)
Residents speaking English at home - Foreign born (%)
Residents speaking Spanish at home (%)
Residents speaking Spanish at home - Born in the United States (%)
Residents speaking Spanish at home - Native, born elsewhere (%)
Residents speaking Spanish at home - Foreign born (%)
Residents speaking other language at home (%)
Residents speaking other language at home - Born in the United States (%)
Residents speaking other language at home - Native, born elsewhere (%)
Residents speaking other language at home - Foreign born (%)
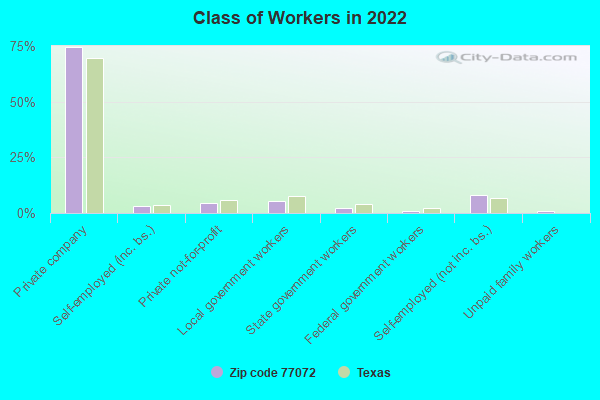
Class of Workers - Employee of private company (%)
Class of Workers - Self-employed in own incorporated business (%)
Class of Workers - Private not-for-profit wage and salary workers (%)
Class of Workers - Local government workers (%)
Class of Workers - State government workers (%)
Class of Workers - Federal government workers (%)
Class of Workers - Self-employed workers in own not incorporated business and Unpaid family workers (%)
House heating fuel used in houses and condos - Utility gas (%)
House heating fuel used in houses and condos - Bottled, tank, or LP gas (%)
House heating fuel used in houses and condos - Electricity (%)
House heating fuel used in houses and condos - Fuel oil, kerosene, etc. (%)
House heating fuel used in houses and condos - Coal or coke (%)
House heating fuel used in houses and condos - Wood (%)
House heating fuel used in houses and condos - Solar energy (%)
House heating fuel used in houses and condos - Other fuel (%)
House heating fuel used in houses and condos - No fuel used (%)
House heating fuel used in apartments - Utility gas (%)
House heating fuel used in apartments - Bottled, tank, or LP gas (%)
House heating fuel used in apartments - Electricity (%)
House heating fuel used in apartments - Fuel oil, kerosene, etc. (%)
House heating fuel used in apartments - Coal or coke (%)
House heating fuel used in apartments - Wood (%)
House heating fuel used in apartments - Solar energy (%)
House heating fuel used in apartments - Other fuel (%)
House heating fuel used in apartments - No fuel used (%)
Armed forces status - In Armed Forces (%)
Armed forces status - Civilian (%)
Armed forces status - Civilian - Veteran (%)
Armed forces status - Civilian - Nonveteran (%)
Fatal accidents locations in years 2005-2021
Fatal accidents locations in 2005
Fatal accidents locations in 2006
Fatal accidents locations in 2007
Fatal accidents locations in 2008
Fatal accidents locations in 2009
Fatal accidents locations in 2010
Fatal accidents locations in 2011
Fatal accidents locations in 2012
Fatal accidents locations in 2013
Fatal accidents locations in 2014
Fatal accidents locations in 2015
Fatal accidents locations in 2016
Fatal accidents locations in 2017
Fatal accidents locations in 2018
Fatal accidents locations in 2019
Fatal accidents locations in 2020
Fatal accidents locations in 2021
Alcohol use - People drinking some alcohol every month (%)
Alcohol use - People not drinking at all (%)
Alcohol use - Average days/month drinking alcohol
Alcohol use - Average drinks/week
Alcohol use - Average days/year people drink much
Audiometry - Average condition of hearing (%)
Audiometry - People that can hear a whisper from across a quiet room (%)
Audiometry - People that can hear normal voice from across a quiet room (%)
Audiometry - Ears ringing, roaring, buzzing (%)
Audiometry - Had a job exposure to loud noise (%)
Audiometry - Had off-work exposure to loud noise (%)
Blood Pressure & Cholesterol - Has high blood pressure (%)
Blood Pressure & Cholesterol - Checking blood pressure at home (%)
Blood Pressure & Cholesterol - Frequently checking blood cholesterol (%)
Blood Pressure & Cholesterol - Has high cholesterol level (%)
Consumer Behavior - Money monthly spent on food at supermarket/grocery store
Consumer Behavior - Money monthly spent on food at other stores
Consumer Behavior - Money monthly spent on eating out
Consumer Behavior - Money monthly spent on carryout/delivered foods
Consumer Behavior - Income spent on food at supermarket/grocery store (%)
Consumer Behavior - Income spent on food at other stores (%)
Consumer Behavior - Income spent on eating out (%)
Consumer Behavior - Income spent on carryout/delivered foods (%)
Current Health Status - General health condition (%)
Current Health Status - Blood donors (%)
Current Health Status - Has blood ever tested for HIV virus (%)
Current Health Status - Left-handed people (%)
Dermatology - People using sunscreen (%)
Diabetes - Diabetics (%)
Diabetes - Had a blood test for high blood sugar (%)
Diabetes - People taking insulin (%)
Diet Behavior & Nutrition - Diet health (%)
Diet Behavior & Nutrition - Milk product consumption (# of products/month)
Diet Behavior & Nutrition - Meals not home prepared (#/week)
Diet Behavior & Nutrition - Meals from fast food or pizza place (#/week)
Diet Behavior & Nutrition - Ready-to-eat foods (#/month)
Diet Behavior & Nutrition - Frozen meals/pizza (#/month)
Drug Use - People that ever used marijuana or hashish (%)
Drug Use - Ever used hard drugs (%)
Drug Use - Ever used any form of cocaine (%)
Drug Use - Ever used heroin (%)
Drug Use - Ever used methamphetamine (%)
Health Insurance - People covered by health insurance (%)
Kidney Conditions-Urology - Avg. # of times urinating at night
Medical Conditions - People with asthma (%)
Medical Conditions - People with anemia (%)
Medical Conditions - People with psoriasis (%)
Medical Conditions - People with overweight (%)
Medical Conditions - Elderly people having difficulties in thinking or remembering (%)
Medical Conditions - People who ever received blood transfusion (%)
Medical Conditions - People having trouble seeing even with glass/contacts (%)
Medical Conditions - People with arthritis (%)
Medical Conditions - People with gout (%)
Medical Conditions - People with congestive heart failure (%)
Medical Conditions - People with coronary heart disease (%)
Medical Conditions - People with angina pectoris (%)
Medical Conditions - People who ever had heart attack (%)
Medical Conditions - People who ever had stroke (%)
Medical Conditions - People with emphysema (%)
Medical Conditions - People with thyroid problem (%)
Medical Conditions - People with chronic bronchitis (%)
Medical Conditions - People with any liver condition (%)
Medical Conditions - People who ever had cancer or malignancy (%)
Mental Health - People who have little interest in doing things (%)
Mental Health - People feeling down, depressed, or hopeless (%)
Mental Health - People who have trouble sleeping or sleeping too much (%)
Mental Health - People feeling tired or having little energy (%)
Mental Health - People with poor appetite or overeating (%)
Mental Health - People feeling bad about themself (%)
Mental Health - People who have trouble concentrating on things (%)
Mental Health - People moving or speaking slowly or too fast (%)
Mental Health - People having thoughts they would be better off dead (%)
Oral Health - Average years since last visit a dentist
Oral Health - People embarrassed because of mouth (%)
Oral Health - People with gum disease (%)
Oral Health - General health of teeth and gums (%)
Oral Health - Average days a week using dental floss/device
Oral Health - Average days a week using mouthwash for dental problem
Oral Health - Average number of teeth
Pesticide Use - Households using pesticides to control insects (%)
Pesticide Use - Households using pesticides to kill weeds (%)
Physical Activity - People doing vigorous-intensity work activities (%)
Physical Activity - People doing moderate-intensity work activities (%)
Physical Activity - People walking or bicycling (%)
Physical Activity - People doing vigorous-intensity recreational activities (%)
Physical Activity - People doing moderate-intensity recreational activities (%)
Physical Activity - Average hours a day doing sedentary activities
Physical Activity - Average hours a day watching TV or videos
Physical Activity - Average hours a day using computer
Physical Functioning - People having limitations keeping them from working (%)
Physical Functioning - People limited in amount of work they can do (%)
Physical Functioning - People that need special equipment to walk (%)
Physical Functioning - People experiencing confusion/memory problems (%)
Physical Functioning - People requiring special healthcare equipment (%)
Prescription Medications - Average number of prescription medicines taking
Preventive Aspirin Use - Adults 40+ taking low-dose aspirin (%)
Reproductive Health - Vaginal deliveries (%)
Reproductive Health - Cesarean deliveries (%)
Reproductive Health - Deliveries resulted in a live birth (%)
Reproductive Health - Pregnancies resulted in a delivery (%)
Reproductive Health - Women breastfeeding newborns (%)
Reproductive Health - Women that had a hysterectomy (%)
Reproductive Health - Women that had both ovaries removed (%)
Reproductive Health - Women that have ever taken birth control pills (%)
Reproductive Health - Women taking birth control pills (%)
Reproductive Health - Women that have ever used Depo-Provera or injectables (%)
Reproductive Health - Women that have ever used female hormones (%)
Sexual Behavior - People 18+ that ever had sex (vaginal, anal, or oral) (%)
Sexual Behavior - Males 18+ that ever had vaginal sex with a woman (%)
Sexual Behavior - Males 18+ that ever performed oral sex on a woman (%)
Sexual Behavior - Males 18+ that ever had anal sex with a woman (%)
Sexual Behavior - Males 18+ that ever had any sex with a man (%)
Sexual Behavior - Females 18+ that ever had vaginal sex with a man (%)
Sexual Behavior - Females 18+ that ever performed oral sex on a man (%)
Sexual Behavior - Females 18+ that ever had anal sex with a man (%)
Sexual Behavior - Females 18+ that ever had any kind of sex with a woman (%)
Sexual Behavior - Average age people first had sex
Sexual Behavior - Average number of female sex partners in lifetime (males 18+)
Sexual Behavior - Average number of female vaginal sex partners in lifetime (males 18+)
Sexual Behavior - Average age people first performed oral sex on a woman (18+)
Sexual Behavior - Average number of woman performed oral sex on in lifetime (18+)
Sexual Behavior - Average number of male sex partners in lifetime (males 18+)
Sexual Behavior - Average number of male anal sex partners in lifetime (males 18+)
Sexual Behavior - Average age people first performed oral sex on a man (18+)
Sexual Behavior - Average number of male oral sex partners in lifetime (18+)
Sexual Behavior - People using protection when performing oral sex (%)
Sexual Behavior - Average number of times people have vaginal or anal sex a year
Sexual Behavior - People having sex without condom (%)
Sexual Behavior - Average number of male sex partners in lifetime (females 18+)
Sexual Behavior - Average number of male vaginal sex partners in lifetime (females 18+)
Sexual Behavior - Average number of female sex partners in lifetime (females 18+)
Sexual Behavior - Circumcised males 18+ (%)
Sleep Disorders - Average hours sleeping at night
Sleep Disorders - People that has trouble sleeping (%)
Smoking-Cigarette Use - People smoking cigarettes (%)
Taste & Smell - People 40+ having problems with smell (%)
Taste & Smell - People 40+ having problems with taste (%)
Taste & Smell - People 40+ that ever had wisdom teeth removed (%)
Taste & Smell - People 40+ that ever had tonsils teeth removed (%)
Taste & Smell - People 40+ that ever had a loss of consciousness because of a head injury (%)
Taste & Smell - People 40+ that ever had a broken nose or other serious injury to face or skull (%)
Taste & Smell - People 40+ that ever had two or more sinus infections (%)
Weight - Average height (inches)
Weight - Average weight (pounds)
Weight - Average BMI
Weight - People that are obese (%)
Weight - People that ever were obese (%)
Weight - People trying to lose weight (%)
100%
urban population.
Estimated median house/condo value in 2022: $187,573
77072:
$187,573Texas:
$275,400
According to our research of Texas and other state lists, there were 84 registered sex offenders living in 77072 zip code as of June 08, 2024 . The ratio of all residents to sex offenders in zip code 77072 is 741 to 1.The ratio of registered sex offenders to all residents in this zip code is lower than the state average.
Median resident age: This zip code:
34.8 yearsTexas median age:
35.6 years
Average household size: This zip code:
3.2 peopleTexas:
2.6 people
Averages for the 2020 tax year for zip code 77072, filed in 2021:
Average Adjusted Gross Income (AGI) in 2020: $30,977 (Individual Income Tax Returns) Here:
$30,977State:
$77,054
Salary/wage: $30,619 (reported on 76.5% of returns )Here:
$30,619State:
$62,766
(% of AGI for various income ranges: 1119.7% for AGIs below $25k , 3538.7% for AGIs $25k-50k , 6745.6% for AGIs $50k-75k , 10002.3% for AGIs $75k-100k , 15718.9% for AGIs $100k-200k , 85905.0% for AGIs over 200k ) Taxable interest for individuals: $918 (reported on 9.2% of returns )This zip code:
$918Texas:
$2,665
(% of AGI for various income ranges: 5.0% for AGIs below $25k , 5.2% for AGIs $25k-50k , 13.7% for AGIs $50k-75k , 42.9% for AGIs $75k-100k , 106.3% for AGIs $100k-200k , 2130.0% for AGIs over 200k ) Ordinary dividends: $3,578 (reported on 4.7% of returns )(% of AGI for various income ranges: 3.1% for AGIs below $25k , 6.2% for AGIs $25k-50k , 29.5% for AGIs $50k-75k , 70.4% for AGIs $75k-100k , 302.9% for AGIs $100k-200k , 7265.0% for AGIs over 200k ) Net capital gain/loss in AGI: +$6,412 (reported on 5.3% of returns )Here:
+$6,412State:
+$39,590
(% of AGI for various income ranges: 1.7% for AGIs below $25k , 12.7% for AGIs $25k-50k , 50.8% for AGIs $50k-75k , 130.4% for AGIs $75k-100k , 481.7% for AGIs $100k-200k , 20975.0% for AGIs over 200k ) Profit/loss from business: +$8,000 (reported on 34.0% of returns )Here:
+$8,000State:
+$10,888
(% of AGI for various income ranges: 396.2% for AGIs below $25k , 281.6% for AGIs $25k-50k , 303.5% for AGIs $50k-75k , 368.9% for AGIs $75k-100k , 865.4% for AGIs $100k-200k , 7520.0% for AGIs over 200k ) Taxable individual retirement arrangement distribution: $14,333 (reported on 2.3% of returns )77072:
$14,333Texas:
$24,740
(% of AGI for various income ranges: 13.2% for AGIs below $25k , 21.7% for AGIs $25k-50k , 74.7% for AGIs $50k-75k , 206.4% for AGIs $75k-100k , 852.6% for AGIs $100k-200k ) Total itemized deductions: $27,877 (reported on 2.1% of returns )Here:
$27,877State:
$40,428
(% of AGI for various income ranges: 12.9% for AGIs below $25k , 72.1% for AGIs $25k-50k , 216.9% for AGIs $50k-75k , 291.2% for AGIs $75k-100k , 526.3% for AGIs $100k-200k , 5935.0% for AGIs over 200k ) Charity contributions: $11,724 (reported on 1.5% of returns )Here:
$11,724State:
$18,201
(% of AGI for various income ranges: 2.3% for AGIs below $25k , 17.1% for AGIs $25k-50k , 63.2% for AGIs $50k-75k , 100.0% for AGIs $75k-100k , 404.0% for AGIs $100k-200k ) Taxes paid: $5,378 (reported on 1.8% of returns )(% of AGI for various income ranges: 2.3% for AGIs below $25k , 11.1% for AGIs $25k-50k , 37.9% for AGIs $50k-75k , 50.5% for AGIs $75k-100k , 143.4% for AGIs $100k-200k ) Earned income credit: $2,571 (reported on 32.9% of returns )(% of AGI for various income ranges: 154.2% for AGIs below $25k , 101.0% for AGIs $25k-50k , 2.0% for AGIs $50k-75k ) Percentage of individuals using paid preparers for their 2020 taxes: 88.3%(% for various income ranges: 86.5% for AGIs below $25k , 90.6% for AGIs $25k-50k , 89.8% for AGIs $50k-75k , 90.1% for AGIs $75k-100k , 86.7% for AGIs $100k-200k , 88.9% for AGIs over 200k )
Averages for the 2012 tax year for zip code 77072, filed in 2013:
Average Adjusted Gross Income (AGI) in 2012: $28,304 (Individual Income Tax Returns) Here:
$28,304State:
$65,384
Salary/wage: $28,645 (reported on 82.2% of returns )Here:
$28,645State:
$52,524
(% of AGI for various income ranges: 74.3% for AGIs below $25k , 90.1% for AGIs $25k-50k , 89.1% for AGIs $50k-75k , 84.0% for AGIs $75k-100k , 81.3% for AGIs $100k-200k , 65.7% for AGIs over 200k ) Taxable interest for individuals: $706 (reported on 9.8% of returns )This zip code:
$706Texas:
$2,372
(% of AGI for various income ranges: 0.2% for AGIs below $25k , 0.2% for AGIs $25k-50k , 0.2% for AGIs $50k-75k , 0.3% for AGIs $75k-100k , 0.4% for AGIs $100k-200k , 0.9% for AGIs over 200k ) Ordinary dividends: $3,696 (reported on 4.7% of returns )(% of AGI for various income ranges: 0.6% for AGIs below $25k , 0.4% for AGIs $25k-50k , 0.3% for AGIs $50k-75k , 0.5% for AGIs $75k-100k , 1.3% for AGIs $100k-200k , 1.9% for AGIs over 200k ) Net capital gain/loss in AGI: +$1,884 (reported on 3.4% of returns )Here:
+$1,884State:
+$35,319
(% of AGI for various income ranges: 0.4% for AGIs $75k-100k , 0.9% for AGIs $100k-200k , 2.4% for AGIs over 200k ) Profit/loss from business: +$9,130 (reported on 28.9% of returns )Here:
+$9,130State:
+$13,732
(% of AGI for various income ranges: 22.2% for AGIs below $25k , 5.2% for AGIs $25k-50k , 3.0% for AGIs $50k-75k , 3.8% for AGIs $75k-100k , 6.4% for AGIs $100k-200k ) Taxable individual retirement arrangement distribution: $11,844 (reported on 2.6% of returns )77072:
$11,844Texas:
$19,511
(% of AGI for various income ranges: 0.7% for AGIs below $25k , 0.7% for AGIs $25k-50k , 1.3% for AGIs $50k-75k , 2.0% for AGIs $75k-100k , 2.8% for AGIs $100k-200k ) Self-employment retirement plans: $19,850 (reported on 0.1% of returns )77072:
$19,850Texas:
$23,938
Total itemized deductions: $16,567 (30% of AGI, reported on 9.8% of returns )Here:
$16,567State:
$24,724
Here:
30.0% of AGIState:
15.9% of AGI
(% of AGI for various income ranges: 3.0% for AGIs below $25k , 6.4% for AGIs $25k-50k , 8.3% for AGIs $50k-75k , 7.2% for AGIs $75k-100k , 6.0% for AGIs $100k-200k , 4.4% for AGIs over 200k ) Charity contributions: $3,759 (reported on 6.7% of returns )(% of AGI for various income ranges: 0.3% for AGIs below $25k , 0.8% for AGIs $25k-50k , 1.3% for AGIs $50k-75k , 1.3% for AGIs $75k-100k , 1.9% for AGIs $100k-200k , 1.1% for AGIs over 200k ) Taxes paid: $3,222 (reported on 9.2% of returns )(% of AGI for various income ranges: 0.5% for AGIs below $25k , 1.0% for AGIs $25k-50k , 1.5% for AGIs $50k-75k , 1.5% for AGIs $75k-100k , 1.3% for AGIs $100k-200k , 1.4% for AGIs over 200k ) Earned income credit: $2,744 (reported on 40.0% of returns )(% of AGI for various income ranges: 11.5% for AGIs below $25k , 2.0% for AGIs $25k-50k ) Percentage of individuals using paid preparers for their 2012 taxes: 64.4%(% for various income ranges: 65.3% for AGIs below $25k , 64.9% for AGIs $25k-50k , 60.5% for AGIs $50k-75k , 56.3% for AGIs $75k-100k , 52.3% for AGIs $100k-200k , 85.7% for AGIs over 200k )
Averages for the 2004 tax year for zip code 77072, filed in 2005:
Average Adjusted Gross Income (AGI) in 2004: $24,770 (Individual Income Tax Returns) Here:
$24,770State:
$47,881
Salary/wage: $25,360 (reported on 86.5% of returns )Here:
$25,360State:
$41,947
(% of AGI for various income ranges: 93.5% for AGIs below $10k , 85.7% for AGIs $10k-25k , 92.9% for AGIs $25k-50k , 90.0% for AGIs $50k-75k , 83.8% for AGIs $75k-100k , 76.8% for AGIs over 100k ) Taxable interest for individuals: $739 (reported on 17.7% of returns )This zip code:
$739Texas:
$2,255
(% of AGI for various income ranges: 1.3% for AGIs below $10k , 0.4% for AGIs $10k-25k , 0.4% for AGIs $25k-50k , 0.5% for AGIs $50k-75k , 0.9% for AGIs $75k-100k , 1.0% for AGIs over 100k ) Taxable dividends: $1,269 (reported on 6.3% of returns )(% of AGI for various income ranges: 0.4% for AGIs below $10k , 0.2% for AGIs $10k-25k , 0.2% for AGIs $25k-50k , 0.3% for AGIs $50k-75k , 0.8% for AGIs $75k-100k , 1.0% for AGIs over 100k ) Net capital gain/loss: +$1,263 (reported on 5.0% of returns )Here:
+$1,263State:
+$16,110
(% of AGI for various income ranges: -0.4% for AGIs below $10k , -0.0% for AGIs $10k-25k , 0.1% for AGIs $25k-50k , 0.4% for AGIs $50k-75k , 1.1% for AGIs $75k-100k , 1.3% for AGIs over 100k ) Profit/loss from business: +$6,710 (reported on 22.8% of returns )Here:
+$6,710State:
+$11,013
(% of AGI for various income ranges: 26.6% for AGIs below $10k , 11.3% for AGIs $10k-25k , 3.2% for AGIs $25k-50k , 2.2% for AGIs $50k-75k , 2.8% for AGIs $75k-100k , 3.6% for AGIs over 100k ) IRA payment deduction: $3,214 (reported on 1.5% of returns )(% of AGI for various income ranges: 0.2% for AGIs below $10k , 0.1% for AGIs $10k-25k , 0.3% for AGIs $25k-50k , 0.2% for AGIs $50k-75k , 0.3% for AGIs $75k-100k , 0.2% for AGIs over 100k ) Self-employed pension: $9,357 (reported on 0.1% of returns )Total itemized deductions: $13,494 (29% of AGI, reported on 12.1% of returns )Here:
$13,494State:
$19,631
Here:
29.4% of AGIState:
18.9% of AGI
(% of AGI for various income ranges: 3.7% for AGIs below $10k , 4.2% for AGIs $10k-25k , 7.3% for AGIs $25k-50k , 9.1% for AGIs $50k-75k , 6.7% for AGIs $75k-100k , 7.6% for AGIs over 100k ) Charity contributions deductions: $3,011 (6% of AGI, reported on 8.8% of returns )Here:
6.0% of AGIState:
4.2% of AGI
(% of AGI for various income ranges: 0.2% for AGIs below $10k , 0.4% for AGIs $10k-25k , 1.0% for AGIs $25k-50k , 1.7% for AGIs $50k-75k , 1.5% for AGIs $75k-100k , 2.0% for AGIs over 100k ) Total tax: $2,888 (reported on 59.9% of returns )(% of AGI for various income ranges: 5.9% for AGIs below $10k , 3.6% for AGIs $10k-25k , 5.2% for AGIs $25k-50k , 9.0% for AGIs $50k-75k , 12.2% for AGIs $75k-100k , 17.8% for AGIs over 100k ) Earned income credit: $2,101 (reported on 39.6% of returns )Percentage of individuals using paid preparers for their 2004 taxes: 66.9%(% for various income ranges: 65.4% for AGIs below $10k , 72.6% for AGIs $10k-25k , 64.9% for AGIs $25k-50k , 56.7% for AGIs $50k-75k , 45.4% for AGIs $75k-100k , 53.4% for AGIs over 100k )
Estimated median household income in 2022: This zip code:
$50,363Texas:
$72,284
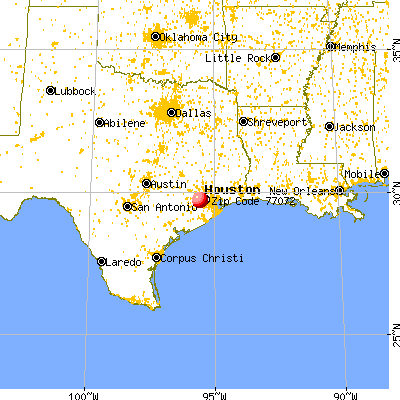
Nearest zip codes: 77099 ,
77042 ,
77036 ,
77077 ,
77082 ,
77031 .
Houston Zip Code Map
Percentage of family households: This zip code:
55.2%Texas:
50.5%
Percentage of households with unmarried partners: This zip code:
5.3%Texas:
48.7%
Likely homosexual households (counted as self-reported same-sex unmarried-partner households)
Lesbian couples: 0.2% of all households Gay men: 0.0% of all households
Household received Food Stamps/SNAP in the past 12 months: 5,157Household did not receive Food Stamps/SNAP in the past 12 months: 14,949
Women who had a birth in the past 12 months: 809 (381 now married , 417 unmarried) Women who did not have a birth in the past 12 months: 15,791 (5,233 now married , 10,612 unmarried)
Housing units in zip code 77072 with a mortgage: 3,797 (66
second mortgage , 41
both second mortgage and home equity loan )
Houses without a mortgage: 18
Median monthly owner costs for units with a mortgage: $1,448
Median monthly owner costs for units without a mortgage: $501
Residents with income below the poverty level in 2022:
This zip code:
21.5%Whole state:
14.0%
Residents with income below 50% of the poverty level in 2022:
This zip code:
13.0%Whole state:
7.4%
Median number of rooms in houses and condos: Median number of rooms in apartments: Notable locations in this zip code not listed on our city pages
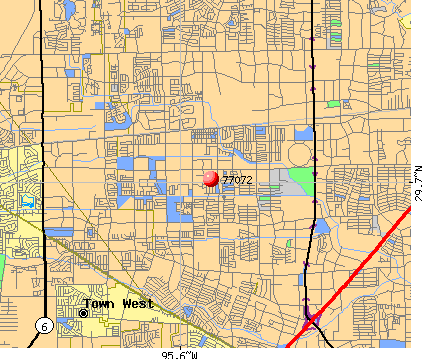
Click to draw/clear zip code borders Notable locations in zip code 77072: (A) , Community Volunteer Fire Department Station 2 (B) , Quillian Memorial Center (C) . Display/hide their locations on the map
Shopping Center: (1) . Display/hide its location on the map
Churches in zip code 77072 include: (A) , Alief Baptist Church (B) , Canterbury United Methodist Church (C) , Chinese Lutheran Church (D) , Christ the Lord Lutheran Church (E) , First Filipino American United Methodist Church and Community Center (F) , First Southwest Baptist Church (G) , Texas Buddhist Association (H) , Thien An Presbyterian Church (I) . Display/hide their locations on the map
Cemetery: (1) . Display/hide its location on the map
Parks in zip code 77072 include: (1) , Hastings High School Baseball Field (2) . Display/hide their locations on the map
Tourist attraction (not listed on the city page) :
Year house built (houses)
28 2020 or later241 2010 to 20192,012 2000 to 20091,144 1990 to 19995,652 1980 to 19897,311 1970 to 19792,802 1960 to 1969412 1950 to 1959234 1940 to 194962 1939 or earlier
Zip code 77072 household income distribution in 2022 1,521 Less than $10,0001,238 $10,000 to $14,999727 $15,000 to $19,9991,057 $20,000 to $24,9991,184 $25,000 to $29,999967 $30,000 to $34,9991,444 $35,000 to $39,9991,029 $40,000 to $44,999605 $45,000 to $49,9992,385 $50,000 to $59,9992,361 $60,000 to $74,9992,452 $75,000 to $99,999954 $100,000 to $124,999896 $125,000 to $149,999578 $150,000 to $199,999646 $200,000 or moreEstimate of home value of owner-occupied houses/condos in 2022 in zip code 77072 128 Less than $10,00073 $10,000 to $14,99953 $15,000 to $19,9999 $20,000 to $24,99938 $25,000 to $29,99941 $30,000 to $34,99957 $35,000 to $39,99925 $40,000 to $49,999103 $50,000 to $59,999163 $60,000 to $69,999269 $70,000 to $79,999325 $80,000 to $89,999197 $90,000 to $99,999750 $100,000 to $124,999678 $125,000 to $149,9991,453 $150,000 to $174,9991,374 $175,000 to $199,9991,253 $200,000 to $249,999353 $250,000 to $299,999161 $300,000 to $399,9998 $400,000 to $499,99912 $500,000 to $749,99940 $750,000 to $999,99944 $1,000,000 to $1,499,9992 $1,500,000 to $1,999,999Rent paid by renters in 2022 in zip code 77072 99 $100 to $14923 $150 to $19937 $200 to $24985 $250 to $29915 $350 to $39931 $400 to $44920 $450 to $499120 $500 to $549127 $550 to $599217 $600 to $649228 $650 to $699490 $700 to $749566 $750 to $7991,459 $800 to $8991,435 $900 to $9992,939 $1,000 to $1,2491,528 $1,250 to $1,499727 $1,500 to $1,99964 $2,000 to $2,49929 $3,500 or more376 No cash rent
Median gross rent in 2022: $1,211.
Median price asked for vacant for-sale houses and condos in 2022: $175,909.
Estimated median house (or condo) value in 2022 for: White Non-Hispanic householders: $182,081Black or African American householders: $199,711American Indian or Alaska Native householders: $182,370Asian householders: $183,237Native Hawaiian and other Pacific Islander householders: $158,960Some other race householders: $202,312Two or more races householders: $201,156Hispanic or Latino householders: $195,376Estimated median house or condo value in 2022: $187,573
77072:
$187,573Texas:
$275,400
Lower value quartile - upper value quartile: $133,426 - $223,408
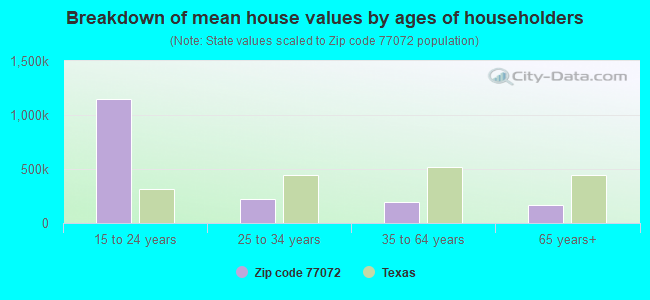
Mean price in 2022: Detached houses: $205,231Here:
$205,231State:
$369,058
Townhouses or other attached units: $129,032Here:
$129,032State:
$327,631
In 2-unit structures: $454,027Here:
$454,027State:
$374,947
In 3-to-4-unit structures: $351,601Here:
$351,601State:
$209,652
In 5-or-more-unit structures: $93,890Here:
$93,890State:
$413,944
Mobile homes: $43,184Here:
$43,184State:
$124,413
Housing units in structures:
One, detached: 9,788One, attached: 2,649Two: 5123 or 4: 9615 to 9: 2,26110 to 19: 2,70520 to 49: 55250 or more: 1,638Mobile homes: 278Unemployment : 4.8%
Means of transportation to work in zip code 77072 66.9% 19,509 Drove a car alone14.7% 4,295 Carpooled5.1% 1,498 Bus or trolley bus0.2% 44 Taxi0.2% 67 Bicycle1.2% 350 Walked2.2% 639 Other means7.3% 2,128 Worked at homeTravel time to work (commute) in zip code 77072 214 Less than 5 minutes1,525 5 to 9 minutes1,812 10 to 14 minutes3,635 15 to 19 minutes3,566 20 to 24 minutes1,979 25 to 29 minutes6,413 30 to 34 minutes470 35 to 39 minutes1,447 40 to 44 minutes2,601 45 to 59 minutes2,273 60 to 89 minutes501 90 or more minutes
Percentage of zip code residents living and working in this county: 90.0%
Household type by relationship:
Households: 63,346
Male householders: 10,617 (1,952 living alone ), Female householders: 9,349 (1,764 living alone )8,606 spouses (8,584 opposite-sex spouses ), 1,969 unmarried partners , (1,941 opposite-sex unmarried partners ), 22,812 children (21,623 natural , 480 adopted , 707 stepchildren ), 1,360 grandchildren , 1,801 brothers or sisters , 1,782 parents , 33 foster children , 2,841 other relatives , 1,545 non-relatives In group quarters: 201 (-1 institutionalized population )
Size of family households: 4,188 2-persons , 3,788 3-persons , 3,052 4-persons , 2,507 5-persons , 1,108 6-persons , 566 7-or-more-persons
Size of nonfamily households: 3,716 1-person , 728 2-persons , 131 3-persons , 24 4-persons , 9 5-persons
6,853 married couples with children. single-parent households (2,814 men , 4,528 women ).
31.1% of residents of 77072 zip code speak English at home. of residents speak Spanish at home (52% very well, 21% well, 18% not well, 8% not at all ).of residents speak other Indo-European language at home (76% very well, 16% well, 6% not well, 1% not at all ).of residents speak Asian or Pacific Island language at home (24% very well, 31% well, 37% not well, 8% not at all ).of residents speak other language at home (82% very well, 12% well, 5% not well, 1% not at all ).
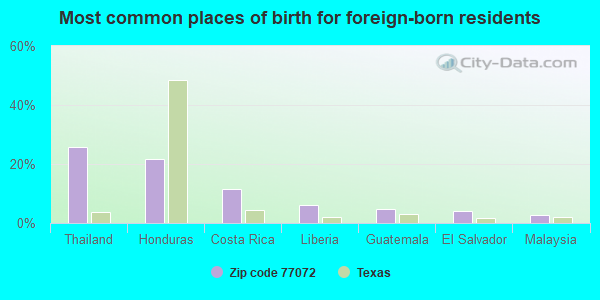
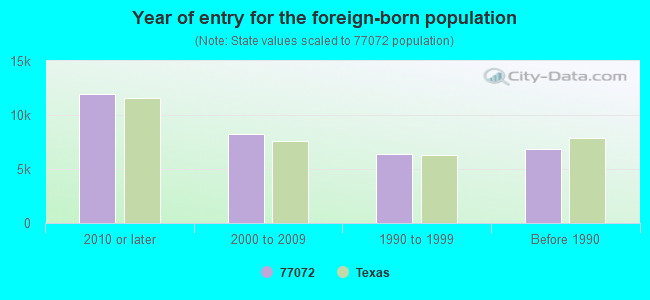
Foreign born population: 32,557 (51.4%)
(53.1%
of them are naturalized citizens )
This zip code:
51.4%Whole state:
17.2%
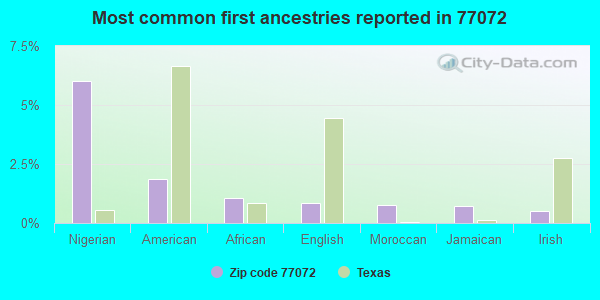
26% Thailand 22% Honduras 11% Costa Rica 6% Liberia 5% Guatemala 4% El Salvador 3% Malaysia 6% Nigerian 2% American 1% African 1% English 1% Moroccan 1% Jamaican 1% Irish
Year of entry for the foreign-born population
11,937 2010 or later 8,205 2000 to 2009 6,344 1990 to 1999 6,832 Before 1990
There are
117 Medical Specialists in Zip Code 77072 .
Facilities with environmental interests located in this zip code:
A J MARTIN ELEMENTARY SCHOOL (11718 HENDON LANE in HOUSTON, TX)
(Geographic Names Information System) (National Center for Education Statistics) - STATE ID-101903103 Organizations: ALIEF ISD (SCHOOL DISTRICT)
ADMIN SERVICES (12302 HIGH STAR in HOUSTON, TX)
(National Center for Education Statistics) - STATE ID-101903199 Organizations: ALIEF ISD (SCHOOL DISTRICT)
AFFORDABLE AUTO CARE (4608 BELLE PARK DR in HOUSTON, TX)
(Resource Conservation and Recovery Act (tracking hazardous waste))
AUTO PARTS REBUILDERS (6801 BANEWAY SUITE 4H in HOUSTON, TX)
(Resource Conservation and Recovery Act (tracking hazardous waste)) Business NAICS classification: ALL OTHER AUTOMOTIVE REPAIR AND MAINTENANCE.Organizations: GHAZALINADEEM (CONTACT/OPERATOR)
ACTIVE ENTERPRISES LLC (11311 BISSONNET in HOUSTON, TX)
Small Quantity Generators, between 100 kg and 1000 kg of hazardous waste/month (Resource Conservation and Recovery Act (tracking hazardous waste)) - notification Alternative names: SOUTHWEST CLEANERS
Housing units lacking complete plumbing facilities: 0.4%
Housing units lacking complete kitchen facilities: 1.7%
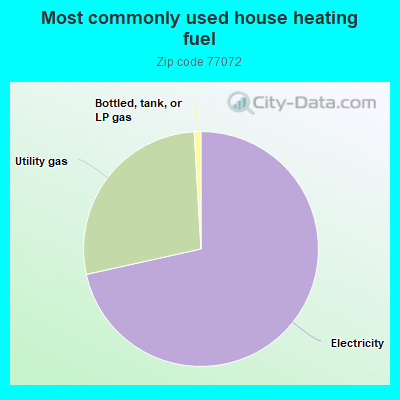
71.1% Electricity 27.4% Utility gas 0.9% Bottled, tank, or LP gas
Population in 1990: 41,808. Population change in the 1990s: +9,908 (+23.7%).
Place of birth for U.S.-born residents:
This state: 25,592Northeast: 698Midwest: 979South: 1,949West: 1,073
52% of the 77072 zip code residents lived in the same house 5 years ago.
Out of people who lived in different houses, 81% lived in this county.
Out of people who lived in different counties, 50% lived in Texas.
89% of the 77072 zip code residents lived in the same house 1 year ago.
Out of people who lived in different houses, 69% moved from this county.
Out of people who lived in different houses, 10% moved from different county within same state.
Out of people who lived in different houses, 10% moved from different state.
Out of people who lived in different houses, 9% moved from abroad.
Private vs. public school enrollment:
Students in private schools in grades 1 to 8 (elementary and middle school): 393
Students in private schools in grades 9 to 12 (high school): 68
Students in private undergraduate colleges: 903
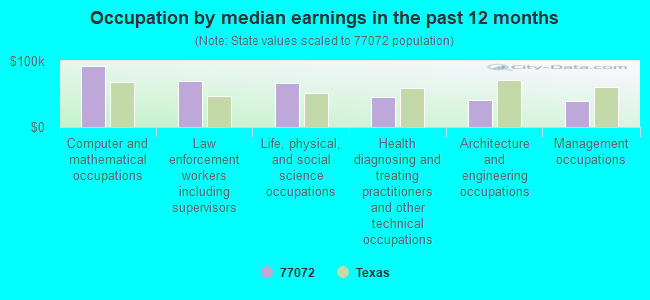
Occupation by median earnings in the past 12 months ($)
92,436 Computer and mathematical occupations 70,444 Law enforcement workers including supervisors 66,349 Life, physical, and social science occupations 44,881 Health diagnosing and treating practitioners and other technical occupations 41,461 Architecture and engineering occupations 39,890 Management occupations
Companies with federal contracts located in this zip code:
M-I LLC (5950 N COURSE DR in HOUSTON, TX) in 4 contracts from 2003 to 2006
$46,691 with Navy for Milling Machines. Signed on 2006-05-16. Completion date: 2006-08-10.
with Army for Maintenance, Repair and Rebuilding of Equipment -- Instruments and Laboratory Equipment. Signed on 2003-08-27. Completion date: 2003-12-18.
with Air Force for Foundry Machinery, Related Equipment and Supplies. Signed on 2004-11-17. Completion date: 2005-01-31.
with Army for Paints, Dopes, Varnishes, and Related Products. Signed on 2005-09-09. Completion date: 2005-09-23.
Top industries in this zip code by the number of employees in 2005:
Professional, Scientific, and Technical Services: Engineering Services (over 1000 employees: 1 establishment, 100-249 employees: 1 establishment, 20-49 employees: 1 establishment, 1-4 employees: 1 establishment)Construction: Industrial Building Construction (over 1000: 1)Management of Companies and Enterprises: Corporate, Subsidiary, and Regional Managing Offices (500-999: 1, 250-499: 1, 20-49: 1)Health Care and Social Assistance: Medical Laboratories (500-999: 1)Health Care and Social Assistance: General Medical and Surgical Hospitals (500-999: 1)Professional, Scientific, and Technical Services: Geophysical Surveying and Mapping Services (250-499: 1, 100-249: 1, 20-49: 1, 10-19: 1)Accommodation and Food Services: Limited-Service Restaurants (50-99: 2, 20-49: 5, 10-19: 5, 5-9: 5, 1-4: 19)Administrative and Support and Waste Management and Remediation Services: Collection Agencies (250-499: 1)Accommodation and Food Services: Full-Service Restaurants (50-99: 1, 20-49: 1, 10-19: 5, 5-9: 6, 1-4: 21)
People in group quarters in 2010:
120 people in nursing facilities/skilled-nursing facilities
11 people in workers' group living quarters and job corps centers
8 people in group homes intended for adults
People in group quarters in 2000:
127 people in nursing homes
111 people in other noninstitutional group quarters
33 people in homes for the mentally retarded
Fatal accident statistics in 2014:
Fatal accident count: 4Vehicles involved in fatal accidents: 7Fatal accidents caused by drunken drivers: 4Fatalities: 7Persons involved in fatal accidents: 16Pedestrians involved in fatal accidents: 0
Fatal accident statistics in 2013:
Fatal accident count: 1Vehicles involved in fatal accidents: 1Fatal accidents caused by drunken drivers: 0Fatalities: 1Persons involved in fatal accidents: 2Pedestrians involved in fatal accidents: 1
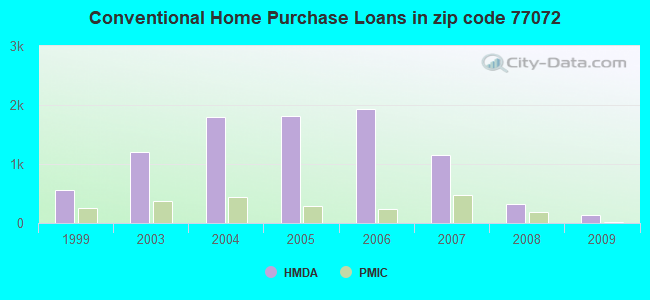
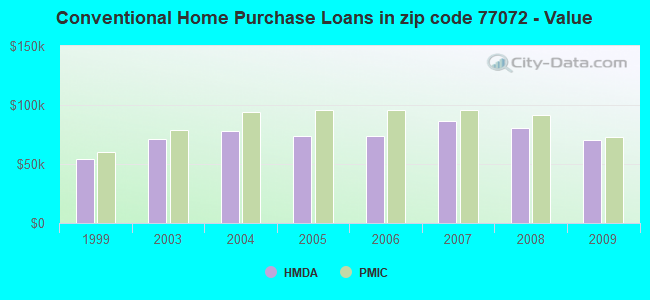
Home Mortgage Disclosure Act Aggregated Statistics For Year 2009(Based on 12 full and 6 partial tracts) A) FHA, FSA/RHS & VA B) Conventional C) Refinancings D) Home Improvement Loans E) Loans on Dwellings For 5+ Families F) Non-occupant Loans on Number Average Value Number Average Value Number Average Value Number Average Value Number Average Value Number Average Value
LOANS ORIGINATED 143 $84,900 131 $70,706 174 $87,770 21 $20,347 1 $2,632,110 47 $65,609 APPLICATIONS APPROVED, NOT ACCEPTED 10 $84,245 16 $61,230 55 $86,589 10 $35,431 1 $3,090,280 7 $65,584 APPLICATIONS DENIED 51 $83,476 62 $77,745 305 $80,176 86 $22,628 0 $0 41 $63,317 APPLICATIONS WITHDRAWN 29 $83,809 41 $70,185 133 $84,493 23 $54,212 0 $0 28 $48,275 FILES CLOSED FOR INCOMPLETENESS 11 $78,845 13 $71,060 22 $71,495 7 $43,117 0 $0 7 $57,687
Aggregated Statistics For Year 2008(Based on 12 full and 6 partial tracts) A) FHA, FSA/RHS & VA B) Conventional C) Refinancings D) Home Improvement Loans E) Loans on Dwellings For 5+ Families F) Non-occupant Loans on G) Loans On Manufactured Number Average Value Number Average Value Number Average Value Number Average Value Number Average Value Number Average Value Number Average Value
LOANS ORIGINATED 88 $91,776 317 $80,552 252 $79,235 74 $35,349 0 $0 111 $75,860 0 $0 APPLICATIONS APPROVED, NOT ACCEPTED 21 $85,477 55 $82,968 106 $75,978 11 $27,177 0 $0 31 $81,358 2 $43,980 APPLICATIONS DENIED 64 $90,834 203 $83,338 568 $86,636 205 $35,861 1 $4,100,000 112 $74,057 5 $71,626 APPLICATIONS WITHDRAWN 34 $88,176 82 $93,303 128 $90,073 13 $55,189 0 $0 29 $100,163 0 $0 FILES CLOSED FOR INCOMPLETENESS 7 $89,651 36 $80,229 32 $80,262 9 $49,380 0 $0 13 $80,126 0 $0
Aggregated Statistics For Year 2007(Based on 12 full and 6 partial tracts) A) FHA, FSA/RHS & VA B) Conventional C) Refinancings D) Home Improvement Loans E) Loans on Dwellings For 5+ Families F) Non-occupant Loans on G) Loans On Manufactured Number Average Value Number Average Value Number Average Value Number Average Value Number Average Value Number Average Value Number Average Value
LOANS ORIGINATED 62 $102,110 1,159 $86,658 520 $81,527 102 $37,814 4 $2,725,585 259 $80,348 2 $32,590 APPLICATIONS APPROVED, NOT ACCEPTED 1 $55,090 191 $81,677 176 $79,234 23 $36,146 0 $0 62 $76,103 0 $0 APPLICATIONS DENIED 37 $110,693 571 $88,051 956 $84,104 225 $31,559 0 $0 256 $81,762 0 $0 APPLICATIONS WITHDRAWN 8 $124,290 255 $88,562 305 $91,617 30 $54,115 0 $0 76 $78,717 0 $0 FILES CLOSED FOR INCOMPLETENESS 10 $110,872 64 $93,306 119 $95,450 2 $76,090 0 $0 22 $85,426 0 $0
Aggregated Statistics For Year 2006(Based on 12 full and 6 partial tracts) A) FHA, FSA/RHS & VA B) Conventional C) Refinancings D) Home Improvement Loans E) Loans on Dwellings For 5+ Families F) Non-occupant Loans on G) Loans On Manufactured Number Average Value Number Average Value Number Average Value Number Average Value Number Average Value Number Average Value Number Average Value
LOANS ORIGINATED 59 $107,333 1,929 $73,634 618 $79,118 121 $37,206 10 $2,737,133 416 $73,450 6 $32,073 APPLICATIONS APPROVED, NOT ACCEPTED 9 $107,372 586 $71,363 203 $79,096 37 $32,943 0 $0 183 $72,983 7 $40,387 APPLICATIONS DENIED 24 $117,421 863 $75,847 1,035 $81,223 261 $31,973 0 $0 240 $70,781 14 $41,391 APPLICATIONS WITHDRAWN 13 $119,425 468 $78,661 496 $84,188 36 $39,187 0 $0 148 $72,959 0 $0 FILES CLOSED FOR INCOMPLETENESS 2 $97,890 104 $89,063 205 $83,163 6 $28,638 1 $4,138,290 23 $145,663 0 $0
Aggregated Statistics For Year 2005(Based on 12 full and 6 partial tracts) A) FHA, FSA/RHS & VA B) Conventional C) Refinancings D) Home Improvement Loans E) Loans on Dwellings For 5+ Families F) Non-occupant Loans on G) Loans On Manufactured Number Average Value Number Average Value Number Average Value Number Average Value Number Average Value Number Average Value Number Average Value
LOANS ORIGINATED 42 $106,230 1,810 $73,635 889 $72,957 106 $59,914 3 $6,745,663 405 $78,728 0 $0 APPLICATIONS APPROVED, NOT ACCEPTED 7 $136,341 525 $69,859 229 $70,941 29 $37,695 0 $0 99 $66,222 5 $48,722 APPLICATIONS DENIED 17 $119,535 824 $71,730 1,351 $76,173 251 $34,279 1 $1,309,380 212 $66,078 9 $40,817 APPLICATIONS WITHDRAWN 14 $115,869 491 $84,539 497 $90,078 104 $193,268 2 $72,920 130 $81,745 0 $0 FILES CLOSED FOR INCOMPLETENESS 0 $0 96 $87,272 401 $85,480 3 $62,920 0 $0 15 $77,308 0 $0
Aggregated Statistics For Year 2004(Based on 12 full and 6 partial tracts) A) FHA, FSA/RHS & VA B) Conventional C) Refinancings D) Home Improvement Loans E) Loans on Dwellings For 5+ Families F) Non-occupant Loans on G) Loans On Manufactured Number Average Value Number Average Value Number Average Value Number Average Value Number Average Value Number Average Value Number Average Value
LOANS ORIGINATED 83 $88,160 1,794 $78,115 1,373 $69,692 81 $43,609 8 $4,484,902 335 $73,234 2 $22,715 APPLICATIONS APPROVED, NOT ACCEPTED 9 $95,247 398 $74,108 340 $69,578 43 $44,955 0 $0 55 $74,042 9 $36,434 APPLICATIONS DENIED 31 $106,280 734 $72,652 1,425 $72,170 200 $34,171 0 $0 175 $65,917 26 $39,420 APPLICATIONS WITHDRAWN 30 $110,681 455 $80,715 556 $76,097 26 $53,415 2 $60,000 89 $76,860 1 $23,510 FILES CLOSED FOR INCOMPLETENESS 10 $127,611 82 $87,714 413 $80,482 4 $43,772 0 $0 19 $67,294 0 $0
Aggregated Statistics For Year 2003(Based on 12 full and 6 partial tracts) A) FHA, FSA/RHS & VA B) Conventional C) Refinancings D) Home Improvement Loans E) Loans on Dwellings For 5+ Families F) Non-occupant Loans on Number Average Value Number Average Value Number Average Value Number Average Value Number Average Value Number Average Value
LOANS ORIGINATED 116 $88,122 1,200 $70,920 1,816 $68,191 65 $33,763 5 $5,889,880 213 $86,677 APPLICATIONS APPROVED, NOT ACCEPTED 13 $70,145 252 $70,316 395 $60,617 22 $31,814 0 $0 60 $65,158 APPLICATIONS DENIED 28 $91,632 423 $69,223 1,689 $68,369 153 $22,812 0 $0 148 $63,820 APPLICATIONS WITHDRAWN 15 $91,917 218 $72,100 647 $71,165 6 $33,965 0 $0 59 $74,066 FILES CLOSED FOR INCOMPLETENESS 6 $70,260 137 $76,772 145 $68,917 4 $67,955 0 $0 13 $65,952
Aggregated Statistics For Year 1999(Based on 4 full and 2 partial tracts) A) FHA, FSA/RHS & VA B) Conventional C) Refinancings D) Home Improvement Loans E) Loans on Dwellings For 5+ Families F) Non-occupant Loans on Number Average Value Number Average Value Number Average Value Number Average Value Number Average Value Number Average Value
LOANS ORIGINATED 120 $66,647 553 $53,911 201 $45,044 48 $13,607 3 $3,219,980 77 $43,307 APPLICATIONS APPROVED, NOT ACCEPTED 3 $76,213 113 $50,430 58 $46,542 19 $15,758 0 $0 18 $53,238 APPLICATIONS DENIED 16 $68,131 229 $50,285 98 $44,364 81 $10,002 0 $0 25 $46,106 APPLICATIONS WITHDRAWN 17 $70,406 102 $53,036 82 $50,654 4 $33,435 0 $0 16 $61,573 FILES CLOSED FOR INCOMPLETENESS 3 $59,373 41 $52,233 74 $57,931 2 $22,795 0 $0 7 $50,171
Private Mortgage Insurance Companies Aggregated Statistics For Year 2009(Based on 10 full and 4 partial tracts) A) Conventional B) Refinancings Number Average Value Number Average Value
LOANS ORIGINATED 23 $72,863 9 $103,492 APPLICATIONS APPROVED, NOT ACCEPTED 15 $97,927 3 $80,000 APPLICATIONS DENIED 12 $104,987 0 $0 APPLICATIONS WITHDRAWN 4 $50,190 2 $171,840 FILES CLOSED FOR INCOMPLETENESS 3 $60,580 0 $0
Aggregated Statistics For Year 2008(Based on 12 full and 6 partial tracts) A) Conventional B) Refinancings C) Non-occupant Loans on Number Average Value Number Average Value Number Average Value
LOANS ORIGINATED 191 $91,336 35 $100,344 27 $84,966 APPLICATIONS APPROVED, NOT ACCEPTED 110 $99,384 26 $87,866 15 $107,260 APPLICATIONS DENIED 24 $106,905 2 $101,725 9 $115,584 APPLICATIONS WITHDRAWN 11 $87,247 0 $0 2 $64,930 FILES CLOSED FOR INCOMPLETENESS 12 $90,465 2 $101,865 6 $94,955
Aggregated Statistics For Year 2007(Based on 12 full and 6 partial tracts) A) Conventional B) Refinancings C) Non-occupant Loans on Number Average Value Number Average Value Number Average Value
LOANS ORIGINATED 472 $95,386 73 $101,691 57 $93,381 APPLICATIONS APPROVED, NOT ACCEPTED 50 $105,431 17 $104,859 13 $98,452 APPLICATIONS DENIED 28 $92,900 1 $95,000 11 $88,639 APPLICATIONS WITHDRAWN 21 $104,738 2 $104,190 9 $124,918 FILES CLOSED FOR INCOMPLETENESS 10 $94,980 0 $0 6 $99,333
Aggregated Statistics For Year 2006(Based on 12 full and 6 partial tracts) A) Conventional B) Refinancings C) Non-occupant Loans on Number Average Value Number Average Value Number Average Value
LOANS ORIGINATED 245 $96,088 34 $99,344 43 $92,007 APPLICATIONS APPROVED, NOT ACCEPTED 49 $101,398 14 $94,679 14 $105,739 APPLICATIONS DENIED 30 $104,381 0 $0 27 $103,296 APPLICATIONS WITHDRAWN 10 $100,779 3 $81,000 4 $101,500 FILES CLOSED FOR INCOMPLETENESS 3 $56,370 0 $0 0 $0
Aggregated Statistics For Year 2005(Based on 12 full and 6 partial tracts) A) Conventional B) Refinancings C) Non-occupant Loans on Number Average Value Number Average Value Number Average Value
LOANS ORIGINATED 294 $95,845 51 $75,209 38 $104,410 APPLICATIONS APPROVED, NOT ACCEPTED 74 $103,259 9 $91,781 14 $90,606 APPLICATIONS DENIED 8 $82,906 4 $107,448 4 $123,960 APPLICATIONS WITHDRAWN 19 $122,157 3 $67,580 6 $111,957 FILES CLOSED FOR INCOMPLETENESS 6 $92,667 0 $0 0 $0
Aggregated Statistics For Year 2004(Based on 12 full and 6 partial tracts) A) Conventional B) Refinancings C) Non-occupant Loans on Number Average Value Number Average Value Number Average Value
LOANS ORIGINATED 439 $93,776 49 $85,090 53 $92,300 APPLICATIONS APPROVED, NOT ACCEPTED 108 $94,293 18 $85,680 2 $74,220 APPLICATIONS DENIED 18 $90,206 4 $121,440 11 $108,970 APPLICATIONS WITHDRAWN 43 $104,740 5 $85,120 7 $95,003 FILES CLOSED FOR INCOMPLETENESS 1 $82,000 3 $88,350 0 $0
Aggregated Statistics For Year 2003(Based on 12 full and 6 partial tracts) A) Conventional B) Refinancings C) Non-occupant Loans on Number Average Value Number Average Value Number Average Value
LOANS ORIGINATED 365 $78,969 95 $88,207 24 $70,370 APPLICATIONS APPROVED, NOT ACCEPTED 97 $82,151 45 $77,718 7 $52,930 APPLICATIONS DENIED 14 $98,188 1 $88,000 3 $106,160 APPLICATIONS WITHDRAWN 23 $92,768 10 $76,534 5 $74,392 FILES CLOSED FOR INCOMPLETENESS 2 $66,265 3 $78,507 0 $0
Aggregated Statistics For Year 1999(Based on 4 full and 2 partial tracts) A) Conventional B) Refinancings C) Non-occupant Loans on Number Average Value Number Average Value Number Average Value
LOANS ORIGINATED 251 $60,188 33 $57,974 9 $48,629 APPLICATIONS APPROVED, NOT ACCEPTED 27 $57,946 3 $66,003 2 $61,205 APPLICATIONS DENIED 16 $65,296 1 $17,910 1 $59,000 APPLICATIONS WITHDRAWN 10 $55,469 2 $71,845 0 $0 FILES CLOSED FOR INCOMPLETENESS 3 $56,220 1 $47,770 0 $0
2002 - 2018 National Fire Incident Reporting System (NFIRS) incidents See full 2006 National Fire Incident Reporting System statistics for zip code 77072, Texas
Most common first names in zip code 77072 among deceased individuals Name Count Lived (average)
John 54 69.1 years Mary 52 73.3 years James 50 63.3 years Robert 50 65.4 years William 33 64.6 years Charles 32 66.4 years Helen 24 73.2 years Maria 22 77.6 years Dorothy 22 78.6 years Joseph 21 70.9 years
Most common last names in zip code 77072 among deceased individuals Last name Count Lived (average)
Nguyen 71 70.6 years Smith 26 68.7 years Williams 21 71.7 years Jones 20 69.4 years Tran 18 72.1 years Johnson 18 73.0 years Brown 15 60.9 years Martinez 14 63.8 years Lee 13 71.2 years Davis 12 69.3 years
Businesses in zip code 77072
Name Count Name Count
AutoZone 1 La Quinta 1 Burger King 2 Little Caesars Pizza 1 CVS 1 McDonald's 2 Church's Chicken 1 Payless 1 Cricket Wireless 3 Pizza Hut 1 Dennys 1 Popeyes 2 Domino's Pizza 1 Subway 3 FedEx 5 T-Mobile 5 GameStop 1 U-Haul 2 H&R Block 2 UPS 3 Hilton 1 Walgreens 1 Home Depot 1 Walmart 1 Jack In The Box 2


 Nearest zip codes: 77099, 77042, 77036, 77077, 77082, 77031.
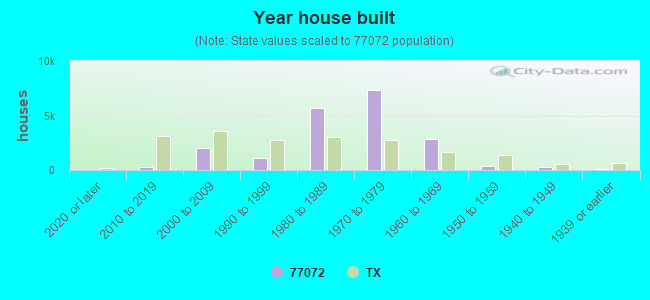


 Based on the data from the years 2002 - 2018 the average number of fire incidents per year is 61. The highest number of reported fires - 184 took place in 2011, and the least - 0 in 2004. The data has an increasing trend.
 When looking into fire subcategories, the most reports belonged to: Outside Fires (41.4%), and Structure Fires (34.0%).