Estimated zip code population in 2022: 27,209 Zip code population in 2010: 19,534 Zip code population in 2000: 9,796
Houses and condos: 9,678 Renter-occupied apartments: 2,085
% of renters here:
23%
State:
38%
March 2022 cost of living index in zip code 77385: 96.7 (near average, U.S. average is 100)
Land area: 21.8 sq. mi. Water area: 0.4 sq. mi.
Population density: 1,247 people per square mile
(low).
OSM Map
General Map
Google Map
MSN Map
OSM Map
General Map
Google Map
MSN Map
OSM Map
General Map
Google Map
MSN Map
OSM Map
General Map
Google Map
MSN Map
Please wait while loading the map...
Real estate property taxes paid for housing units in 2022:
This zip code:
1.6% ($5,240)
Texas:
1.5% ($4,050)
Median real estate property taxes paid for housing units with mortgages in 2022: $6,183 (1.8%) Median real estate property taxes paid for housing units with no mortgage in 2022: $4,097 (1.6%)
Estimated median house/condo value in 2022: $317,983
77385:
$317,983
Texas:
$275,400
According to our research of Texas and other state lists, there were 33 registered sex offenders living in 77385 zip code as of May 28, 2024. The ratio of all residents to sex offenders in zip code 77385 is 708 to 1. The ratio of registered sex offenders to all residents in this zip code is lower than the state average.
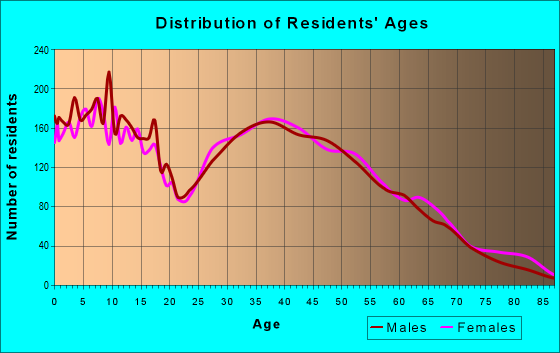
Median resident age:
This zip code:
33.9 years
Texas median age:
35.6 years
Average household size:
This zip code:
3.0 people
Texas:
2.6 people
Averages for the 2020 tax year for zip code 77385, filed in 2021:
Average Adjusted Gross Income (AGI) in 2020: $78,275 (Individual Income Tax Returns)
Here:
$78,275
State:
$77,054
Salary/wage: $73,237 (reported on 85.7% of returns)
Here:
$73,237
State:
$62,766
(% of AGI for various income ranges: 1219.7% for AGIs below $25k, 3501.2% for AGIs $25k-50k, 6452.2% for AGIs $50k-75k, 9644.1% for AGIs $75k-100k, 18225.6% for AGIs $100k-200k, 56947.1% for AGIs over 200k)
Taxable interest for individuals: $935 (reported on 22.9% of returns)
This zip code:
$935
Texas:
$2,665
(% of AGI for various income ranges: 8.5% for AGIs below $25k, 13.5% for AGIs $25k-50k, 20.5% for AGIs $50k-75k, 31.9% for AGIs $75k-100k, 50.6% for AGIs $100k-200k, 216.3% for AGIs over 200k)
Ordinary dividends: $3,632 (reported on 16.4% of returns)
Here:
$3,632
State:
$10,044
(% of AGI for various income ranges: 16.8% for AGIs below $25k, 23.6% for AGIs $25k-50k, 38.9% for AGIs $50k-75k, 62.1% for AGIs $75k-100k, 124.4% for AGIs $100k-200k, 962.9% for AGIs over 200k)
Net capital gain/loss in AGI: +$10,995 (reported on 16.4% of returns)
Here:
+$10,995
State:
+$39,590
(% of AGI for various income ranges: 9.9% for AGIs below $25k, 27.9% for AGIs $25k-50k, 53.0% for AGIs $50k-75k, 134.7% for AGIs $75k-100k, 237.8% for AGIs $100k-200k, 4624.0% for AGIs over 200k)
Profit/loss from business: +$10,796 (reported on 21.6% of returns)
Here:
+$10,796
State:
+$10,888
(% of AGI for various income ranges: 147.4% for AGIs below $25k, 211.4% for AGIs $25k-50k, 179.6% for AGIs $50k-75k, 174.7% for AGIs $75k-100k, 488.6% for AGIs $100k-200k, 2499.1% for AGIs over 200k)
Taxable individual retirement arrangement distribution: $25,222 (reported on 6.7% of returns)
77385:
$25,222
Texas:
$24,740
(% of AGI for various income ranges: 29.8% for AGIs below $25k, 80.0% for AGIs $25k-50k, 174.6% for AGIs $50k-75k, 287.9% for AGIs $75k-100k, 440.2% for AGIs $100k-200k, 1803.1% for AGIs over 200k)
Self-employed (Keogh) retirement plans: $23,600 (reported on 0.3% of returns)
77385:
$23,600
Texas:
$29,298
(% of AGI for various income ranges: 55.5% for AGIs $100k-200k)
Total itemized deductions: $32,653 (reported on 10.1% of returns)
Here:
$32,653
State:
$40,428
(% of AGI for various income ranges: 46.6% for AGIs below $25k, 136.2% for AGIs $25k-50k, 376.7% for AGIs $50k-75k, 644.8% for AGIs $75k-100k, 829.2% for AGIs $100k-200k, 3431.1% for AGIs over 200k)
Charity contributions: $11,544 (reported on 8.0% of returns)
Here:
$11,544
State:
$18,201
(% of AGI for various income ranges: 3.8% for AGIs below $25k, 24.0% for AGIs $25k-50k, 66.8% for AGIs $50k-75k, 126.2% for AGIs $75k-100k, 244.9% for AGIs $100k-200k, 1365.1% for AGIs over 200k)
Taxes paid: $8,080 (reported on 9.6% of returns)
77385:
$8,080
State:
$7,821
(% of AGI for various income ranges: 8.7% for AGIs below $25k, 31.4% for AGIs $25k-50k, 99.6% for AGIs $50k-75k, 173.8% for AGIs $75k-100k, 207.7% for AGIs $100k-200k, 667.7% for AGIs over 200k)
Earned income credit: $2,485 (reported on 14.1% of returns)
Here:
$2,485
State:
$2,584
(% of AGI for various income ranges: 102.4% for AGIs below $25k, 77.6% for AGIs $25k-50k, 1.4% for AGIs $50k-75k)
Percentage of individuals using paid preparers for their 2020 taxes: 92.7%
Here:
93%
State:
92%
(% for various income ranges: 90.5% for AGIs below $25k, 93.4% for AGIs $25k-50k, 93.3% for AGIs $50k-75k, 93.2% for AGIs $75k-100k, 93.9% for AGIs $100k-200k, 94.0% for AGIs over 200k)
Averages for the 2012 tax year for zip code 77385, filed in 2013:
Average Adjusted Gross Income (AGI) in 2012: $67,947 (Individual Income Tax Returns)
Here:
$67,947
State:
$65,384
Salary/wage: $63,779 (reported on 87.9% of returns)
Here:
$63,779
State:
$52,524
(% of AGI for various income ranges: 77.4% for AGIs below $25k, 85.2% for AGIs $25k-50k, 83.6% for AGIs $50k-75k, 86.2% for AGIs $75k-100k, 88.0% for AGIs $100k-200k, 69.2% for AGIs over 200k)
Taxable interest for individuals: $847 (reported on 26.6% of returns)
This zip code:
$847
Texas:
$2,372
(% of AGI for various income ranges: 1.0% for AGIs below $25k, 0.4% for AGIs $25k-50k, 0.3% for AGIs $50k-75k, 0.2% for AGIs $75k-100k, 0.3% for AGIs $100k-200k, 0.3% for AGIs over 200k)
Ordinary dividends: $2,825 (reported on 15.0% of returns)
Here:
$2,825
State:
$9,721
(% of AGI for various income ranges: 1.0% for AGIs below $25k, 0.6% for AGIs $25k-50k, 0.5% for AGIs $50k-75k, 0.4% for AGIs $75k-100k, 0.5% for AGIs $100k-200k, 0.9% for AGIs over 200k)
Net capital gain/loss in AGI: +$5,837 (reported on 12.0% of returns)
Here:
+$5,837
State:
+$35,319
(% of AGI for various income ranges: 0.2% for AGIs $25k-50k, 0.3% for AGIs $50k-75k, 0.4% for AGIs $75k-100k, 0.4% for AGIs $100k-200k, 3.8% for AGIs over 200k)
Profit/loss from business: +$13,066 (reported on 18.5% of returns)
Here:
+$13,066
State:
+$13,732
(% of AGI for various income ranges: 11.1% for AGIs below $25k, 4.4% for AGIs $25k-50k, 3.4% for AGIs $50k-75k, 2.8% for AGIs $75k-100k, 2.4% for AGIs $100k-200k, 3.7% for AGIs over 200k)
Taxable individual retirement arrangement distribution: $16,485 (reported on 7.1% of returns)
77385:
$16,485
Texas:
$19,511
(% of AGI for various income ranges: 2.1% for AGIs below $25k, 1.6% for AGIs $25k-50k, 2.5% for AGIs $50k-75k, 2.1% for AGIs $75k-100k, 1.5% for AGIs $100k-200k, 1.3% for AGIs over 200k)
Self-employment retirement plans: $18,200 (reported on 0.3% of returns)
77385:
$18,200
Texas:
$23,938
(% of AGI for various income ranges: 0.2% for AGIs $100k-200k)
Total itemized deductions: $19,726 (18% of AGI, reported on 37.5% of returns)
Here:
$19,726
State:
$24,724
Here:
17.7% of AGI
State:
15.9% of AGI
(% of AGI for various income ranges: 8.7% for AGIs below $25k, 11.7% for AGIs $25k-50k, 12.2% for AGIs $50k-75k, 12.7% for AGIs $75k-100k, 12.0% for AGIs $100k-200k, 7.0% for AGIs over 200k)
Charity contributions: $4,161 (reported on 29.1% of returns)
Here:
$4,161
State:
$6,808
(% of AGI for various income ranges: 0.7% for AGIs below $25k, 1.4% for AGIs $25k-50k, 1.6% for AGIs $50k-75k, 1.8% for AGIs $75k-100k, 2.2% for AGIs $100k-200k, 1.7% for AGIs over 200k)
Taxes paid: $6,194 (reported on 36.8% of returns)
77385:
$6,194
State:
$6,921
(% of AGI for various income ranges: 2.1% for AGIs below $25k, 2.9% for AGIs $25k-50k, 3.4% for AGIs $50k-75k, 3.9% for AGIs $75k-100k, 3.9% for AGIs $100k-200k, 2.5% for AGIs over 200k)
Earned income credit: $2,274 (reported on 14.0% of returns)
Here:
$2,274
State:
$2,570
(% of AGI for various income ranges: 6.0% for AGIs below $25k, 1.2% for AGIs $25k-50k)
Percentage of individuals using paid preparers for their 2012 taxes: 42.6%
Here:
43%
State:
51%
(% for various income ranges: 41.6% for AGIs below $25k, 43.1% for AGIs $25k-50k, 41.4% for AGIs $50k-75k, 38.9% for AGIs $75k-100k, 42.9% for AGIs $100k-200k, 60.5% for AGIs over 200k)
Averages for the 2004 tax year for zip code 77385, filed in 2005:
Average Adjusted Gross Income (AGI) in 2004: $54,895 (Individual Income Tax Returns)
Here:
$54,895
State:
$47,881
Salary/wage: $52,987 (reported on 89.2% of returns)
Here:
$52,987
State:
$41,947
(% of AGI for various income ranges: 121.7% for AGIs below $10k, 80.1% for AGIs $10k-25k, 85.1% for AGIs $25k-50k, 88.4% for AGIs $50k-75k, 90.2% for AGIs $75k-100k, 83.3% for AGIs over 100k)
Taxable interest for individuals: $1,030 (reported on 37.1% of returns)
This zip code:
$1,030
Texas:
$2,255
(% of AGI for various income ranges: 2.7% for AGIs below $10k, 1.4% for AGIs $10k-25k, 1.0% for AGIs $25k-50k, 0.7% for AGIs $50k-75k, 0.6% for AGIs $75k-100k, 0.5% for AGIs over 100k)
Taxable dividends: $1,407 (reported on 18.1% of returns)
Here:
$1,407
State:
$4,261
(% of AGI for various income ranges: 1.3% for AGIs below $10k, 0.8% for AGIs $10k-25k, 0.4% for AGIs $25k-50k, 0.3% for AGIs $50k-75k, 0.6% for AGIs $75k-100k, 0.4% for AGIs over 100k)
Net capital gain/loss: +$4,306 (reported on 16.6% of returns)
Here:
+$4,306
State:
+$16,110
(% of AGI for various income ranges: -1.1% for AGIs below $10k, -0.3% for AGIs $10k-25k, 0.3% for AGIs $25k-50k, 0.7% for AGIs $50k-75k, 0.4% for AGIs $75k-100k, 2.7% for AGIs over 100k)
Profit/loss from business: +$11,418 (reported on 19.3% of returns)
Here:
+$11,418
State:
+$11,013
(% of AGI for various income ranges: 3.9% for AGIs below $10k, 9.1% for AGIs $10k-25k, 3.9% for AGIs $25k-50k, 2.5% for AGIs $50k-75k, 2.2% for AGIs $75k-100k, 5.0% for AGIs over 100k)
IRA payment deduction: $3,100 (reported on 2.4% of returns)
77385:
$3,100
Texas:
$3,120
(% of AGI for various income ranges: 0.1% for AGIs $10k-25k, 0.2% for AGIs $25k-50k, 0.1% for AGIs $50k-75k, 0.1% for AGIs $75k-100k, 0.1% for AGIs over 100k)
Self-employed pension: $13,371 (reported on 0.6% of returns)
Here:
$13,371
Texas:
$16,401
Total itemized deductions: $18,085 (21% of AGI, reported on 41.9% of returns)
Here:
$18,085
State:
$19,631
Here:
20.8% of AGI
State:
18.9% of AGI
(% of AGI for various income ranges: 15.0% for AGIs below $10k, 9.7% for AGIs $10k-25k, 13.1% for AGIs $25k-50k, 15.2% for AGIs $50k-75k, 15.9% for AGIs $75k-100k, 12.8% for AGIs over 100k)
Charity contributions deductions: $3,236 (4% of AGI, reported on 34.8% of returns)
Here:
$3,236
State:
$4,753
Here:
3.6% of AGI
State:
4.2% of AGI
(% of AGI for various income ranges: 0.9% for AGIs below $10k, 1.1% for AGIs $10k-25k, 1.6% for AGIs $25k-50k, 1.8% for AGIs $50k-75k, 2.0% for AGIs $75k-100k, 2.5% for AGIs over 100k)
Total tax: $7,997 (reported on 78.9% of returns)
77385:
$7,997
State:
$9,058
(% of AGI for various income ranges: 3.7% for AGIs below $10k, 4.4% for AGIs $10k-25k, 6.6% for AGIs $25k-50k, 8.4% for AGIs $50k-75k, 10.0% for AGIs $75k-100k, 16.7% for AGIs over 100k)
Earned income credit: $1,874 (reported on 12.5% of returns)
Here:
$1,874
State:
$2,024
Percentage of individuals using paid preparers for their 2004 taxes: 43.6%
Here:
44%
State:
57%
(% for various income ranges: 38.1% for AGIs below $10k, 52.1% for AGIs $10k-25k, 45.6% for AGIs $25k-50k, 41.8% for AGIs $50k-75k, 39.1% for AGIs $75k-100k, 42.1% for AGIs over 100k)
Likely homosexual households (counted as self-reported same-sex unmarried-partner households)
Lesbian couples: 0.2% of all households
Gay men: 0.2% of all households
Household received Food Stamps/SNAP in the past 12 months: 648 Household did not receive Food Stamps/SNAP in the past 12 months: 8,542
Women who had a birth in the past 12 months: 415 (423 now married, 0 unmarried) Women who did not have a birth in the past 12 months: 6,926 (3,112 now married, 3,811 unmarried)
Housing units in zip code 77385 with a mortgage: 4,779 (122 second mortgage, 20 home equity loan, 76 both second mortgage and home equity loan) Houses without a mortgage: 67
Median monthly owner costs for units with a mortgage: $2,051 Median monthly owner costs for units without a mortgage: $743
Residents with income below the poverty level in 2022:
This zip code:
5.2%
Whole state:
14.0%
Residents with income below 50% of the poverty level in 2022:
This zip code:
2.8%
Whole state:
7.4%
Median number of rooms in houses and condos:
Here:
7.0
State:
6.3
Median number of rooms in apartments:
Here:
4.7
State:
4.0
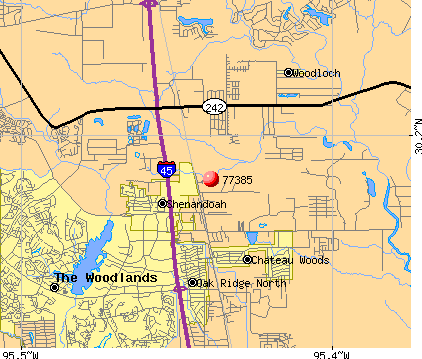
Notable locations in this zip code not listed on our city pages
Notable locations in zip code 77385: South Montgomery County Volunteer Fire Department and Emergency Medical Services - Station 11 - 3 (A), Conroe Fire Department Station 4 (B), Needham Fire / Rescue Department Station 61 (C), Needham Volunteer Fire Department Station 63 (D), Oak Ridge North Police Department (E). Display/hide their locations on the map
Churches in zip code 77385 include: Tamina Church (A), Falvey Memorial Church (B), Lone Star Baptist Church (C), Oak Ridge Christian Fellowship Church (D), Revelation Baptist Church (E), Minoch Church (F). Display/hide their locations on the map
Lakes and reservoirs: Bird Lake (A), Barefoot Lake (B), Webber Pond (C), Johnson Lakes (D), Grants Lake (E), Glen Lake (F), Lee Lake (G), Rogers Lake (H). Display/hide their locations on the map
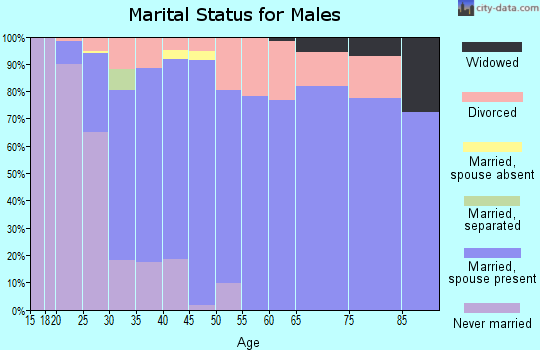
5,048 married couples with children.
1,121 single-parent households (63 men, 1,058 women).
76.8% of residents of 77385 zip code speak English at home.
16.5% of residents speak Spanish at home (72% very well, 15% well, 13% not well).
4.0% of residents speak other Indo-European language at home (68% very well, 25% well, 4% not well, 3% not at all).
2.1% of residents speak Asian or Pacific Island language at home (68% very well, 29% well, 3% not well).
0.4% of residents speak other language at home (100% very well).
Foreign born population: 4,287 (15.8%) (55.2% of them are naturalized citizens)
This zip code:
15.8%
Whole state:
17.2%
17%Chile
15%Honduras
13%Guatemala
11%Bhutan
5%St. Vincent and the Grenadines
4%Colombia
4%Barbados
14%American
12%English
5%German
4%Irish
2%Scottish
2%European
2%Polish
Year of entry for the foreign-born population
2,0662010 or later
1,2002000 to 2009
9091990 to 1999
618Before 1990
Housing units lacking complete plumbing facilities: 0.6% Housing units lacking complete kitchen facilities: 0.8%
60.4%Utility gas
36.6%Electricity
1.8%No fuel used
0.7%Bottled, tank, or LP gas
Population in 1990: 7,311. Population change in the 1990s: +2,485 (+34.0%).
Place of birth for U.S.-born residents:
This state: 15,215
Northeast: 838
Midwest: 1,724
South: 2,704
West: 2,084
60% of the 77385 zip code residents lived in the same house 5 years ago. Out of people who lived in different houses, 44% lived in this county. Out of people who lived in different counties, 50% lived in Texas.
84% of the 77385 zip code residents lived in the same house 1 year ago. Out of people who lived in different houses, 28% moved from this county. Out of people who lived in different houses, 54% moved from different county within same state. Out of people who lived in different houses, 17% moved from different state. Out of people who lived in different houses, 4% moved from abroad.
Private vs. public school enrollment:
Students in private schools in grades 1 to 8 (elementary and middle school): 248
Here:
7.8%
Texas:
8.8%
Students in private schools in grades 9 to 12 (high school): 314
Here:
17.9%
Texas:
8.0%
Students in private undergraduate colleges: 172
Here:
15.3%
Texas:
16.2%
Occupation by median earnings in the past 12 months ($)
125,379Computer and mathematical occupations
108,697Architecture and engineering occupations
105,482Health diagnosing and treating practitioners and other technical occupations
104,206Law enforcement workers including supervisors
83,795Management occupations
82,064Business and financial operations occupations
Companies with federal contracts located in this zip code:
EPCON INDUSTRIAL SYSTEMS, INC (17777 I 45 SOUTH in CONROE, TX; small business) : $1,645,496 in 14 contractsfrom 2000 to 2004
Contracts for Metal Heat Treating and Non-Thermal Treating Equipment, Miscellaneous Maintenance and Repair Shop Specialized Equipment, Industrial Furnaces, Kilns, Lehrs, and Ovens, Maintenance, Repair and Rebuilding of Equipment -- Miscellaneous, and moreby Defense Logistics Agency, Air Force, Navy, Army, and others Signed by year:2000: $700,500; 2001: $55,900; 2002: $419,286; 2003: $326,450; 2004: $143,360; 2005: $0; 2006: $0.
Biggest contracts:
$475,700 with Defense Logistics Agency for Metal Heat Treating and Non-Thermal Treating Equipment. Signed on 2000-07-11. Completion date: 2000-10-09.
$376,260 with Air Force for Miscellaneous Maintenance and Repair Shop Specialized Equipment. Signed on 2002-09-09. Completion date: 2003-03-30.
$224,500 with Navy for Industrial Furnaces, Kilns, Lehrs, and Ovens. Signed on 2003-08-05. Completion date: 2004-08-06.
$134,800, same as above.Signed on 2000-07-27. Completion date: 2000-10-10.
PURPLEHEART ARMOURY (27229 LANA LN in CONROE, TX; small business)
$78,653 with Defense Logistics Agency for Clothing, Special Purpose. Signed on 2005-09-07. Completion date: 2005-12-31.
DARRELL''S SIGN CO INC (10965 HWY 242 E in CONROE, TX; small business)
$2,930 with Army for Signs, Advertising Displays, and Identification Plates. Signed on 2003-06-19. Completion date: 2003-07-31.
Top industries in this zip code by the number of employees in 2005:
Management of Companies and Enterprises: Corporate, Subsidiary, and Regional Managing Offices (250-499 employees: 2 establishments, 20-49 employees: 1 establishment, 5-9 employees: 1 establishment)
2002 - 2018 National Fire Incident Reporting System (NFIRS) incidents
According to the data from the years 2002 - 2018 the average number of fire incidents per year is 101. The highest number of fires - 180 took place in 2011, and the least - 28 in 2004. The data has an increasing trend.
When looking into fire subcategories, the most incidents belonged to: Outside Fires (46.7%), and Structure Fires (34.0%).
Fire incident types reported to NFIRS in Zip Code 77385
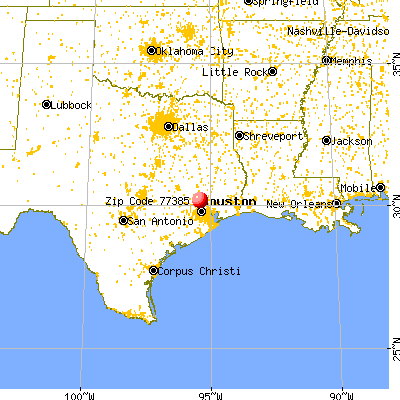


 Nearest zip codes: 77380, 77302, 77381, 77384, 77386, 77389.


 : $1,645,496 in 14 contracts from 2000 to 2004


 According to the data from the years 2002 - 2018 the average number of fire incidents per year is 101. The highest number of fires - 180 took place in 2011, and the least - 28 in 2004. The data has an increasing trend.
 When looking into fire subcategories, the most incidents belonged to: Outside Fires (46.7%), and Structure Fires (34.0%).