Estimated zip code population in 2022: 98,018 Zip code population in 2010: 53,520 Zip code population in 2000: 18,628
Houses and condos: 30,133 Renter-occupied apartments: 5,619
% of renters here:
19%
State:
38%
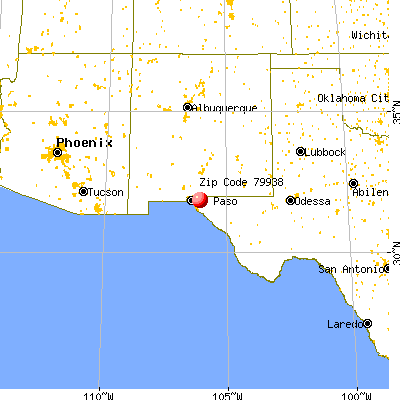
March 2022 cost of living index in zip code 79938: 80.8 (low, U.S. average is 100)
Land area: 364.3 sq. mi. Water area: 0.1 sq. mi.
Population density: 269 people per square mile
(very low).
OSM Map
General Map
Google Map
MSN Map
OSM Map
General Map
Google Map
MSN Map
OSM Map
General Map
Google Map
MSN Map
OSM Map
General Map
Google Map
MSN Map
Please wait while loading the map...
Real estate property taxes paid for housing units in 2022:
This zip code:
2.2% ($4,510)
Texas:
1.5% ($4,050)
Median real estate property taxes paid for housing units with mortgages in 2022: $4,773 (2.2%) Median real estate property taxes paid for housing units with no mortgage in 2022: $3,497 (1.9%)
Estimated median house/condo value in 2022: $209,211
79938:
$209,211
Texas:
$275,400
According to our research of Texas and other state lists, there were 99 registered sex offenders living in 79938 zip code as of May 28, 2024. The ratio of all residents to sex offenders in zip code 79938 is 737 to 1. The ratio of registered sex offenders to all residents in this zip code is lower than the state average.
Median resident age:
This zip code:
28.9 years
Texas median age:
35.6 years
Average household size:
This zip code:
3.2 people
Texas:
2.6 people
Averages for the 2020 tax year for zip code 79938, filed in 2021:
Average Adjusted Gross Income (AGI) in 2020: $48,462 (Individual Income Tax Returns)
Here:
$48,462
State:
$77,054
Salary/wage: $46,456 (reported on 88.9% of returns)
Here:
$46,456
State:
$62,766
(% of AGI for various income ranges: 1123.6% for AGIs below $25k, 3521.1% for AGIs $25k-50k, 6450.1% for AGIs $50k-75k, 9622.5% for AGIs $75k-100k, 16383.9% for AGIs $100k-200k, 53940.6% for AGIs over 200k)
Taxable interest for individuals: $588 (reported on 12.7% of returns)
This zip code:
$588
Texas:
$2,665
(% of AGI for various income ranges: 2.6% for AGIs below $25k, 4.4% for AGIs $25k-50k, 10.1% for AGIs $50k-75k, 12.4% for AGIs $75k-100k, 23.0% for AGIs $100k-200k, 392.2% for AGIs over 200k)
Ordinary dividends: $1,442 (reported on 4.3% of returns)
Here:
$1,442
State:
$10,044
(% of AGI for various income ranges: 1.1% for AGIs below $25k, 2.0% for AGIs $25k-50k, 4.9% for AGIs $50k-75k, 12.2% for AGIs $75k-100k, 25.9% for AGIs $100k-200k, 474.4% for AGIs over 200k)
Net capital gain/loss in AGI: +$4,905 (reported on 5.0% of returns)
Here:
+$4,905
State:
+$39,590
(% of AGI for various income ranges: 1.2% for AGIs below $25k, 5.8% for AGIs $25k-50k, 16.3% for AGIs $50k-75k, 53.3% for AGIs $75k-100k, 126.8% for AGIs $100k-200k, 1847.8% for AGIs over 200k)
Profit/loss from business: +$9,223 (reported on 18.7% of returns)
Here:
+$9,223
State:
+$10,888
(% of AGI for various income ranges: 203.1% for AGIs below $25k, 146.1% for AGIs $25k-50k, 136.7% for AGIs $50k-75k, 146.0% for AGIs $75k-100k, 319.8% for AGIs $100k-200k, 4933.3% for AGIs over 200k)
Taxable individual retirement arrangement distribution: $14,477 (reported on 1.6% of returns)
79938:
$14,477
Texas:
$24,740
(% of AGI for various income ranges: 5.3% for AGIs below $25k, 13.9% for AGIs $25k-50k, 28.0% for AGIs $50k-75k, 43.6% for AGIs $75k-100k, 104.4% for AGIs $100k-200k, 1072.2% for AGIs over 200k)
Self-employed (Keogh) retirement plans: $16,250 (reported on 0.0% of returns)
79938:
$16,250
Texas:
$29,298
(% of AGI for various income ranges: 3.2% for AGIs $25k-50k)
Total itemized deductions: $27,375 (reported on 4.8% of returns)
Here:
$27,375
State:
$40,428
(% of AGI for various income ranges: 10.8% for AGIs below $25k, 86.5% for AGIs $25k-50k, 236.8% for AGIs $50k-75k, 342.7% for AGIs $75k-100k, 569.2% for AGIs $100k-200k, 2484.4% for AGIs over 200k)
Charity contributions: $7,563 (reported on 3.5% of returns)
Here:
$7,563
State:
$18,201
(% of AGI for various income ranges: 1.0% for AGIs below $25k, 11.7% for AGIs $25k-50k, 32.8% for AGIs $50k-75k, 59.2% for AGIs $75k-100k, 158.4% for AGIs $100k-200k, 954.4% for AGIs over 200k)
Taxes paid: $7,837 (reported on 4.6% of returns)
79938:
$7,837
State:
$7,821
(% of AGI for various income ranges: 3.1% for AGIs below $25k, 24.2% for AGIs $25k-50k, 71.3% for AGIs $50k-75k, 100.2% for AGIs $75k-100k, 157.7% for AGIs $100k-200k, 466.7% for AGIs over 200k)
Earned income credit: $2,776 (reported on 29.2% of returns)
Here:
$2,776
State:
$2,584
(% of AGI for various income ranges: 159.8% for AGIs below $25k, 122.0% for AGIs $25k-50k, 3.1% for AGIs $50k-75k)
Percentage of individuals using paid preparers for their 2020 taxes: 94.1%
Here:
94%
State:
92%
(% for various income ranges: 93.7% for AGIs below $25k, 94.8% for AGIs $25k-50k, 94.3% for AGIs $50k-75k, 93.7% for AGIs $75k-100k, 93.9% for AGIs $100k-200k, 91.3% for AGIs over 200k)
Averages for the 2012 tax year for zip code 79938, filed in 2013:
Average Adjusted Gross Income (AGI) in 2012: $41,024 (Individual Income Tax Returns)
Here:
$41,024
State:
$65,384
Salary/wage: $40,151 (reported on 91.2% of returns)
Here:
$40,151
State:
$52,524
(% of AGI for various income ranges: 80.9% for AGIs below $25k, 92.0% for AGIs $25k-50k, 93.7% for AGIs $50k-75k, 93.6% for AGIs $75k-100k, 89.9% for AGIs $100k-200k, 55.1% for AGIs over 200k)
Taxable interest for individuals: $535 (reported on 12.9% of returns)
This zip code:
$535
Texas:
$2,372
(% of AGI for various income ranges: 0.2% for AGIs below $25k, 0.1% for AGIs $25k-50k, 0.2% for AGIs $50k-75k, 0.1% for AGIs $75k-100k, 0.2% for AGIs $100k-200k, 0.4% for AGIs over 200k)
Ordinary dividends: $2,071 (reported on 3.8% of returns)
Here:
$2,071
State:
$9,721
(% of AGI for various income ranges: 0.3% for AGIs below $25k, 0.2% for AGIs $25k-50k, 0.1% for AGIs $50k-75k, 0.2% for AGIs $100k-200k, 1.0% for AGIs over 200k)
Net capital gain/loss in AGI: +$3,125 (reported on 2.8% of returns)
Here:
+$3,125
State:
+$35,319
(% of AGI for various income ranges: 0.1% for AGIs $50k-75k, 0.2% for AGIs $75k-100k, 0.3% for AGIs $100k-200k, 2.0% for AGIs over 200k)
Profit/loss from business: +$10,568 (reported on 16.5% of returns)
Here:
+$10,568
State:
+$13,732
(% of AGI for various income ranges: 14.8% for AGIs below $25k, 3.5% for AGIs $25k-50k, 1.5% for AGIs $50k-75k, 1.5% for AGIs $75k-100k, 2.4% for AGIs $100k-200k, 7.5% for AGIs over 200k)
Taxable individual retirement arrangement distribution: $10,470 (reported on 2.0% of returns)
79938:
$10,470
Texas:
$19,511
(% of AGI for various income ranges: 0.3% for AGIs below $25k, 0.3% for AGIs $25k-50k, 0.5% for AGIs $50k-75k, 0.4% for AGIs $75k-100k, 1.0% for AGIs $100k-200k)
Total itemized deductions: $18,126 (24% of AGI, reported on 25.9% of returns)
Here:
$18,126
State:
$24,724
Here:
24.4% of AGI
State:
15.9% of AGI
(% of AGI for various income ranges: 4.2% for AGIs below $25k, 10.3% for AGIs $25k-50k, 13.3% for AGIs $50k-75k, 14.2% for AGIs $75k-100k, 14.3% for AGIs $100k-200k, 8.8% for AGIs over 200k)
Charity contributions: $2,488 (reported on 16.9% of returns)
Here:
$2,488
State:
$6,808
(% of AGI for various income ranges: 0.2% for AGIs below $25k, 0.6% for AGIs $25k-50k, 1.0% for AGIs $50k-75k, 1.4% for AGIs $75k-100k, 1.7% for AGIs $100k-200k, 1.7% for AGIs over 200k)
Taxes paid: $5,280 (reported on 25.6% of returns)
79938:
$5,280
State:
$6,921
(% of AGI for various income ranges: 1.2% for AGIs below $25k, 2.8% for AGIs $25k-50k, 3.6% for AGIs $50k-75k, 4.2% for AGIs $75k-100k, 4.4% for AGIs $100k-200k, 2.8% for AGIs over 200k)
Earned income credit: $2,810 (reported on 36.6% of returns)
Here:
$2,810
State:
$2,570
(% of AGI for various income ranges: 13.1% for AGIs below $25k, 2.6% for AGIs $25k-50k)
Percentage of individuals using paid preparers for their 2012 taxes: 57.1%
Here:
57%
State:
51%
(% for various income ranges: 59.8% for AGIs below $25k, 54.7% for AGIs $25k-50k, 54.7% for AGIs $50k-75k, 55.6% for AGIs $75k-100k, 54.5% for AGIs $100k-200k, 81.8% for AGIs over 200k)
Averages for the 2004 tax year for zip code 79938, filed in 2005:
Average Adjusted Gross Income (AGI) in 2004: $28,249 (Individual Income Tax Returns)
Here:
$28,249
State:
$47,881
Salary/wage: $28,450 (reported on 90.1% of returns)
Here:
$28,450
State:
$41,947
(% of AGI for various income ranges: 85.3% for AGIs below $10k, 86.4% for AGIs $10k-25k, 95.2% for AGIs $25k-50k, 94.1% for AGIs $50k-75k, 92.9% for AGIs $75k-100k, 80.9% for AGIs over 100k)
Taxable interest for individuals: $468 (reported on 15.9% of returns)
This zip code:
$468
Texas:
$2,255
(% of AGI for various income ranges: 0.6% for AGIs below $10k, 0.2% for AGIs $10k-25k, 0.2% for AGIs $25k-50k, 0.1% for AGIs $50k-75k, 0.4% for AGIs $75k-100k, 0.4% for AGIs over 100k)
Taxable dividends: $594 (reported on 3.8% of returns)
Here:
$594
State:
$4,261
(% of AGI for various income ranges: 0.2% for AGIs below $10k, 0.1% for AGIs $10k-25k, 0.1% for AGIs $25k-50k, 0.0% for AGIs $50k-75k, 0.1% for AGIs $75k-100k, 0.2% for AGIs over 100k)
Net capital gain/loss: +$2,458 (reported on 3.4% of returns)
Here:
+$2,458
State:
+$16,110
(% of AGI for various income ranges: -0.1% for AGIs below $10k, 0.1% for AGIs $10k-25k, 0.1% for AGIs $25k-50k, 0.1% for AGIs $50k-75k, 0.2% for AGIs $75k-100k, 1.9% for AGIs over 100k)
Profit/loss from business: +$5,525 (reported on 19.4% of returns)
Here:
+$5,525
State:
+$11,013
(% of AGI for various income ranges: 18.4% for AGIs below $10k, 10.0% for AGIs $10k-25k, 1.3% for AGIs $25k-50k, 1.6% for AGIs $50k-75k, -0.4% for AGIs $75k-100k, 1.2% for AGIs over 100k)
IRA payment deduction: $2,233 (reported on 1.1% of returns)
79938:
$2,233
Texas:
$3,120
(% of AGI for various income ranges: 0.0% for AGIs $10k-25k, 0.1% for AGIs $25k-50k, 0.1% for AGIs $50k-75k, 0.2% for AGIs $75k-100k)
Total itemized deductions: $15,818 (28% of AGI, reported on 20.4% of returns)
Here:
$15,818
State:
$19,631
Here:
28.2% of AGI
State:
18.9% of AGI
(% of AGI for various income ranges: 3.0% for AGIs below $10k, 3.9% for AGIs $10k-25k, 13.0% for AGIs $25k-50k, 15.0% for AGIs $50k-75k, 15.4% for AGIs $75k-100k, 14.4% for AGIs over 100k)
Charity contributions deductions: $1,780 (3% of AGI, reported on 15.6% of returns)
Here:
$1,780
State:
$4,753
Here:
3.0% of AGI
State:
4.2% of AGI
(% of AGI for various income ranges: 0.1% for AGIs below $10k, 0.3% for AGIs $10k-25k, 0.9% for AGIs $25k-50k, 1.4% for AGIs $50k-75k, 1.7% for AGIs $75k-100k, 1.5% for AGIs over 100k)
Total tax: $3,031 (reported on 54.1% of returns)
79938:
$3,031
State:
$9,058
(% of AGI for various income ranges: 3.7% for AGIs below $10k, 2.9% for AGIs $10k-25k, 3.7% for AGIs $25k-50k, 6.5% for AGIs $50k-75k, 8.6% for AGIs $75k-100k, 14.4% for AGIs over 100k)
Earned income credit: $2,348 (reported on 46.2% of returns)
Here:
$2,348
State:
$2,024
Percentage of individuals using paid preparers for their 2004 taxes: 71.2%
Here:
71%
State:
57%
(% for various income ranges: 68.5% for AGIs below $10k, 76.6% for AGIs $10k-25k, 69.6% for AGIs $25k-50k, 66.4% for AGIs $50k-75k, 60.5% for AGIs $75k-100k, 62.9% for AGIs over 100k)
Household received Food Stamps/SNAP in the past 12 months: 5,509 Household did not receive Food Stamps/SNAP in the past 12 months: 23,808
Women who had a birth in the past 12 months: 2,112 (1,557 now married, 560 unmarried) Women who did not have a birth in the past 12 months: 22,848 (13,687 now married, 9,046 unmarried)
Housing units in zip code 79938 with a mortgage: 17,109 (343 second mortgage, 15 home equity loan, 248 both second mortgage and home equity loan) Houses without a mortgage: 293
Median monthly owner costs for units with a mortgage: $1,566 Median monthly owner costs for units without a mortgage: $550
Residents with income below the poverty level in 2022:
This zip code:
11.3%
Whole state:
14.0%
Residents with income below 50% of the poverty level in 2022:
This zip code:
5.3%
Whole state:
7.4%
Median number of rooms in houses and condos:
Here:
6.0
State:
6.3
Median number of rooms in apartments:
Here:
5.1
State:
4.0
Notable locations in this zip code not listed on our city pages
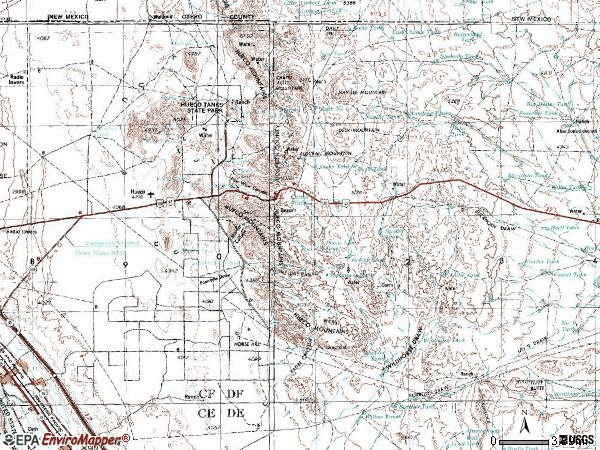
Notable locations in zip code 79938: Dagger Camp (A), Deep Well (B), Hueco Water Wells (C), The Hueco Club (D), Montana Vista Fire Rescue Station 2 (E), Hueco Volunteer Fire Department (F), Montana Vista Fire Rescue Station 1 (G). Display/hide their locations on the map
Lakes and reservoirs: Drag Tank (A), West Lake Tank (B), Tank Number One (C), Ross Tank (D), Ramons Tank (E), Naville Tank (F), Lincoln Tank (G), Jarilla Tank (H). Display/hide their locations on the map
Parks in zip code 79938 include: Hueco Tanks State Historical Park (1), Mountain View High School Softball Field (2), Mountain View High School Stadium (3), Mountain View High School Baseball Field (4). Display/hide their locations on the map
In group quarters: 3,101 (-1 institutionalized population)
Size of family households: 5,391 2-persons, 5,616 3-persons, 6,740 4-persons, 3,681 5-persons, 1,445 6-persons, 452 7-or-more-persons
Size of nonfamily households: 5,084 1-person, 404 2-persons, 43 3-persons
20,672 married couples with children.
7,923 single-parent households (1,894 men, 6,029 women).
34.5% of residents of 79938 zip code speak English at home.
63.1% of residents speak Spanish at home (68% very well, 16% well, 11% not well, 5% not at all).
0.6% of residents speak other Indo-European language at home (69% very well, 29% well, 2% not at all).
0.7% of residents speak Asian or Pacific Island language at home (69% very well, 20% well, 10% not well, 2% not at all).
0.3% of residents speak other language at home (68% very well, 32% well).
Foreign born population: 19,422 (19.8%) (54.8% of them are naturalized citizens)
This zip code:
19.8%
Whole state:
17.2%
81%Honduras
3%Belize
2%Dominica
1%Malaysia
1%France
1%Haiti
1%El Salvador
2%American
2%English
1%European
1%Irish
1%German
0%Jamaican
0%Italian
Year of entry for the foreign-born population
6,1692010 or later
4,2942000 to 2009
3,9801990 to 1999
7,531Before 1990
Facilities with environmental interests located in this zip code:
2000 AUTO SALVAGE (TXU010590) (12913 MONTANA AVE in EL PASO, TX)
Housing units lacking complete plumbing facilities: 1.2% Housing units lacking complete kitchen facilities: 1.1%
71.2%Utility gas
22.3%Electricity
5.5%Bottled, tank, or LP gas
Place of birth for U.S.-born residents:
This state: 54,449
Northeast: 1,914
Midwest: 3,405
South: 5,368
West: 10,796
59% of the 79938 zip code residents lived in the same house 5 years ago. Out of people who lived in different houses, 79% lived in this county. Out of people who lived in different counties, 50% lived in Texas.
86% of the 79938 zip code residents lived in the same house 1 year ago. Out of people who lived in different houses, 56% moved from this county. Out of people who lived in different houses, 12% moved from different county within same state. Out of people who lived in different houses, 22% moved from different state. Out of people who lived in different houses, 10% moved from abroad.
Private vs. public school enrollment:
Students in private schools in grades 1 to 8 (elementary and middle school): 908
Here:
6.3%
Texas:
8.8%
Students in private schools in grades 9 to 12 (high school): 74
Here:
1.1%
Texas:
8.0%
Students in private undergraduate colleges: 754
Here:
11.4%
Texas:
16.2%
Occupation by median earnings in the past 12 months ($)
96,572Law enforcement workers including supervisors
74,654Health diagnosing and treating practitioners and other technical occupations
71,896Management occupations
66,813Legal occupations
62,092Community and social service occupations
60,015Business and financial operations occupations
Companies with biggest federal contracts located in this zip code (EL PASO, TX):
CDE ENTERPRISES INC (14061 MONTANA AVENUE; small business) : $1,903,001 in 22 contractsfrom 1999 to 2003
Contracts for Maintenance, Repair or Alteration of Real Property -- Highways, Roads, Streets, Bridges, and Railways (includes resurfacing), Construction of Structures and Facilities -- Other Administrative Facilities and Service Buildings, Maintenance, Repair or Alteration of Real Property -- Office Buildings by Army, U.S. Army Corps of Engineers - civil program financing only, Public Buildings Service Signed by year:2000: $1,547,073; 2001: $70,490; 2002: $0; 2003: $191,564; 2004: $0; 2005: $0; 2006: $0.
Biggest contracts:
$203,023 with Army for Maintenance, Repair or Alteration of Real Property -- Highways, Roads, Streets, Bridges, and Railways (includes resurfacing). Taking place in NM. Signed on 2000-05-10. Completion date: 2000-09-30.
$191,564 with U.S. Army Corps of Engineers - civil program financing only for Construction of Structures and Facilities -- Other Administrative Facilities and Service Buildings. Signed on 2003-01-16. Completion date: 1998-09-01.
$181,013 with Army for Maintenance, Repair or Alteration of Real Property -- Highways, Roads, Streets, Bridges, and Railways (includes resurfacing). Taking place in NM. Signed on 2000-04-29. Completion date: 2000-06-23.
$157,130, same as above.Signed on 2000-03-30. Completion date: 2000-05-15.
J C VIRAMONTES INC (12651 MONTANA AVE; small business)
$125,760 with Army for Miscellaneous Service and Trade Equipment. Signed on 2005-11-18. Completion date: 2006-02-28.
CARNEY TRUCKING (15965 TRICIA RD; small business) : $112,350 in 25 contractsfrom 2002 to 2006
Contracts for Water Quality Support Services, Personal Care Services (includes such services as barber and beauty shop, shoe repairs, tailoring, etc.), Beverages, Nonalcoholic by Army Signed by year:2000: $0; 2001: $0; 2002: $8,320; 2003: $21,840; 2004: $51,164; 2005: $20,528; 2006: $10,498.
Biggest contracts:
$24,000 with Army for Water Quality Support Services. Signed on 2004-01-20. Completion date: 2004-01-12.
$9,393 with Army for Personal Care Services (includes such services as barber and beauty shop, shoe repairs, tailoring, etc.). Signed on 2004-06-14. Completion date: 2004-06-08.
$4,420, same as above.Signed on 2006-01-13. Completion date: 2005-11-02.
$4,420, same as above.Signed on 2006-05-04. Completion date: 2006-05-04.
COINDREAU, JAMES M (5061 FLAGER; small business) : $59,260 in 8 contractsin 2006
Contracts for Other Social Services by Army Signed by year:2000: $0; 2001: $0; 2002: $0; 2003: $0; 2004: $0; 2005: $0; 2006: $59,260.
Biggest contracts:
$22,153 with Army for Other Social Services. Signed on 2006-03-20. Completion date: 2006-09-30.
$12,606, same as above.Signed on 2006-03-28. Completion date: 2006-09-30.
$11,926, same as above.Signed on 2006-01-09. Completion date: 2006-01-31.
$7,665, same as above.Signed on 2006-02-03. Completion date: 2006-01-31.
BORDER SAN A CAN (4011 KELTON COURT; small business) : $45,580 in 7 contractsfrom 2001 to 2003
Contracts for Other Housekeeping Services by Army Signed by year:2000: $0; 2001: $30,000; 2002: $12,820; 2003: $2,760; 2004: $0; 2005: $0; 2006: $0.
Biggest contracts:
$30,000 with Army for Other Housekeeping Services. Signed on 2001-04-12. Completion date: 2001-04-12.
$7,125, same as above.Signed on 2002-06-25. Completion date: 2002-06-24.
$3,075, same as above.Signed on 2002-09-13. Completion date: 2002-09-15.
$3,036, same as above.Signed on 2002-11-02. Completion date: 2002-10-27.
BUCKINGHAM, DAN E (5434 DESERT WILLOW DR; small business) : $35,034 in 4 contractsin 2005
$24,709 with Army for Safety and Rescue Equipment. Signed on 2005-11-16. Completion date: 2006-09-30.
$8,200 with Army for Motor Pool Operations. Signed on 2005-08-28. Completion date: 2005-09-30.
$2,125, same as above.Signed on 2005-10-27. Completion date: 2005-09-30.
$0, same as above.Signed on 2005-10-27. Completion date: 2005-09-30.
WOLFE, SALLY (21277 HWY 62-180; small business) : $18,736 in 3 contractsin 2002
$6,263 with Army for Other Education and Training Services. Signed on 2002-12-09. Completion date: 2002-12-31.
$6,263, same as above.Signed on 2002-07-01. Completion date: 2002-06-30.
$6,210, same as above.Signed on 2002-04-22. Completion date: 2002-06-30.
JOHN C TORREZ (3013 TIERRA FRESNO DR; small business) : $16,110 in 5 contractsfrom 2002 to 2005
Contracts for Other Housekeeping Services, Education Services, Other Education and Training Services by Army Signed by year:2000: $0; 2001: $0; 2002: $9,666; 2003: $0; 2004: $9,666; 2005: -$3,222; 2006: $0.
Biggest contracts:
$9,666 with Army for Other Housekeeping Services. Signed on 2002-02-10. Completion date: 2003-01-27.
$6,444 with Army for Education Services. Signed on 2004-12-30. Completion date: 2005-03-11.
$6,444 with Army for Other Education and Training Services. Signed on 2004-01-09. Completion date: 2004-05-04.
-$3,222 with Army for Education Services. Signed on 2005-09-16. Completion date: 2005-03-11.
A C ELECTRIC (14949 DOE LN; small business) : $15,999 in 2 contractsin 2004
$12,219 with Army for Miscellaneous Furniture and Fixtures. Taking place in NM. Signed on 2004-07-01. Completion date: 2004-07-31.
$3,780 with Army for Maintenance, Repair and Rebuilding of Equipment -- Recreational and Athletic Equipment. Taking place in NM. Signed on 2004-06-01. Completion date: 2004-06-30.
DELUXE CUSTOMS SHUTTERS (15061 JACOB KUECHLER DR; small business)
$4,400 with Army for Construction of Structures and Facilities -- Miscellaneous Buildings. Signed on 2003-03-19. Completion date: 2003-04-04.
Top industries in this zip code by the number of employees in 2005:
Health Care and Social Assistance: Other Individual and Family Services (50-99 employees: 1 establishment)
Health Care and Social Assistance: Home Health Care Services (50-99: 1)
Construction: Plumbing, Heating, and Air-Conditioning Contractors (20-49: 1)
Other Services (except Public Administration): Commercial and Industrial Machinery and Equipment (except Automotive and Electronic) Repair and Maintenance (10-19: 1, 5-9: 2, 1-4: 2)
People in group quarters in 2010:
1,915 people in local jails and other municipal confinement facilities
1,087 people in state prisons
People in group quarters in 2000:
1,598 people in local jails and other confinement facilities (including police lockups)
1,029 people in state prisons
3 people in other workers' dormitories
Fatal accident statistics in 2014:
Fatal accident count: 5
Vehicles involved in fatal accidents: 6
Fatal accidents caused by drunken drivers: 6
Fatalities: 6
Persons involved in fatal accidents: 8
Pedestrians involved in fatal accidents: 0
Fatal accident statistics in 2013:
Fatal accident count: 3
Vehicles involved in fatal accidents: 4
Fatal accidents caused by drunken drivers: 1
Fatalities: 3
Persons involved in fatal accidents: 8
Pedestrians involved in fatal accidents: 1
Home Mortgage Disclosure Act Aggregated Statistics For Year 2009 (Based on 3 full and 4 partial tracts)
A) FHA, FSA/RHS & VA Home Purchase Loans
B) Conventional Home Purchase Loans
C) Refinancings
D) Home Improvement Loans
F) Non-occupant Loans on < 5 Family Dwellings (A B C & D)
G) Loans On Manufactured Home Dwelling (A B C & D)
Number
Average Value
Number
Average Value
Number
Average Value
Number
Average Value
Number
Average Value
Number
Average Value
LOANS ORIGINATED
1,296
$136,683
261
$119,941
988
$138,138
179
$16,352
86
$90,448
23
$42,036
APPLICATIONS APPROVED, NOT ACCEPTED
62
$136,713
30
$149,709
201
$140,278
35
$26,699
5
$114,640
7
$36,246
APPLICATIONS DENIED
218
$138,420
99
$89,205
861
$135,401
273
$29,990
61
$88,794
53
$50,272
APPLICATIONS WITHDRAWN
119
$138,820
37
$120,693
388
$141,964
39
$56,989
20
$89,358
1
$27,910
FILES CLOSED FOR INCOMPLETENESS
22
$140,983
13
$171,328
67
$144,472
6
$48,323
3
$108,100
1
$26,740
Aggregated Statistics For Year 2008 (Based on 3 full and 4 partial tracts)
A) FHA, FSA/RHS & VA Home Purchase Loans
B) Conventional Home Purchase Loans
C) Refinancings
D) Home Improvement Loans
E) Loans on Dwellings For 5+ Families
F) Non-occupant Loans on < 5 Family Dwellings (A B C & D)
G) Loans On Manufactured Home Dwelling (A B C & D)
Number
Average Value
Number
Average Value
Number
Average Value
Number
Average Value
Number
Average Value
Number
Average Value
Number
Average Value
LOANS ORIGINATED
938
$139,189
681
$133,346
793
$119,520
308
$22,849
0
$0
152
$118,665
23
$44,938
APPLICATIONS APPROVED, NOT ACCEPTED
69
$153,520
122
$128,138
218
$122,059
57
$52,429
0
$0
40
$102,166
27
$46,732
APPLICATIONS DENIED
257
$131,323
310
$129,298
1,239
$122,730
633
$58,755
2
$147,955
95
$97,318
36
$51,624
APPLICATIONS WITHDRAWN
123
$141,096
108
$143,600
352
$127,817
53
$80,466
0
$0
32
$80,206
5
$42,722
FILES CLOSED FOR INCOMPLETENESS
46
$137,144
41
$139,832
116
$122,943
14
$50,175
0
$0
8
$88,716
0
$0
Aggregated Statistics For Year 2007 (Based on 3 full and 4 partial tracts)
A) FHA, FSA/RHS & VA Home Purchase Loans
B) Conventional Home Purchase Loans
C) Refinancings
D) Home Improvement Loans
E) Loans on Dwellings For 5+ Families
F) Non-occupant Loans on < 5 Family Dwellings (A B C & D)
G) Loans On Manufactured Home Dwelling (A B C & D)
Number
Average Value
Number
Average Value
Number
Average Value
Number
Average Value
Number
Average Value
Number
Average Value
Number
Average Value
LOANS ORIGINATED
766
$138,530
2,369
$130,214
840
$116,377
461
$35,245
1
$2,372,690
326
$101,554
28
$54,384
APPLICATIONS APPROVED, NOT ACCEPTED
26
$155,640
330
$117,336
211
$113,985
119
$41,094
0
$0
70
$105,879
32
$51,442
APPLICATIONS DENIED
139
$135,544
740
$125,621
1,353
$116,167
701
$53,986
0
$0
174
$98,242
55
$46,420
APPLICATIONS WITHDRAWN
97
$144,722
506
$131,851
554
$118,096
121
$67,849
0
$0
84
$101,746
7
$38,601
FILES CLOSED FOR INCOMPLETENESS
9
$119,169
97
$137,435
169
$133,703
21
$37,475
0
$0
19
$128,851
0
$0
Aggregated Statistics For Year 2006 (Based on 3 full and 4 partial tracts)
A) FHA, FSA/RHS & VA Home Purchase Loans
B) Conventional Home Purchase Loans
C) Refinancings
D) Home Improvement Loans
F) Non-occupant Loans on < 5 Family Dwellings (A B C & D)
G) Loans On Manufactured Home Dwelling (A B C & D)
Number
Average Value
Number
Average Value
Number
Average Value
Number
Average Value
Number
Average Value
Number
Average Value
LOANS ORIGINATED
451
$137,418
2,912
$105,616
505
$106,528
402
$25,765
584
$87,972
26
$43,929
APPLICATIONS APPROVED, NOT ACCEPTED
10
$156,316
491
$99,930
210
$104,653
77
$26,059
105
$84,880
33
$62,968
APPLICATIONS DENIED
87
$120,938
792
$103,809
950
$101,895
584
$32,925
146
$80,585
66
$41,203
APPLICATIONS WITHDRAWN
94
$132,028
553
$108,796
606
$118,415
89
$53,955
106
$84,851
13
$48,649
FILES CLOSED FOR INCOMPLETENESS
0
$0
70
$138,900
163
$118,675
14
$32,435
11
$99,068
0
$0
Aggregated Statistics For Year 2005 (Based on 3 full and 4 partial tracts)
A) FHA, FSA/RHS & VA Home Purchase Loans
B) Conventional Home Purchase Loans
C) Refinancings
D) Home Improvement Loans
E) Loans on Dwellings For 5+ Families
F) Non-occupant Loans on < 5 Family Dwellings (A B C & D)
G) Loans On Manufactured Home Dwelling (A B C & D)
Number
Average Value
Number
Average Value
Number
Average Value
Number
Average Value
Number
Average Value
Number
Average Value
Number
Average Value
LOANS ORIGINATED
958
$112,928
2,354
$91,050
456
$97,269
265
$25,743
0
$0
401
$74,442
33
$51,069
APPLICATIONS APPROVED, NOT ACCEPTED
9
$111,066
348
$79,486
84
$84,592
45
$24,470
0
$0
27
$77,562
27
$48,568
APPLICATIONS DENIED
144
$101,161
509
$84,423
737
$86,117
261
$27,408
0
$0
102
$66,307
69
$42,549
APPLICATIONS WITHDRAWN
149
$114,545
434
$95,812
435
$110,694
133
$154,841
1
$1,132,570
101
$80,909
9
$41,549
FILES CLOSED FOR INCOMPLETENESS
4
$129,685
56
$88,465
92
$105,709
3
$14,573
0
$0
17
$73,398
0
$0
Aggregated Statistics For Year 2004 (Based on 3 full and 4 partial tracts)
A) FHA, FSA/RHS & VA Home Purchase Loans
B) Conventional Home Purchase Loans
C) Refinancings
D) Home Improvement Loans
F) Non-occupant Loans on < 5 Family Dwellings (A B C & D)
G) Loans On Manufactured Home Dwelling (A B C & D)
Number
Average Value
Number
Average Value
Number
Average Value
Number
Average Value
Number
Average Value
Number
Average Value
LOANS ORIGINATED
985
$103,104
1,052
$93,936
518
$82,478
147
$18,771
115
$76,821
23
$43,838
APPLICATIONS APPROVED, NOT ACCEPTED
26
$122,157
155
$85,411
75
$63,612
20
$39,892
13
$49,335
22
$35,410
APPLICATIONS DENIED
113
$95,791
308
$78,326
515
$77,270
163
$25,436
37
$70,806
68
$45,948
APPLICATIONS WITHDRAWN
102
$100,362
140
$97,732
310
$76,209
47
$23,010
28
$59,119
10
$40,313
FILES CLOSED FOR INCOMPLETENESS
3
$72,410
37
$106,988
63
$95,965
4
$49,942
4
$77,735
0
$0
Aggregated Statistics For Year 2003 (Based on 3 full and 4 partial tracts)
A) FHA, FSA/RHS & VA Home Purchase Loans
B) Conventional Home Purchase Loans
C) Refinancings
D) Home Improvement Loans
E) Loans on Dwellings For 5+ Families
F) Non-occupant Loans on < 5 Family Dwellings (A B C & D)
Number
Average Value
Number
Average Value
Number
Average Value
Number
Average Value
Number
Average Value
Number
Average Value
LOANS ORIGINATED
1,093
$89,166
607
$86,011
599
$82,355
84
$10,781
1
$1,046,520
46
$62,615
APPLICATIONS APPROVED, NOT ACCEPTED
35
$89,304
82
$79,377
78
$77,892
18
$16,377
0
$0
8
$80,504
APPLICATIONS DENIED
227
$77,395
190
$70,749
380
$67,934
93
$11,324
0
$0
29
$55,488
APPLICATIONS WITHDRAWN
130
$83,407
91
$83,433
235
$76,572
19
$14,657
0
$0
15
$67,029
FILES CLOSED FOR INCOMPLETENESS
5
$76,646
30
$86,541
30
$73,009
1
$58,140
0
$0
2
$64,980
Aggregated Statistics For Year 1999 (Based on 2 partial tracts)
A) FHA, FSA/RHS & VA Home Purchase Loans
B) Conventional Home Purchase Loans
C) Refinancings
D) Home Improvement Loans
E) Loans on Dwellings For 5+ Families
F) Non-occupant Loans on < 5 Family Dwellings (A B C & D)
2002 - 2018 National Fire Incident Reporting System (NFIRS) incidents
According to the data from the years 2002 - 2018 the average number of fires per year is 120. The highest number of reported fires - 220 took place in 2005, and the least - 31 in 2003. The data has a rising trend.
When looking into fire subcategories, the most incidents belonged to: Outside Fires (48.7%), and Structure Fires (30.9%).
Fire incident types reported to NFIRS in Zip Code 79938


 Nearest zip codes: 79928, 79936, 79836, 79927, 79935, 79907.


 According to the data from the years 2002 - 2018 the average number of fires per year is 120. The highest number of reported fires - 220 took place in 2005, and the least - 31 in 2003. The data has a rising trend.
 When looking into fire subcategories, the most incidents belonged to: Outside Fires (48.7%), and Structure Fires (30.9%).