Estimated zip code population in 2022: 59,121 Zip code population in 2010: 56,741 Zip code population in 2000: 40,824
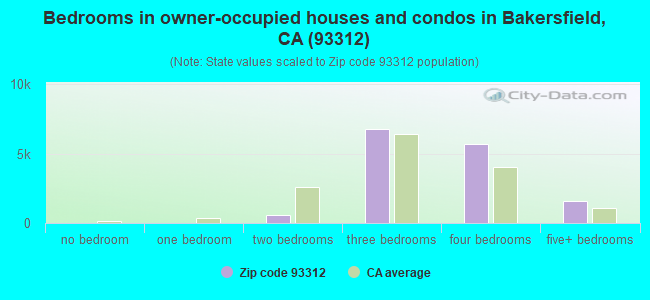
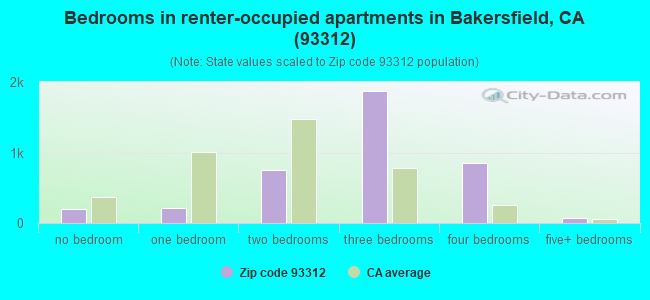
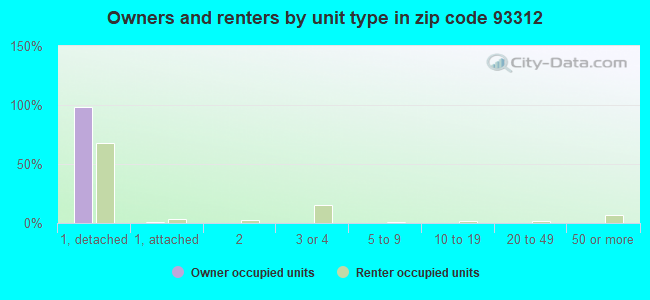
Houses and condos: 19,041 Renter-occupied apartments: 3,944
% of renters here:
21%
State:
44%
March 2022 cost of living index in zip code 93312: 92.3 (less than average, U.S. average is 100)
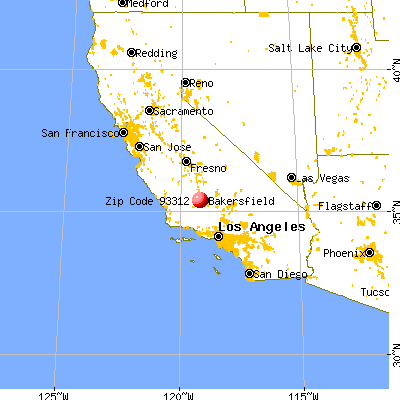
Land area: 15.2 sq. mi. Water area: 0.0 sq. mi.
Population density: 3,885 people per square mile
(average).
OSM Map
General Map
Google Map
MSN Map
OSM Map
General Map
Google Map
MSN Map
OSM Map
General Map
Google Map
MSN Map
OSM Map
General Map
Google Map
MSN Map
Please wait while loading the map...
Real estate property taxes paid for housing units in 2022:
This zip code:
1.1% ($4,531)
California:
0.7% ($4,831)
Median real estate property taxes paid for housing units with mortgages in 2022: $4,538 (1.1%) Median real estate property taxes paid for housing units with no mortgage in 2022: $4,687 (1.1%)
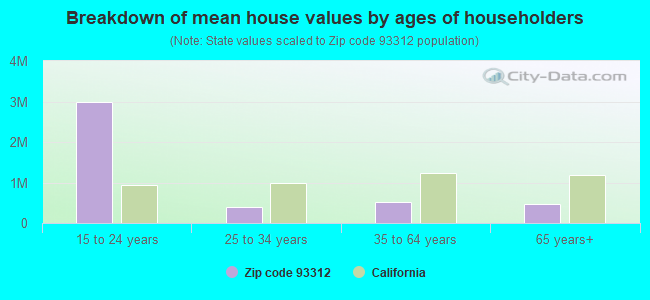
Estimated median house/condo value in 2022: $415,663
93312:
$415,663
California:
$715,900
According to our research of California and other state lists, there were 36 registered sex offenders living in 93312 zip code as of May 29, 2024. The ratio of all residents to sex offenders in zip code 93312 is 1,637 to 1. The ratio of registered sex offenders to all residents in this zip code is much lower than the state average.
Median resident age:
This zip code:
34.1 years
California median age:
37.9 years
Average household size:
This zip code:
3.2 people
California:
2.8 people
Averages for the 2020 tax year for zip code 93312, filed in 2021:
Average Adjusted Gross Income (AGI) in 2020: $84,073 (Individual Income Tax Returns)
Here:
$84,073
State:
$95,910
Salary/wage: $74,730 (reported on 83.2% of returns)
Here:
$74,730
State:
$77,331
(% of AGI for various income ranges: 1206.9% for AGIs below $25k, 3738.5% for AGIs $25k-50k, 7105.9% for AGIs $50k-75k, 10627.2% for AGIs $75k-100k, 21556.0% for AGIs $100k-200k, 76372.3% for AGIs over 200k)
Taxable interest for individuals: $984 (reported on 43.9% of returns)
This zip code:
$984
California:
$2,294
(% of AGI for various income ranges: 12.6% for AGIs below $25k, 16.2% for AGIs $25k-50k, 31.5% for AGIs $50k-75k, 45.5% for AGIs $75k-100k, 78.4% for AGIs $100k-200k, 1229.2% for AGIs over 200k)
Ordinary dividends: $5,842 (reported on 14.3% of returns)
Here:
$5,842
State:
$10,949
(% of AGI for various income ranges: 20.5% for AGIs below $25k, 37.3% for AGIs $25k-50k, 40.9% for AGIs $50k-75k, 91.2% for AGIs $75k-100k, 131.4% for AGIs $100k-200k, 2582.1% for AGIs over 200k)
Net capital gain/loss in AGI: +$16,607 (reported on 15.3% of returns)
Here:
+$16,607
State:
+$49,306
(% of AGI for various income ranges: 3.8% for AGIs below $25k, 19.9% for AGIs $25k-50k, 51.2% for AGIs $50k-75k, 89.8% for AGIs $75k-100k, 226.7% for AGIs $100k-200k, 11335.2% for AGIs over 200k)
Profit/loss from business: +$9,952 (reported on 17.2% of returns)
Here:
+$9,952
State:
+$15,671
(% of AGI for various income ranges: 114.2% for AGIs below $25k, 194.1% for AGIs $25k-50k, 242.1% for AGIs $50k-75k, 227.4% for AGIs $75k-100k, 296.7% for AGIs $100k-200k, 2649.0% for AGIs over 200k)
Taxable individual retirement arrangement distribution: $23,254 (reported on 6.7% of returns)
93312:
$23,254
California:
$23,505
(% of AGI for various income ranges: 43.7% for AGIs below $25k, 95.6% for AGIs $25k-50k, 191.4% for AGIs $50k-75k, 270.5% for AGIs $75k-100k, 494.6% for AGIs $100k-200k, 2043.3% for AGIs over 200k)
Self-employed (Keogh) retirement plans: $24,817 (reported on 0.5% of returns)
93312:
$24,817
California:
$30,163
(% of AGI for various income ranges: 26.3% for AGIs $100k-200k, 450.8% for AGIs over 200k)
Total itemized deductions: $29,662 (reported on 18.3% of returns)
Here:
$29,662
State:
$39,517
(% of AGI for various income ranges: 89.9% for AGIs below $25k, 214.3% for AGIs $25k-50k, 596.8% for AGIs $50k-75k, 988.5% for AGIs $75k-100k, 1887.2% for AGIs $100k-200k, 7430.6% for AGIs over 200k)
Charity contributions: $8,103 (reported on 16.1% of returns)
Here:
$8,103
State:
$12,598
(% of AGI for various income ranges: 5.6% for AGIs below $25k, 28.3% for AGIs $25k-50k, 83.4% for AGIs $50k-75k, 160.8% for AGIs $75k-100k, 438.4% for AGIs $100k-200k, 2816.9% for AGIs over 200k)
Taxes paid: $8,759 (reported on 18.3% of returns)
93312:
$8,759
State:
$8,807
(% of AGI for various income ranges: 18.8% for AGIs below $25k, 52.9% for AGIs $25k-50k, 186.2% for AGIs $50k-75k, 338.0% for AGIs $75k-100k, 617.2% for AGIs $100k-200k, 1714.8% for AGIs over 200k)
Earned income credit: $2,141 (reported on 11.7% of returns)
Here:
$2,141
State:
$2,074
(% of AGI for various income ranges: 81.7% for AGIs below $25k, 79.6% for AGIs $25k-50k, 1.7% for AGIs $50k-75k)
Percentage of individuals using paid preparers for their 2020 taxes: 94.9%
Here:
95%
State:
92%
(% for various income ranges: 94.1% for AGIs below $25k, 94.5% for AGIs $25k-50k, 94.8% for AGIs $50k-75k, 94.6% for AGIs $75k-100k, 95.7% for AGIs $100k-200k, 96.4% for AGIs over 200k)
Averages for the 2012 tax year for zip code 93312, filed in 2013:
Average Adjusted Gross Income (AGI) in 2012: $78,760 (Individual Income Tax Returns)
Here:
$78,760
State:
$72,726
Salary/wage: $70,680 (reported on 87.3% of returns)
Here:
$70,680
State:
$59,079
(% of AGI for various income ranges: 76.0% for AGIs below $25k, 78.2% for AGIs $25k-50k, 83.3% for AGIs $50k-75k, 84.2% for AGIs $75k-100k, 85.3% for AGIs $100k-200k, 58.0% for AGIs over 200k)
Taxable interest for individuals: $790 (reported on 45.6% of returns)
This zip code:
$790
California:
$2,146
(% of AGI for various income ranges: 1.0% for AGIs below $25k, 0.5% for AGIs $25k-50k, 0.4% for AGIs $50k-75k, 0.3% for AGIs $75k-100k, 0.3% for AGIs $100k-200k, 0.8% for AGIs over 200k)
Ordinary dividends: $3,927 (reported on 14.2% of returns)
Here:
$3,927
State:
$9,308
(% of AGI for various income ranges: 0.9% for AGIs below $25k, 0.8% for AGIs $25k-50k, 0.5% for AGIs $50k-75k, 0.5% for AGIs $75k-100k, 0.4% for AGIs $100k-200k, 1.6% for AGIs over 200k)
Net capital gain/loss in AGI: +$8,682 (reported on 12.5% of returns)
Here:
+$8,682
State:
+$30,460
(% of AGI for various income ranges: 0.1% for AGIs $50k-75k, 0.1% for AGIs $75k-100k, 0.3% for AGIs $100k-200k, 6.0% for AGIs over 200k)
Profit/loss from business: +$16,535 (reported on 16.9% of returns)
Here:
+$16,535
State:
+$17,064
(% of AGI for various income ranges: 10.8% for AGIs below $25k, 6.1% for AGIs $25k-50k, 2.3% for AGIs $50k-75k, 2.3% for AGIs $75k-100k, 2.7% for AGIs $100k-200k, 4.5% for AGIs over 200k)
Taxable individual retirement arrangement distribution: $17,433 (reported on 6.9% of returns)
93312:
$17,433
California:
$19,557
(% of AGI for various income ranges: 2.4% for AGIs below $25k, 2.2% for AGIs $25k-50k, 1.6% for AGIs $50k-75k, 1.5% for AGIs $75k-100k, 1.5% for AGIs $100k-200k, 1.2% for AGIs over 200k)
Self-employment retirement plans: $26,720 (reported on 0.7% of returns)
93312:
$26,720
California:
$24,530
(% of AGI for various income ranges: 0.1% for AGIs $50k-75k, 0.1% for AGIs $100k-200k, 0.7% for AGIs over 200k)
Total itemized deductions: $27,131 (23% of AGI, reported on 54.4% of returns)
Here:
$27,131
State:
$34,004
Here:
23.3% of AGI
State:
22.7% of AGI
(% of AGI for various income ranges: 13.7% for AGIs below $25k, 15.7% for AGIs $25k-50k, 18.9% for AGIs $50k-75k, 19.8% for AGIs $75k-100k, 20.3% for AGIs $100k-200k, 16.8% for AGIs over 200k)
Charity contributions: $3,651 (reported on 47.6% of returns)
Here:
$3,651
State:
$4,659
(% of AGI for various income ranges: 0.9% for AGIs below $25k, 1.5% for AGIs $25k-50k, 2.0% for AGIs $50k-75k, 2.2% for AGIs $75k-100k, 2.5% for AGIs $100k-200k, 2.3% for AGIs over 200k)
Taxes paid: $10,146 (reported on 54.3% of returns)
93312:
$10,146
State:
$14,448
(% of AGI for various income ranges: 2.8% for AGIs below $25k, 3.8% for AGIs $25k-50k, 5.3% for AGIs $50k-75k, 6.4% for AGIs $75k-100k, 7.5% for AGIs $100k-200k, 9.5% for AGIs over 200k)
Earned income credit: $2,169 (reported on 11.4% of returns)
Here:
$2,169
State:
$2,286
(% of AGI for various income ranges: 5.6% for AGIs below $25k, 1.1% for AGIs $25k-50k)
Percentage of individuals using paid preparers for their 2012 taxes: 66.8%
Here:
67%
State:
64%
(% for various income ranges: 56.3% for AGIs below $25k, 63.3% for AGIs $25k-50k, 69.2% for AGIs $50k-75k, 71.5% for AGIs $75k-100k, 74.1% for AGIs $100k-200k, 81.2% for AGIs over 200k)
Averages for the 2004 tax year for zip code 93312, filed in 2005:
Average Adjusted Gross Income (AGI) in 2004: $62,746 (Individual Income Tax Returns)
Here:
$62,746
State:
$58,600
Salary/wage: $57,292 (reported on 87.9% of returns)
Here:
$57,292
State:
$49,455
(% of AGI for various income ranges: 150.8% for AGIs below $10k, 74.2% for AGIs $10k-25k, 81.6% for AGIs $25k-50k, 86.5% for AGIs $50k-75k, 87.5% for AGIs $75k-100k, 73.1% for AGIs over 100k)
Taxable interest for individuals: $953 (reported on 61.6% of returns)
This zip code:
$953
California:
$2,365
(% of AGI for various income ranges: 7.8% for AGIs below $10k, 2.2% for AGIs $10k-25k, 1.2% for AGIs $25k-50k, 0.7% for AGIs $50k-75k, 0.6% for AGIs $75k-100k, 0.9% for AGIs over 100k)
Taxable dividends: $1,961 (reported on 19.1% of returns)
Here:
$1,961
State:
$4,746
(% of AGI for various income ranges: 3.7% for AGIs below $10k, 1.3% for AGIs $10k-25k, 0.5% for AGIs $25k-50k, 0.5% for AGIs $50k-75k, 0.3% for AGIs $75k-100k, 0.7% for AGIs over 100k)
Net capital gain/loss: +$12,509 (reported on 16.8% of returns)
Here:
+$12,509
State:
+$23,418
(% of AGI for various income ranges: 0.4% for AGIs below $10k, 0.4% for AGIs $10k-25k, 0.4% for AGIs $25k-50k, 0.7% for AGIs $50k-75k, 1.3% for AGIs $75k-100k, 6.7% for AGIs over 100k)
Profit/loss from business: +$14,074 (reported on 18.9% of returns)
Here:
+$14,074
State:
+$16,826
(% of AGI for various income ranges: -9.3% for AGIs below $10k, 9.3% for AGIs $10k-25k, 5.8% for AGIs $25k-50k, 3.1% for AGIs $50k-75k, 3.2% for AGIs $75k-100k, 4.6% for AGIs over 100k)
IRA payment deduction: $3,319 (reported on 2.8% of returns)
93312:
$3,319
California:
$3,192
(% of AGI for various income ranges: 0.4% for AGIs below $10k, 0.2% for AGIs $10k-25k, 0.2% for AGIs $25k-50k, 0.2% for AGIs $50k-75k, 0.1% for AGIs $75k-100k, 0.1% for AGIs over 100k)
Self-employed pension: $16,829 (reported on 1.0% of returns)
Here:
$16,829
California:
$17,688
(% of AGI for various income ranges: 0.1% for AGIs $25k-50k, 0.1% for AGIs $50k-75k, 0.2% for AGIs $75k-100k, 0.5% for AGIs over 100k)
Total itemized deductions: $23,348 (27% of AGI, reported on 61.9% of returns)
Here:
$23,348
State:
$28,113
Here:
26.7% of AGI
State:
25.3% of AGI
(% of AGI for various income ranges: 28.1% for AGIs below $10k, 16.9% for AGIs $10k-25k, 25.1% for AGIs $25k-50k, 27.3% for AGIs $50k-75k, 24.9% for AGIs $75k-100k, 20.1% for AGIs over 100k)
Charity contributions deductions: $3,149 (4% of AGI, reported on 57.1% of returns)
Here:
$3,149
State:
$3,923
Here:
3.5% of AGI
State:
3.3% of AGI
(% of AGI for various income ranges: 1.7% for AGIs below $10k, 1.5% for AGIs $10k-25k, 2.6% for AGIs $25k-50k, 3.1% for AGIs $50k-75k, 3.1% for AGIs $75k-100k, 2.9% for AGIs over 100k)
Total tax: $8,428 (reported on 82.1% of returns)
93312:
$8,428
State:
$10,761
(% of AGI for various income ranges: 5.6% for AGIs below $10k, 4.7% for AGIs $10k-25k, 6.0% for AGIs $25k-50k, 7.0% for AGIs $50k-75k, 8.6% for AGIs $75k-100k, 16.1% for AGIs over 100k)
Earned income credit: $1,686 (reported on 9.8% of returns)
Here:
$1,686
State:
$1,763
Percentage of individuals using paid preparers for their 2004 taxes: 68.5%
Here:
68%
State:
66%
(% for various income ranges: 54.1% for AGIs below $10k, 63.0% for AGIs $10k-25k, 69.6% for AGIs $25k-50k, 72.3% for AGIs $50k-75k, 73.7% for AGIs $75k-100k, 74.9% for AGIs over 100k)
Likely homosexual households (counted as self-reported same-sex unmarried-partner households)
Lesbian couples: 0.0% of all households
Gay men: 0.1% of all households
Household received Food Stamps/SNAP in the past 12 months: 1,378 Household did not receive Food Stamps/SNAP in the past 12 months: 16,896
Women who had a birth in the past 12 months: 1,112 (771 now married, 340 unmarried) Women who did not have a birth in the past 12 months: 13,145 (6,854 now married, 6,222 unmarried)
Housing units in zip code 93312 with a mortgage: 11,190 (742 second mortgage, 22 home equity loan, 358 both second mortgage and home equity loan) Houses without a mortgage: 82
Median monthly owner costs for units with a mortgage: $2,098 Median monthly owner costs for units without a mortgage: $745
Residents with income below the poverty level in 2022:
This zip code:
9.0%
Whole state:
12.2%
Residents with income below 50% of the poverty level in 2022:
This zip code:
5.7%
Whole state:
6.2%
Median number of rooms in houses and condos:
Here:
6.4
State:
6.0
Median number of rooms in apartments:
Here:
5.1
State:
3.9
Notable locations in this zip code not listed on our city pages
Notable locations in zip code 93312: Kern County Fire Department Station 65 Greenacres (A), Rosedale School District Office (B). Display/hide their locations on the map
Churches in zip code 93312 include: Apostolic Church (A), Calloway Drive Baptist Church (B), Community Church of Life (C), Highland Congregation Church of Christ (D), Rosedale Bible Church (E). Display/hide their locations on the map
12,207 married couples with children.
3,633 single-parent households (1,108 men, 2,525 women).
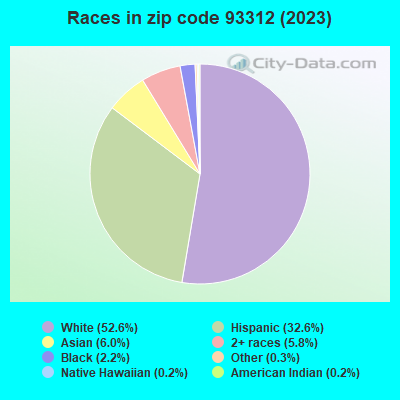
77.0% of residents of 93312 zip code speak English at home.
15.0% of residents speak Spanish at home (76% very well, 12% well, 8% not well, 4% not at all).
2.0% of residents speak other Indo-European language at home (72% very well, 13% well, 13% not well, 1% not at all).
4.0% of residents speak Asian or Pacific Island language at home (65% very well, 17% well, 18% not well).
1.3% of residents speak other language at home (75% very well, 14% well, 11% not well).
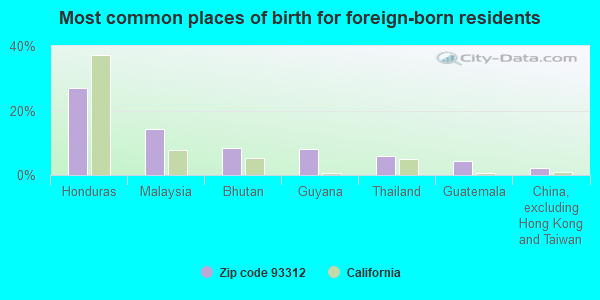
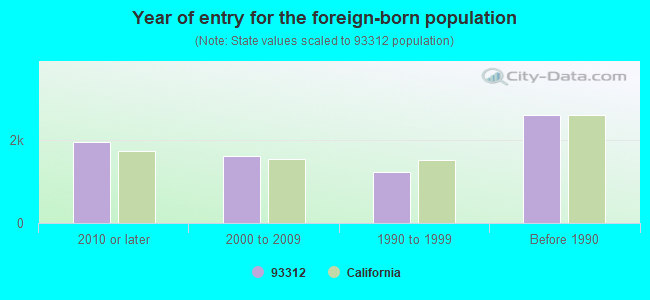
Foreign born population: 6,701 (11.3%) (59.3% of them are naturalized citizens)
This zip code:
11.3%
Whole state:
26.7%
27%Honduras
14%Malaysia
8%Bhutan
8%Guyana
6%Thailand
4%Guatemala
2%China, excluding Hong Kong and Taiwan
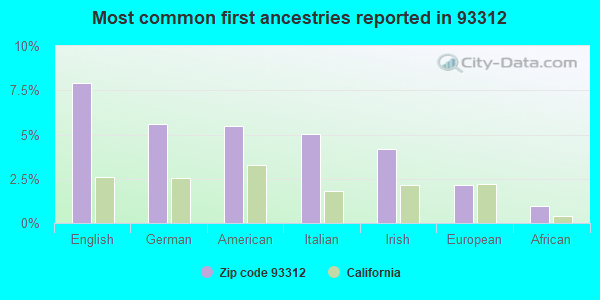
8%English
6%German
5%American
5%Italian
4%Irish
2%European
1%African
Year of entry for the foreign-born population
1,9472010 or later
1,6132000 to 2009
1,2181990 to 1999
2,599Before 1990
Major facilities with environmental interests located in this zip code:
HALLIBURTON SERVICES (34722 7TH STANDARD ROAD in BAKERSFIELD, CA)
STATE MASTER (California - Hazardous Waste Tracking) - HAZARDOU WASTE PROGRAM CRITERIA AND HAZARDOUS AIR POLLUTANT INVENTORY (Inventory of air pollution sources) Small Quantity Generators, between 100 kg and 1000 kg of hazardous waste/month (Resource Conservation and Recovery Act (tracking hazardous waste)) (Resource Conservation and Recovery Act (tracking hazardous waste)) Small Quantity Generators, between 100 kg and 1000 kg of hazardous waste/month (Resource Conservation and Recovery Act (tracking hazardous waste)) - notification Business SIC classification: OIL AND GAS FIELD SERVICES Organizations: HALLIBURTON COMPANY (CONTACT/OWNER)
, HALLIBURTON CO (CONTACT/OWNER)
Alternative names: HALLIBURTON ENERGY SERVICES
HONDO CHEMICALS (20807 STOCKDALE HIGHWAY in BAKERSFIELD, CA)
STATE MASTER (California - Hazardous Waste Tracking) - HAZARDOU WASTE PROGRAM COMPLIANCE ACTIVITY (Tracking inspections of insecticide, fungicide, and rodenticide, and toxic substances) CRITERIA AND HAZARDOUS AIR POLLUTANT INVENTORY (Inventory of air pollution sources) Small Quantity Generators, between 100 kg and 1000 kg of hazardous waste/month (Resource Conservation and Recovery Act (tracking hazardous waste)) TRI REPORTER (Tracking of toxic chemicals releasing facilities) Business SIC classification: INDUSTRIAL INORGANIC CHEMICALS; CHEMICALS AND ALLIED PRODUCTS Alternative names: HONDO INC., HONDO CHEMICAL INC STOCKDALE
CHEVRON STATION NO 205673 (13003 ROSEDALE HWY in BAKERSFIELD, CA)
STATE MASTER (California - Hazardous Waste Tracking) - HAZARDOU WASTE PROGRAM CRITERIA AND HAZARDOUS AIR POLLUTANT INVENTORY (Inventory of air pollution sources) Small Quantity Generators, between 100 kg and 1000 kg of hazardous waste/month (Resource Conservation and Recovery Act (tracking hazardous waste)) - notification Business SIC classification: GASOLINE SERVICE STATIONS Organizations: CHEVRON PRODUCTS CO (CONTACT/OWNER)
Alternative names: CHEVRON USA
GP TRANSPORTATION (10312 LONON AVE in BAKERSFIELD, CA)
STATE MASTER (California - Hazardous Waste Tracking) - HAZARDOU WASTE PROGRAM TRANSPORTER (Resource Conservation and Recovery Act (tracking hazardous waste)) Organizations: GEORGE PAQUETTE (CONTACT/OPERATOR)
KVS TRANSPORTATION INC (3752 ALLEN RD in BAKERSFIELD, CA)
STATE MASTER (California - Hazardous Waste Tracking) - HAZARDOU WASTE PROGRAM Small Quantity Generators, between 100 kg and 1000 kg of hazardous waste/month (Resource Conservation and Recovery Act (tracking hazardous waste)) Alternative names: KVS TRANSPORTATION INC KERN BACKHOE SERV
HOOD TRUCKING (12000 COTNER AVE in BAKERSFIELD, CA)
STATE MASTER (California - Hazardous Waste Tracking) - HAZARDOU WASTE PROGRAM TRANSPORTER (Resource Conservation and Recovery Act (tracking hazardous waste)) Organizations: DONNIE D HOOD (CONTACT/OWNER)
NORRIS MIDDLE (6940 CALLOWAY DR. in BAKERSFIELD, CA)
(National Center for Education Statistics) - STATE ID-6103493 Organizations: NORRIS ELEMENTARY (SCHOOL DISTRICT)
ALMONDALE ELEMENTARY (10510 CHIPPEWA in BAKERSFIELD, CA)
(National Center for Education Statistics) - STATE ID-6111686 Organizations: ROSEDALE UNION ELEMENTARY (SCHOOL DISTRICT)
ENDEAVOUR ELEMENTARY (9300 MEACHAM ROAD in BAKERSFIELD, CA)
(National Center for Education Statistics) - STATE ID-6112791 Organizations: FRUITVALE ELEMENTARY (SCHOOL DISTRICT)
FREEDOM MIDDLE (11445 NORIEGA in BAKERSFIELD, CA)
(National Center for Education Statistics) - STATE ID-6117717 Organizations: ROSEDALE UNION ELEMENTARY (SCHOOL DISTRICT)
FRUITVALE JUNIOR HIGH (2114 CALLOWAY DR. in BAKERSFIELD, CA)
(National Center for Education Statistics) - STATE ID-6104004 Organizations: FRUITVALE ELEMENTARY (SCHOOL DISTRICT)
CENTENNIAL HIGH (8601 HAGEMAN in BAKERSFIELD, CA)
(National Center for Education Statistics) - STATE ID-1530369 Organizations: KERN UNION HIGH (SCHOOL DISTRICT)
CENTENNIAL ELEMENTARY (15200 WESTDALE DR. in BAKERSFIELD, CA)
(National Center for Education Statistics) - STATE ID-6108781 Organizations: ROSEDALE UNION ELEMENTARY (SCHOOL DISTRICT)
Housing units lacking complete plumbing facilities: 0.1% Housing units lacking complete kitchen facilities: 0.7%
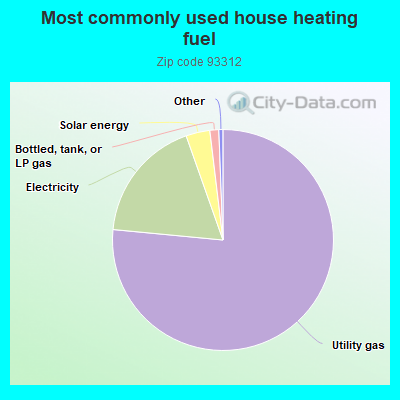
76.6%Utility gas
18.1%Electricity
3.5%Solar energy
1.3%Bottled, tank, or LP gas
Population in 1990: 15,935. Population change in the 1990s: +24,889 (+156.2%).
Place of birth for U.S.-born residents:
This state: 43,875
Northeast: 966
Midwest: 2,404
South: 2,718
West: 1,798
48% of the 93312 zip code residents lived in the same house 5 years ago. Out of people who lived in different houses, 74% lived in this county. Out of people who lived in different counties, 50% lived in California.
91% of the 93312 zip code residents lived in the same house 1 year ago. Out of people who lived in different houses, 66% moved from this county. Out of people who lived in different houses, 20% moved from different county within same state. Out of people who lived in different houses, 12% moved from different state. Out of people who lived in different houses, 3% moved from abroad.
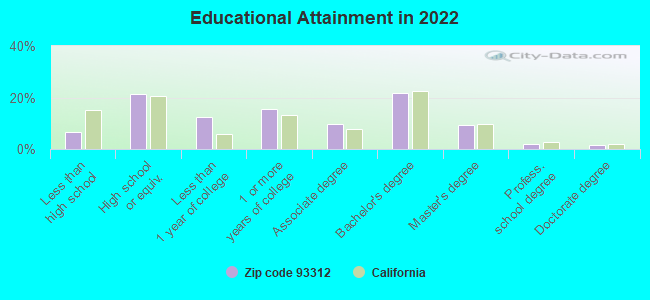
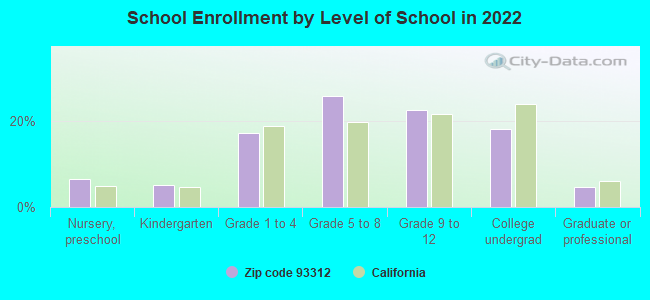
Private vs. public school enrollment:
Students in private schools in grades 1 to 8 (elementary and middle school): 902
Here:
11.4%
California:
10.5%
Students in private schools in grades 9 to 12 (high school): 390
Here:
9.4%
California:
8.5%
Students in private undergraduate colleges: 545
Here:
16.4%
California:
15.9%
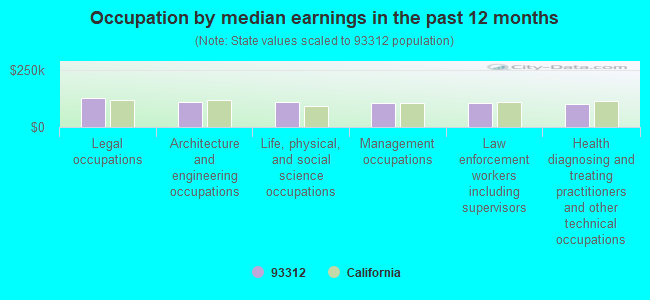
Occupation by median earnings in the past 12 months ($)
128,913Legal occupations
110,795Architecture and engineering occupations
110,736Life, physical, and social science occupations
107,177Management occupations
104,826Law enforcement workers including supervisors
100,447Health diagnosing and treating practitioners and other technical occupations
Companies with federal contracts located in this zip code (BAKERSFIELD, CA):
ITEPS LIMITED, INCORPORATED (4318 LAW WAY; small business) : $10,046,833 in 19 contractsfrom 1999 to 2005
Contracts for Operation of Government-Owned Facilities -- Fuel Storage Buildings, Land Surveys, Cadastral Services (non-construction), Lease or Rental of Facilities -- Fuel Storage Buildings, Fueling and Other Petroleum Services - Excluding Storage by Defense Logistics Agency, Army Signed by year:2000: $1,051,828; 2001: $670,268; 2002: $2,403,026; 2003: $185,000; 2004: $3,023,031; 2005: $2,651,280; 2006: $0.
Biggest contracts:
$2,651,280 with Defense Logistics Agency for Operation of Government-Owned Facilities -- Fuel Storage Buildings. Signed on 2005-09-28. Completion date: 2006-09-30.
$2,651,280, same as above.Signed on 2004-09-01. Completion date: 2006-09-30.
$2,360,526, same as above.Signed on 2002-09-10. Completion date: 2006-09-30.
$440,373, same as above.Signed on 2000-07-13. Completion date: 2000-08-31.
TUBULAR SALES & EQUIPMENT INC. (4000 ALLEN ROAD; small business)
$504,996 with Army for Pipe, Tube and Rigid Tubing. Taking place in NM. Signed on 2000-04-19. Completion date: 2000-05-01.
SUZANNE FLOM (9824 ENGER ST; small business) : $179,314 in 8 contractsfrom 2004 to 2005
Contracts for Sets, Kits, and Outfits of Hand Tools, ADP Support Equipment, Miscellaneous Office Machines, Office Supplies, and moreby Army, Air Force, Navy Signed by year:2000: $0; 2001: $0; 2002: $0; 2003: $0; 2004: $62,371; 2005: $116,943; 2006: $0.
Biggest contracts:
$68,212 with Army for Sets, Kits, and Outfits of Hand Tools. Signed on 2005-08-11. Completion date: 2005-08-30.
$57,660 with Army for ADP Support Equipment. Signed on 2004-09-30. Completion date: 2004-10-29.
$18,400 with Air Force for Miscellaneous Office Machines. Signed on 2005-09-16. Completion date: 2005-10-31.
$11,186 with Navy for Office Supplies. Signed on 2005-09-27. Completion date: 2005-11-30.
RICHARDS LAWN SERVICE (10512 DEE DEE AVENUE; small business) : $24,000 in 3 contractsfrom 2002 to 2003
$12,000 with Navy for Maintenance, Repair or Alteration of Real Property -- Other Non-Building Facilities. Signed on 2003-10-01. Completion date: 2004-09-30.
$12,000 with Navy for Landscaping/Groundskeeping Services. Taking place in LA. Signed on 2002-09-22. Completion date: 2003-09-30.
$0, same as above.Signed on 2002-09-22. Completion date: 2003-09-30.
Top industries in this zip code by the number of employees in 2005:
2005 - 2018 National Fire Incident Reporting System (NFIRS) incidents
Based on the data from the years 2005 - 2018 the average number of fires per year is 83. The highest number of fires - 165 took place in 2006, and the least - 0 in 2010. The data has a decreasing trend.
When looking into fire subcategories, the most incidents belonged to: Outside Fires (40.1%), and Structure Fires (38.9%).
Fire incident types reported to NFIRS in Zip Code 93312


 Nearest zip codes: 93309, 93301, 93304, 93314, 93305, 93263.


 Based on the data from the years 2005 - 2018 the average number of fires per year is 83. The highest number of fires - 165 took place in 2006, and the least - 0 in 2010. The data has a decreasing trend.
 When looking into fire subcategories, the most incidents belonged to: Outside Fires (40.1%), and Structure Fires (38.9%).