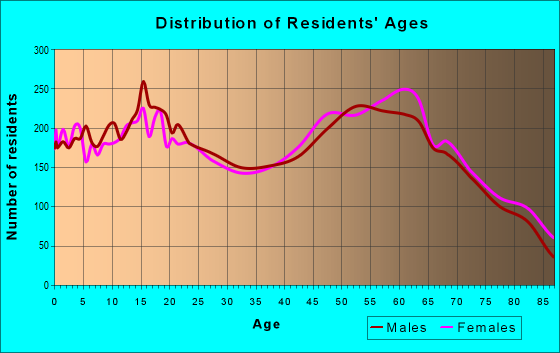
Estimated zip code population in 2022: 29,858 Zip code population in 2010: 30,643 Zip code population in 2000: 28,368
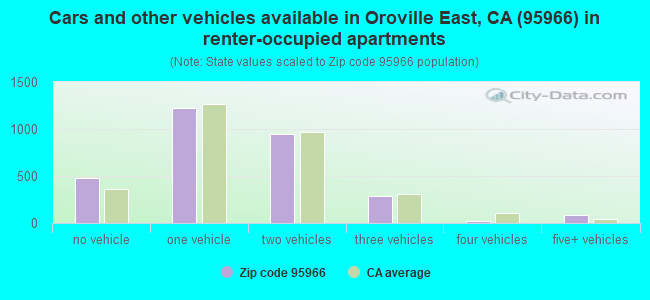
Houses and condos: 14,331 Renter-occupied apartments: 3,048
% of renters here:
25%
State:
44%
March 2022 cost of living index in zip code 95966: 94.3 (less than average, U.S. average is 100)
Land area: 184.1 sq. mi. Water area: 8.8 sq. mi.
Population density: 162 people per square mile
(very low).
OSM Map
General Map
Google Map
MSN Map
OSM Map
General Map
Google Map
MSN Map
OSM Map
General Map
Google Map
MSN Map
OSM Map
General Map
Google Map
MSN Map
Please wait while loading the map...
Real estate property taxes paid for housing units in 2022:
This zip code:
0.6% ($1,983)
California:
0.7% ($4,831)
Median real estate property taxes paid for housing units with mortgages in 2022: $2,333 (0.7%) Median real estate property taxes paid for housing units with no mortgage in 2022: $1,497 (0.6%)
Averages for the 2020 tax year for zip code 95966, filed in 2021:
Average Adjusted Gross Income (AGI) in 2020: $53,704 (Individual Income Tax Returns)
Here:
$53,704
State:
$95,910
Salary/wage: $45,998 (reported on 75.3% of returns)
Here:
$45,998
State:
$77,331
(% of AGI for various income ranges: 1088.5% for AGIs below $25k, 3331.7% for AGIs $25k-50k, 6252.4% for AGIs $50k-75k, 8836.7% for AGIs $75k-100k, 16567.1% for AGIs $100k-200k, 54625.0% for AGIs over 200k)
Taxable interest for individuals: $1,012 (reported on 30.2% of returns)
This zip code:
$1,012
California:
$2,294
(% of AGI for various income ranges: 17.3% for AGIs below $25k, 18.1% for AGIs $25k-50k, 47.5% for AGIs $50k-75k, 91.2% for AGIs $75k-100k, 144.2% for AGIs $100k-200k, 601.2% for AGIs over 200k)
Ordinary dividends: $4,376 (reported on 11.6% of returns)
Here:
$4,376
State:
$10,949
(% of AGI for various income ranges: 18.8% for AGIs below $25k, 31.1% for AGIs $25k-50k, 76.2% for AGIs $50k-75k, 160.8% for AGIs $75k-100k, 192.8% for AGIs $100k-200k, 1736.2% for AGIs over 200k)
Net capital gain/loss in AGI: +$13,109 (reported on 12.4% of returns)
Here:
+$13,109
State:
+$49,306
(% of AGI for various income ranges: 8.2% for AGIs below $25k, 31.6% for AGIs $25k-50k, 87.5% for AGIs $50k-75k, 137.4% for AGIs $75k-100k, 676.6% for AGIs $100k-200k, 14683.8% for AGIs over 200k)
Profit/loss from business: +$21,352 (reported on 12.3% of returns)
Here:
+$21,352
State:
+$15,671
(% of AGI for various income ranges: 77.9% for AGIs below $25k, 115.4% for AGIs $25k-50k, 348.1% for AGIs $50k-75k, 358.5% for AGIs $75k-100k, 809.3% for AGIs $100k-200k, 17726.2% for AGIs over 200k)
Taxable individual retirement arrangement distribution: $15,779 (reported on 7.1% of returns)
95966:
$15,779
California:
$23,505
(% of AGI for various income ranges: 43.5% for AGIs below $25k, 60.3% for AGIs $25k-50k, 151.4% for AGIs $50k-75k, 251.4% for AGIs $75k-100k, 676.8% for AGIs $100k-200k, 2767.5% for AGIs over 200k)
Self-employed (Keogh) retirement plans: $37,800 (reported on 0.3% of returns)
95966:
$37,800
California:
$30,163
(% of AGI for various income ranges: 43.5% for AGIs $75k-100k, 1531.2% for AGIs over 200k)
Total itemized deductions: $35,093 (reported on 7.1% of returns)
Here:
$35,093
State:
$39,517
(% of AGI for various income ranges: 74.1% for AGIs below $25k, 96.3% for AGIs $25k-50k, 414.4% for AGIs $50k-75k, 599.8% for AGIs $75k-100k, 1241.2% for AGIs $100k-200k, 9298.8% for AGIs over 200k)
Charity contributions: $9,640 (reported on 4.9% of returns)
Here:
$9,640
State:
$12,598
(% of AGI for various income ranges: 2.3% for AGIs below $25k, 8.0% for AGIs $25k-50k, 48.9% for AGIs $50k-75k, 106.4% for AGIs $75k-100k, 247.1% for AGIs $100k-200k, 2925.0% for AGIs over 200k)
Taxes paid: $7,062 (reported on 7.0% of returns)
95966:
$7,062
State:
$8,807
(% of AGI for various income ranges: 6.8% for AGIs below $25k, 17.3% for AGIs $25k-50k, 82.1% for AGIs $50k-75k, 149.5% for AGIs $75k-100k, 316.4% for AGIs $100k-200k, 1301.2% for AGIs over 200k)
Earned income credit: $2,160 (reported on 19.5% of returns)
Here:
$2,160
State:
$2,074
(% of AGI for various income ranges: 97.1% for AGIs below $25k, 83.0% for AGIs $25k-50k, 2.2% for AGIs $50k-75k)
Percentage of individuals using paid preparers for their 2020 taxes: 93.9%
Here:
94%
State:
92%
(% for various income ranges: 92.4% for AGIs below $25k, 95.2% for AGIs $25k-50k, 94.5% for AGIs $50k-75k, 94.2% for AGIs $75k-100k, 94.2% for AGIs $100k-200k, 92.6% for AGIs over 200k)
Averages for the 2012 tax year for zip code 95966, filed in 2013:
Average Adjusted Gross Income (AGI) in 2012: $43,795 (Individual Income Tax Returns)
Here:
$43,795
State:
$72,726
Salary/wage: $36,219 (reported on 75.8% of returns)
Here:
$36,219
State:
$59,079
(% of AGI for various income ranges: 67.6% for AGIs below $25k, 64.6% for AGIs $25k-50k, 62.4% for AGIs $50k-75k, 62.8% for AGIs $75k-100k, 66.9% for AGIs $100k-200k, 39.7% for AGIs over 200k)
Taxable interest for individuals: $1,495 (reported on 34.3% of returns)
This zip code:
$1,495
California:
$2,146
(% of AGI for various income ranges: 1.6% for AGIs below $25k, 1.0% for AGIs $25k-50k, 1.3% for AGIs $50k-75k, 0.7% for AGIs $75k-100k, 1.3% for AGIs $100k-200k, 1.1% for AGIs over 200k)
Ordinary dividends: $3,604 (reported on 15.1% of returns)
Here:
$3,604
State:
$9,308
(% of AGI for various income ranges: 1.3% for AGIs below $25k, 1.3% for AGIs $25k-50k, 1.1% for AGIs $50k-75k, 1.2% for AGIs $75k-100k, 1.0% for AGIs $100k-200k, 2.0% for AGIs over 200k)
Net capital gain/loss in AGI: +$5,070 (reported on 13.4% of returns)
Here:
+$5,070
State:
+$30,460
(% of AGI for various income ranges: 0.2% for AGIs $25k-50k, 0.3% for AGIs $50k-75k, 0.8% for AGIs $75k-100k, 1.4% for AGIs $100k-200k, 11.9% for AGIs over 200k)
Profit/loss from business: +$15,217 (reported on 13.5% of returns)
Here:
+$15,217
State:
+$17,064
(% of AGI for various income ranges: 6.5% for AGIs below $25k, 3.9% for AGIs $25k-50k, 2.7% for AGIs $50k-75k, 3.1% for AGIs $75k-100k, 3.7% for AGIs $100k-200k, 14.1% for AGIs over 200k)
Taxable individual retirement arrangement distribution: $13,038 (reported on 11.2% of returns)
95966:
$13,038
California:
$19,557
(% of AGI for various income ranges: 3.1% for AGIs below $25k, 2.7% for AGIs $25k-50k, 2.7% for AGIs $50k-75k, 3.7% for AGIs $75k-100k, 4.1% for AGIs $100k-200k, 3.9% for AGIs over 200k)
Self-employment retirement plans: $23,900 (reported on 0.4% of returns)
95966:
$23,900
California:
$24,530
Total itemized deductions: $20,676 (25% of AGI, reported on 27.3% of returns)
Here:
$20,676
State:
$34,004
Here:
25.1% of AGI
State:
22.7% of AGI
(% of AGI for various income ranges: 8.6% for AGIs below $25k, 10.1% for AGIs $25k-50k, 13.5% for AGIs $50k-75k, 14.1% for AGIs $75k-100k, 15.9% for AGIs $100k-200k, 14.2% for AGIs over 200k)
Charity contributions: $3,323 (reported on 20.8% of returns)
Here:
$3,323
State:
$4,659
(% of AGI for various income ranges: 0.7% for AGIs below $25k, 0.9% for AGIs $25k-50k, 1.7% for AGIs $50k-75k, 1.7% for AGIs $75k-100k, 2.0% for AGIs $100k-200k, 3.0% for AGIs over 200k)
Taxes paid: $6,310 (reported on 27.2% of returns)
95966:
$6,310
State:
$14,448
(% of AGI for various income ranges: 1.6% for AGIs below $25k, 2.0% for AGIs $25k-50k, 3.2% for AGIs $50k-75k, 4.0% for AGIs $75k-100k, 6.4% for AGIs $100k-200k, 6.7% for AGIs over 200k)
Earned income credit: $2,283 (reported on 24.2% of returns)
Here:
$2,283
State:
$2,286
(% of AGI for various income ranges: 7.6% for AGIs below $25k, 1.4% for AGIs $25k-50k)
Percentage of individuals using paid preparers for their 2012 taxes: 63.7%
Here:
64%
State:
64%
(% for various income ranges: 57.2% for AGIs below $25k, 65.6% for AGIs $25k-50k, 68.3% for AGIs $50k-75k, 72.6% for AGIs $75k-100k, 74.7% for AGIs $100k-200k, 81.8% for AGIs over 200k)
Averages for the 2004 tax year for zip code 95966, filed in 2005:
Average Adjusted Gross Income (AGI) in 2004: $37,232 (Individual Income Tax Returns)
Here:
$37,232
State:
$58,600
Salary/wage: $31,825 (reported on 75.6% of returns)
Here:
$31,825
State:
$49,455
(% of AGI for various income ranges: 119.2% for AGIs below $10k, 65.2% for AGIs $10k-25k, 68.5% for AGIs $25k-50k, 67.8% for AGIs $50k-75k, 69.7% for AGIs $75k-100k, 49.9% for AGIs over 100k)
Taxable interest for individuals: $1,911 (reported on 44.1% of returns)
This zip code:
$1,911
California:
$2,365
(% of AGI for various income ranges: 8.7% for AGIs below $10k, 3.4% for AGIs $10k-25k, 1.8% for AGIs $25k-50k, 1.6% for AGIs $50k-75k, 1.8% for AGIs $75k-100k, 2.6% for AGIs over 100k)
Taxable dividends: $2,808 (reported on 20.1% of returns)
Here:
$2,808
State:
$4,746
(% of AGI for various income ranges: 3.8% for AGIs below $10k, 1.6% for AGIs $10k-25k, 1.0% for AGIs $25k-50k, 0.9% for AGIs $50k-75k, 1.1% for AGIs $75k-100k, 2.7% for AGIs over 100k)
Net capital gain/loss: +$8,842 (reported on 18.4% of returns)
Here:
+$8,842
State:
+$23,418
(% of AGI for various income ranges: -2.0% for AGIs below $10k, 0.8% for AGIs $10k-25k, 0.9% for AGIs $25k-50k, 1.6% for AGIs $50k-75k, 3.1% for AGIs $75k-100k, 14.1% for AGIs over 100k)
Profit/loss from business: +$13,199 (reported on 14.6% of returns)
Here:
+$13,199
State:
+$16,826
(% of AGI for various income ranges: 8.0% for AGIs below $10k, 4.9% for AGIs $10k-25k, 3.3% for AGIs $25k-50k, 4.2% for AGIs $50k-75k, 4.1% for AGIs $75k-100k, 8.8% for AGIs over 100k)
IRA payment deduction: $3,445 (reported on 2.1% of returns)
95966:
$3,445
California:
$3,192
(% of AGI for various income ranges: 0.1% for AGIs $10k-25k, 0.2% for AGIs $25k-50k, 0.2% for AGIs $50k-75k, 0.2% for AGIs $75k-100k, 0.2% for AGIs over 100k)
Self-employed pension: $14,057 (reported on 0.7% of returns)
Here:
$14,057
California:
$17,688
Total itemized deductions: $17,822 (26% of AGI, reported on 29.2% of returns)
Here:
$17,822
State:
$28,113
Here:
26.2% of AGI
State:
25.3% of AGI
(% of AGI for various income ranges: 17.4% for AGIs below $10k, 9.3% for AGIs $10k-25k, 12.1% for AGIs $25k-50k, 15.0% for AGIs $50k-75k, 16.5% for AGIs $75k-100k, 15.9% for AGIs over 100k)
Charity contributions deductions: $2,908 (4% of AGI, reported on 24.2% of returns)
Here:
$2,908
State:
$3,923
Here:
4.1% of AGI
State:
3.3% of AGI
(% of AGI for various income ranges: 0.7% for AGIs below $10k, 1.0% for AGIs $10k-25k, 1.2% for AGIs $25k-50k, 1.9% for AGIs $50k-75k, 2.1% for AGIs $75k-100k, 3.0% for AGIs over 100k)
Total tax: $4,849 (reported on 71.6% of returns)
95966:
$4,849
State:
$10,761
(% of AGI for various income ranges: 3.3% for AGIs below $10k, 3.7% for AGIs $10k-25k, 6.2% for AGIs $25k-50k, 8.8% for AGIs $50k-75k, 10.4% for AGIs $75k-100k, 16.4% for AGIs over 100k)
Earned income credit: $1,642 (reported on 19.2% of returns)
Here:
$1,642
State:
$1,763
Percentage of individuals using paid preparers for their 2004 taxes: 67.0%
Here:
67%
State:
66%
(% for various income ranges: 57.2% for AGIs below $10k, 66.9% for AGIs $10k-25k, 67.9% for AGIs $25k-50k, 71.6% for AGIs $50k-75k, 71.7% for AGIs $75k-100k, 81.0% for AGIs over 100k)
Likely homosexual households (counted as self-reported same-sex unmarried-partner households)
Lesbian couples: 0.1% of all households
Gay men: 0.4% of all households
Household received Food Stamps/SNAP in the past 12 months: 2,441 Household did not receive Food Stamps/SNAP in the past 12 months: 9,936
Women who had a birth in the past 12 months: 367 (258 now married, 109 unmarried) Women who did not have a birth in the past 12 months: 5,368 (2,420 now married, 2,936 unmarried)
Housing units in zip code 95966 with a mortgage: 5,085 (437 second mortgage, 255 both second mortgage and home equity loan) Houses without a mortgage: 132
Median monthly owner costs for units with a mortgage: $1,579 Median monthly owner costs for units without a mortgage: $532
Residents with income below the poverty level in 2022:
This zip code:
15.4%
Whole state:
12.2%
Residents with income below 50% of the poverty level in 2022:
This zip code:
9.5%
Whole state:
6.2%
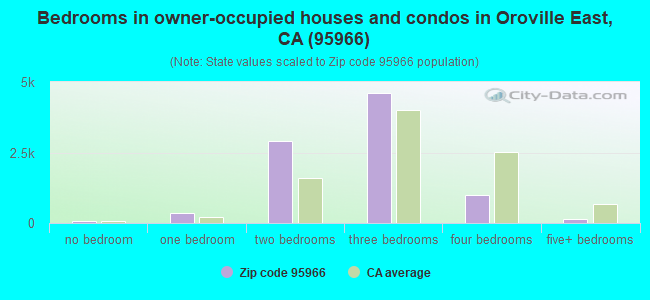
Median number of rooms in houses and condos:
Here:
5.6
State:
6.0
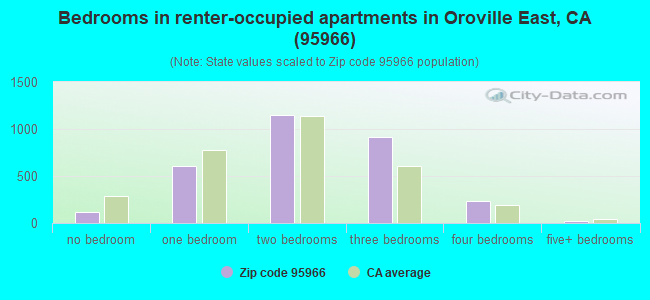
Median number of rooms in apartments:
Here:
4.5
State:
3.9
Notable locations in this zip code not listed on our city pages
Notable locations in zip code 95966: Lodestar Farms (A), Buffalo Ranch (B), Miners Ranch (C), Loafer Creek Campground (D), Wyandotte Substation (E), Bidwell Canyon Campground (F), Kelly Ridge Golf Course (G), Bidwell Canyon Marina (H), Palermo Substation (I), Lave Oroville Visitors Center (J), Butte County Library (K), Hurleton Fire Station (L), First Responder Emergency Medical Services Station 23 (M), First Responder Emergency Medical Services Station 22 (N), Kelly Ridge Fire Station (O), California Department of Forestry and Fire Protection Station 54 Robinson Mill (P), Berry Creek Rancheria Volunteer Fire Department (Q), Butte County Fire Department Station 66 (R), Butte County Fire Department Station 52 (S), Butte County Fire Department Station 64 (T). Display/hide their locations on the map
Churches in zip code 95966 include: Apostolic Church (A), Church of God in Christ (B), The Church of Jesus Christ of Latter Day Saints (C), Church of the Nazarene (D), First Christian Church (E), Grace Baptist Church (F), Holy Church of God (G), Oro Vista Baptist Church (H), Pentecostal Church of God (I). Display/hide their locations on the map
Streams, rivers, and creeks: Rocky Honcut Creek (A), Loafer Creek (B), Negro Creek (C), Sucker Run (D), Powell Creek (E), Nutmeg Creek (F), Sycamore Creek (G), McCabe Creek (H), Little Buckeye Creek (I). Display/hide their locations on the map
Parks in zip code 95966 include: Kelly Ridge Recreation Area (1), Loafer Creek Recreation Area (2), Craig Recreation Area (3), Sycamore Creek Recreation Area (4), Hewitt Park (5). Display/hide their locations on the map
4,166 married couples with children.
1,275 single-parent households (354 men, 921 women).
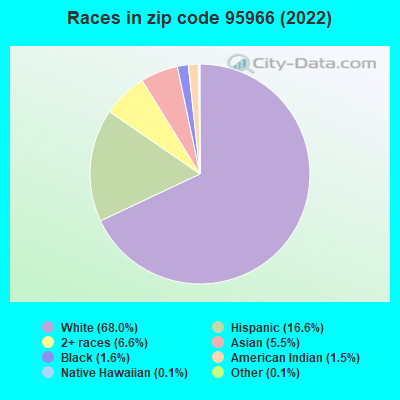
88.0% of residents of 95966 zip code speak English at home.
6.6% of residents speak Spanish at home (68% very well, 16% well, 11% not well, 5% not at all).
1.6% of residents speak other Indo-European language at home (89% very well, 11% well).
3.4% of residents speak Asian or Pacific Island language at home (53% very well, 24% well, 20% not well, 3% not at all).
0.3% of residents speak other language at home (56% very well, 22% well, 22% not well).
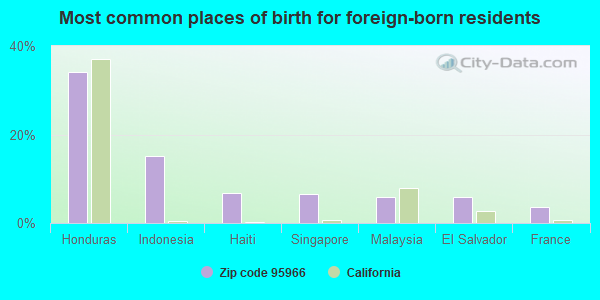
Foreign born population: 1,673 (5.6%) (61.0% of them are naturalized citizens)
This zip code:
5.6%
Whole state:
26.7%
34%Honduras
15%Indonesia
7%Haiti
7%Singapore
6%Malaysia
6%El Salvador
4%France
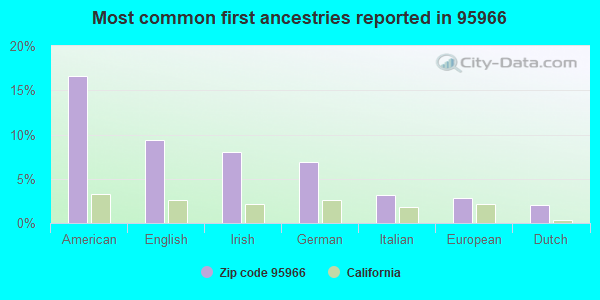
17%American
9%English
8%Irish
7%German
3%Italian
3%European
2%Dutch
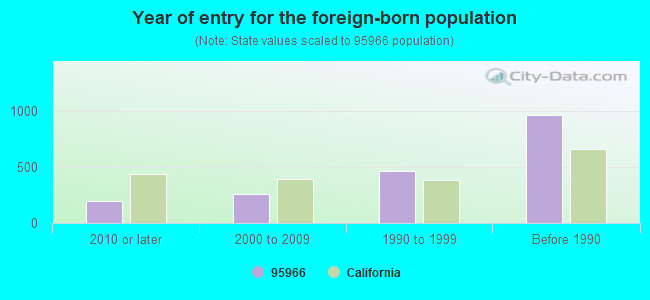
Year of entry for the foreign-born population
1952010 or later
2612000 to 2009
4631990 to 1999
968Before 1990
Facilities with environmental interests located in this zip code:
CHICO METAL FINISHING INCORPORATED (3151 RICHTER AVENUE in OROVILLE, CA)
STATE MASTER (California - Hazardous Waste Tracking) - HAZARDOU WASTE PROGRAM CRITERIA AND HAZARDOUS AIR POLLUTANT INVENTORY (Inventory of air pollution sources) HAZARDOUS WASTE BIENNIAL REPORTER (Resource Conservation and Recovery Act (tracking hazardous waste)) Large Quantity Generators, more that 1000 kg of hazardous waste/month (Resource Conservation and Recovery Act (tracking hazardous waste)) Business NAICS classification: ELECTROPLATING, PLATING, POLISHING, ANODIZING, AND COLORING. Organizations: CHICO METAL FINISHING, INC. (CONTACT/OPERATOR)
GOLDEN STATE AUTO BODY (1450 ORO DAM BLVD in OROVILLE, CA)
STATE MASTER (California - Hazardous Waste Tracking) - HAZARDOU WASTE PROGRAM CRITERIA AND HAZARDOUS AIR POLLUTANT INVENTORY (Inventory of air pollution sources) Small Quantity Generators, between 100 kg and 1000 kg of hazardous waste/month (Resource Conservation and Recovery Act (tracking hazardous waste)) - notification Business SIC classification: TOP, BODY, AND UPHOLSTERY REPAIR SHOPS AND PAINT SHOPS Organizations: GENE AVERY (CONTACT/OWNER)
LAS PLUMAS HIGH SCHOOL (2380 LAS PLUMAS AVE in OROVILLE, CA)
(National Center for Education Statistics) - STATE ID-0434803 Small Quantity Generators, between 100 kg and 1000 kg of hazardous waste/month (Resource Conservation and Recovery Act (tracking hazardous waste)) - notification Organizations: OROVILLE UNION HIGH SCHOOL DISTRICT (CONTACT/OWNER)
, OROVILLE UNION HIGH (SCHOOL DISTRICT)
7 ELEVEN STORE 14063 (3560 ORO DAM BLVD in OROVILLE, CA) . Federal Facility
STATE MASTER (California - Hazardous Waste Tracking) - HAZARDOU WASTE PROGRAM Small Quantity Generators, between 100 kg and 1000 kg of hazardous waste/month (Resource Conservation and Recovery Act (tracking hazardous waste)) Alternative names: SOUTHLAND CORP 7 ELEVEN #2201-14063
EASTSIDE ELEMENTARY (2775 YARD ST. in OROVILLE, CA)
(National Center for Education Statistics) - STATE ID-6003248 Organizations: OROVILLE CITY ELEMENTARY (SCHOOL DISTRICT)
FEATHER FALLS ELEMENTARY (2651 LUMPLKIN ROAD in OROVILLE, CA)
(National Center for Education Statistics) - STATE ID-6003123 Organizations: FEATHER FALLS UNION ELEMENTARY (SCHOOL DISTRICT)
HELEN M. WILCOX ELEMENTARY (5737 AUTREY LANE . in OROVILLE, CA)
(National Center for Education Statistics) - STATE ID-6003289 Organizations: PALERMO UNION ELEMENTARY (SCHOOL DISTRICT)
CENTRAL MIDDLE (2565 MESA AVE. in OROVILLE, CA)
(National Center for Education Statistics) - STATE ID-6003230 Organizations: OROVILLE CITY ELEMENTARY (SCHOOL DISTRICT)
CHALLENGE CHARTER HIGH (2425 MYERS ST in OROVILLE, CA)
(National Center for Education Statistics) - STATE ID-0430116 Organizations: OROVILLE UNION HIGH (SCHOOL DISTRICT)
ENERGY FUELS EXPLORATION CHEROKEE MINE (CHEROKEE MINE BUTTE COUNTY in OROVILLE, CA)
(Resource Conservation and Recovery Act (tracking hazardous waste)) Organizations: ROBERT W ADAMS (CONTACT/OWNER)
Alternative names: ENERGY FUELS EXPLRTN CHEROKEE MINE
Housing units lacking complete plumbing facilities: 1.5% Housing units lacking complete kitchen facilities: 2.7%
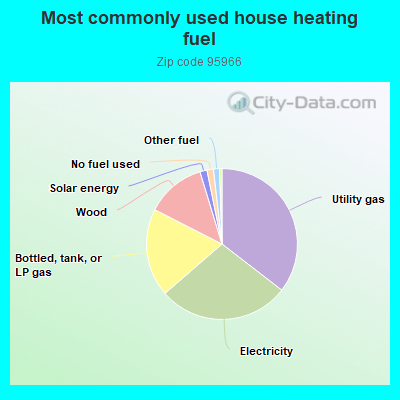
35.5%Utility gas
28.2%Electricity
18.9%Bottled, tank, or LP gas
12.8%Wood
1.5%Solar energy
1.4%No fuel used
1.3%Other fuel
Population in 1990: 27,286. Population change in the 1990s: +1,082 (+4.0%).
Place of birth for U.S.-born residents:
This state: 22,777
Northeast: 672
Midwest: 1,621
South: 1,468
West: 1,309
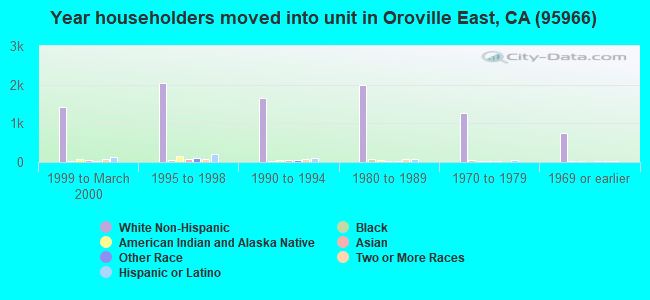
60% of the 95966 zip code residents lived in the same house 5 years ago. Out of people who lived in different houses, 64% lived in this county. Out of people who lived in different counties, 50% lived in California.
90% of the 95966 zip code residents lived in the same house 1 year ago. Out of people who lived in different houses, 69% moved from this county. Out of people who lived in different houses, 21% moved from different county within same state. Out of people who lived in different houses, 6% moved from different state. Out of people who lived in different houses, 2% moved from abroad.
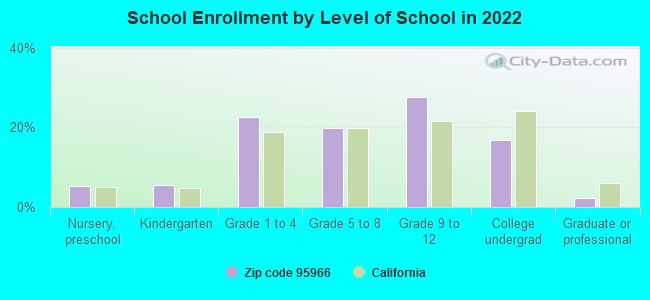
Private vs. public school enrollment:
Students in private schools in grades 1 to 8 (elementary and middle school): 364
Here:
14.5%
California:
10.5%
Students in private schools in grades 9 to 12 (high school): 90
Here:
5.5%
California:
8.5%
Students in private undergraduate colleges: 61
Here:
6.2%
California:
15.9%
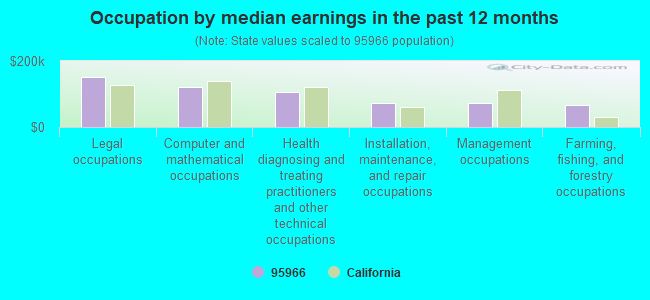
Occupation by median earnings in the past 12 months ($)
152,498Legal occupations
122,448Computer and mathematical occupations
105,646Health diagnosing and treating practitioners and other technical occupations
71,592Installation, maintenance, and repair occupations
71,407Management occupations
67,536Farming, fishing, and forestry occupations
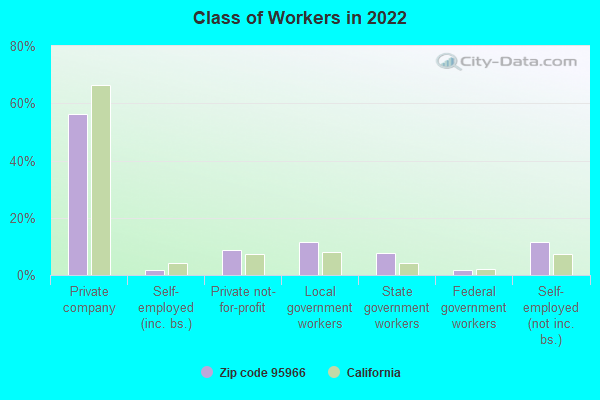
Top industries in this zip code by the number of employees in 2005:
Health Care and Social Assistance: General Medical and Surgical Hospitals (500-999 employees: 1 establishment)
Arts, Entertainment, and Recreation: Casinos (except Casino Hotels) (500-999: 1)
Arts, Entertainment, and Recreation: Other Gambling Industries (250-499: 1)
2003 - 2018 National Fire Incident Reporting System (NFIRS) incidents
Based on the data from the years 2003 - 2018 the average number of fires per year is 128. The highest number of reported fires - 269 took place in 2005, and the least - 9 in 2004. The data has a dropping trend.
When looking into fire subcategories, the most incidents belonged to: Outside Fires (52.2%), and Structure Fires (29.2%).
Fire incident types reported to NFIRS in Zip Code 95966
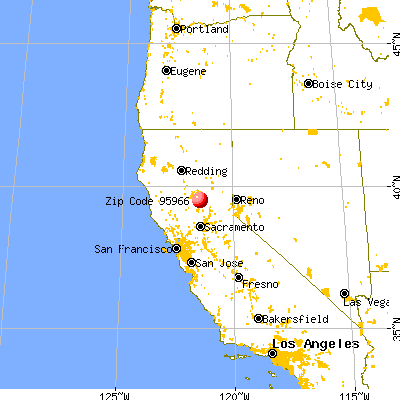


 Nearest zip codes: 95914, 95968, 95919, 95941, 95918, 95962.


 Based on the data from the years 2003 - 2018 the average number of fires per year is 128. The highest number of reported fires - 269 took place in 2005, and the least - 9 in 2004. The data has a dropping trend.
 When looking into fire subcategories, the most incidents belonged to: Outside Fires (52.2%), and Structure Fires (29.2%).