Hispanic Demographics and Stats Per MSA/CSA (best, state, better)
Please register to participate in our discussions with 2 million other members - it's free and quick! Some forums can only be seen by registered members. After you create your account, you'll be able to customize options and access all our 15,000 new posts/day with fewer ads.
Time to take a look into some stats! This thread is to look at the Hispanic communities across the different Metro Areas/CSA's in the US. Numbers are from 2011. Numbers are rounded as well. I also have detailed numbers of the top 4 Hispanic groups in the US. Enjoy:
- I think it has to be noted that certain groups stick to certain areas of the US. The Domincans are almost entirely in Northeast and Florida. Cubans congregate heavily in Florida as do Mexicans in the Southwest and Chicago.
- Six states are home to 60% of undocumented immigrants in the US. They are:
1) California at 21% of all undocumented immigrants
2) Texas at 15% of all undocumented immigrants
3) Florida at 8% of all undocumented immigrants
4) New York at 7% of all undocumented immigrants
5) Illinois at 5% of all undocumented immigrants
6) New Jeresey at 4% of all undocumented immigrants
- Mexico makes up 28.1% of all immigrants in the US. El Salvador at 3.1%, Cuba at 2.7%, the Dominican republic at 2.4%, and Guatemala at 2.2% make up the top 5 in Latin America.
- The foreign born percentages are in huge decline for Mexican immigrants from 1980. Only three Metro areas, Chicago, Dallas/Fort Worth, and Atlanta are bucking the trend. In those metro areas, the per capita rate of foreign born Mexicans is on the rise.
- Illegal Immigration from Latin American countries is on the decline in 49 of 50 states. Only one state, Texas, is it rising.
- Only 26% of Hispanic households speak English at home. 74% speak either Spanish exlusively at home or a mix of Spanish and another language.
- 33% of Hispanics say they do not speak English well
- Regarding educational attainment of Hispanics in the US. Among the top 10 largest Hispanic communities, Dallas/Fort Worth has the poorest Hispanic community with an average household income of $26,000. They are 4th lowest among all Hispanic communities in the US. The lowest is Brownsville with a per capita income of only $14600.
- Miami has the most educated Hispanic community with 75% of all Hispanics holding a high school diploma. 23% of Hispanics hold a college degree in Miami, which has the highest percentage of Hispanics with a college degree. Phoenix has the lowest percentage of Hispanics with a college degree at 10%. Dallas/Fort Worth has the lowest amount of Hispanics with a high school diploma at only 54%.
- Regarding mastery of the English language, the Hispanic community in San Antonio (by far) has the best English skills with 81% speaking English fluently. Miami has the lowest at 52%, followed by New York at 57%, and Dallas/Fort Worth at 58%.
- Regarding American Citizenship, San Antonio again has the highest rate of citizenship amongst Hispanics at 88%. Dallas/Fort Worth has the lowest at 66% followed by Miami at 67%. Nearly 76% of all Hispanics in the US are citizens.
- Washington DC is home to the wealthiest Hispanic community in the US with a household income of $62,000. Baltimore is 2nd at $58,000.
- McAllen has the highest home ownership rate amongst Hispanics at 67% followed by San Antonio at 58%. New York has the lowest at 25% followed by San Francisco at 40%.
- Brownsville has the highest poverty rate among Hispanics at 40% and a child poverty rate of 50%. This is followed by Phoenix at 28%, Houston at 26%, and Dallas/Fort Worth at 25%. Hispanics in San Francisco are the least impovrished at 17%. This is followed by Chicago at 20%.
- Atlanta has the highest rate of Hispanics with no insurance at 51%. In the 10 largest communities, Houston has the highest rate of Hispanics with no insurance at 43% followed by Dallas/Fort Worth at 42%. Boston has the highest rate of Hispanics with insurance at 88%.
If you want to re do the numbers based on 2012 estimates, go ahead. The numbers posted were from 2011.
I have to say I doubt the Bays Hispanic community jumped that much.
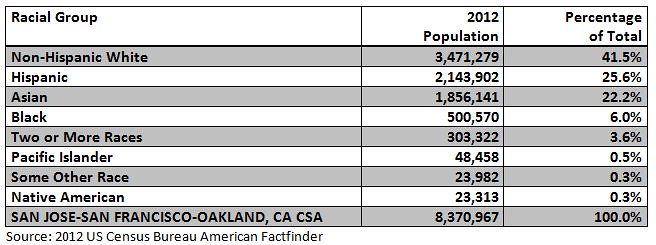
Checking fact finder, your data is wrong. The Bay Area has 1,864,000 Hispanics.
Did you take into account the fact that the CSA/MSA definitions have changed and the 2011/2012 estimates haven't reflected that yet? I think 18Montclair is including Stockton/San Joaquin County.
Did you take into account the fact that the CSA/MSA definitions have changed and the 2011/2012 estimates haven't reflected that yet? I think 18Montclair is including Stockton/San Joaquin County.
The last number is from the most recent fact finder data.
If you want to re do the numbers based on 2012 estimates, go ahead. The numbers posted were from 2011.
I have to say I doubt the Bays Hispanic community jumped that much.
Checking fact finder, your data is wrong. The Bay Area has 1,864,000 Hispanics.
The Bay Area now includes the Stockton, CA MSA so yeah...add San Jose-San Francisco-Oakland and Stockton and the result for 2012 is 2,143,902
Quote:
Originally Posted by Lets Eat Candy
Did you take into account the fact that the CSA/MSA definitions have changed and the 2011/2012 estimates haven't reflected that yet? I think 18Montclair is including Stockton/San Joaquin County.
Yep that's what I did.
The more we add the central valley and anywhere east and south, Hispanics are going to be a significant number and in the case of Stockton, 279,000 in 2012.
Please register to post and access all features of our very popular forum. It is free and quick. Over $68,000 in prizes has already been given out to active posters on our forum. Additional giveaways are planned.
Detailed information about all U.S. cities, counties, and zip codes on our site: City-data.com.

 Please register to participate in our discussions with 2 million other members - it's free and quick! Some forums can only be seen by registered members. After you create your account, you'll be able to customize options and access all our 15,000 new posts/day with fewer ads.