Please register to participate in our discussions with 2 million other members - it's free and quick! Some forums can only be seen by registered members. After you create your account, you'll be able to customize options and access all our 15,000 new posts/day with fewer ads.
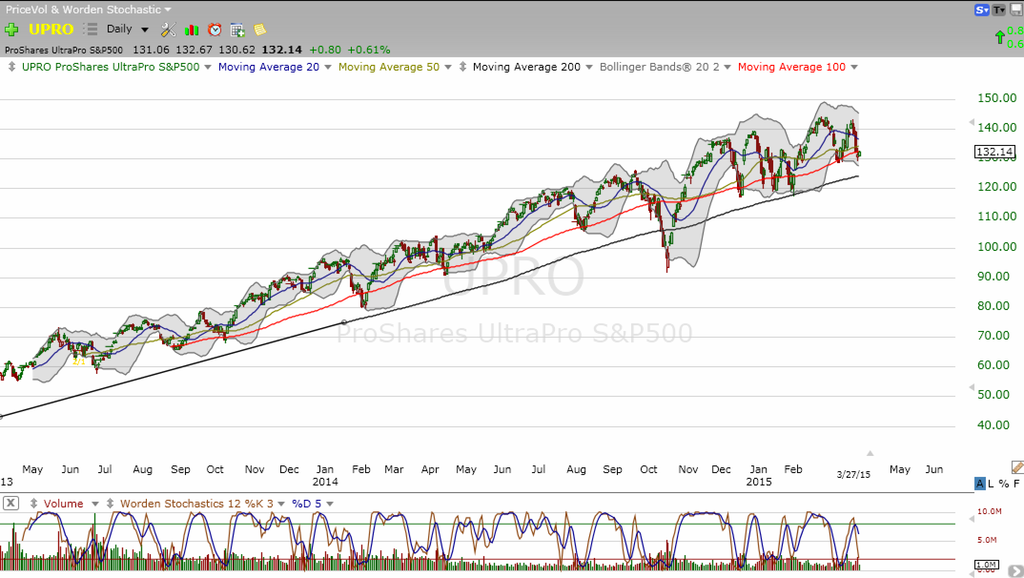
Because it's likely to trade at 141 some-time in April. That is a 7% earning right there. Trading the volatility of an equity is my favorite trading strategy. Back in the day, before year 2000, I used love trading ORCL corridor.
Because it's likely to trade at 141 some-time in April. That is a 7% earning right there. Trading the volatility of an equity is my favorite trading strategy. Back in the day, before year 2000, I used love trading ORCL corridor.
Thanks, but that is apparent, I was more curious in knowing what the entry strategy was, if any? Looking for more than just "trading on volatility".
If you look at its chart, it tends to find support around the 100 day. It showed decent strength going into the close on Thursday, so I said I would buy it on Friday if it goes up, which it did. I'm using Thursday's intraday low as my stop.
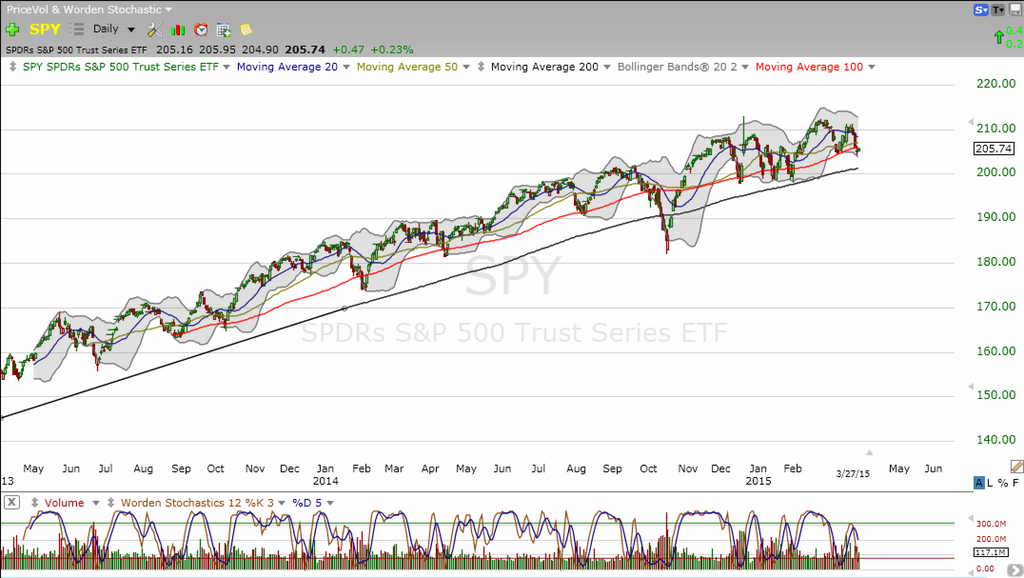
The chart is virtually identical to SPY, which is a great buy and hold ETF. UPRO is its leveraged sister, which is good short-term. You can still use moving averages for long-term investing as well. As long as SPY doesn't go below the 200 day moving average, you can ignore all the "scary" news headlines and all the ups and downs that shake people out of the market. If it goes below the 200 day sell it and hope the market crashes, your losses will be very minimal. If it goes back above the 200 day, then buy it back. That's the long-term way to invest in SPY. You can also trade the zigs and zags with UPRO or do both like myself.
Thanks for your response, here's my observation on this stock and your entry point. If I understand what you just said correctly you really do not have a strategy for entries and exits? Other than using MAs and support/resistance? What other indicators do you use? Investors (long-terms) are different from traders (short-terms) and understand who the trend setters are is very important. I personally use what you describe, but only in a broad sense. I would never jump into a buy with just MAs and support/resistance, but maybe it's just me.
Also, your Bollinger Bands should be tightened up a bit, I can give you recommended settings if you like?
I tried that before, being a trader, did it differently than most. I calculated what it took to get a 5-8% return then set a sell limit on that, and as soon as it hit it, automatically sold it. If it didn't sell within a month and I found something better to try, I sold it. If it fell 10% I sold it as well. Anyways, I made a profit, but I lost enough in taxes from the short term tax rate that I would have gotten the same returns if I just held an index for long term and without as much headache too. So now I just index invest.
Not sure if you've looked into how much tax you'll end up paying on those gains each month.
Thanks for your response, here's my observation on this stock and your entry point. If I understand what you just said correctly you really do not have a strategy for entries and exits? Other than using MAs and support/resistance? What other indicators do you use? Investors (long-terms) are different from traders (short-terms) and understand who the trend setters are is very important. I personally use what you describe, but only in a broad sense. I would never jump into a buy with just MAs and support/resistance, but maybe it's just me.
Also, your Bollinger Bands should be tightened up a bit, I can give you recommended settings if you like?
I primarily use moving averages, support/resistance levels, trading ranges as my primary followed by bollinger bands, stochastics, and a few other things. I look at support levels and buy when they hit. I use stops at key points. It's really not that difficult, it's actually quite easy, you just have to keep your emotions out of it.
I'd like to hear your settings, I most likely won't change mind because this is what I'm used too and I've been doing very well. However, I'm always open to new ideas and I'll have another chart tab with those settings.
Please register to post and access all features of our very popular forum. It is free and quick. Over $68,000 in prizes has already been given out to active posters on our forum. Additional giveaways are planned.
Detailed information about all U.S. cities, counties, and zip codes on our site: City-data.com.

 Please register to participate in our discussions with 2 million other members - it's free and quick! Some forums can only be seen by registered members. After you create your account, you'll be able to customize options and access all our 15,000 new posts/day with fewer ads.


 Back in the day, before year 2000, I used love trading ORCL corridor.