Please register to participate in our discussions with 2 million other members - it's free and quick! Some forums can only be seen by registered members. After you create your account, you'll be able to customize options and access all our 15,000 new posts/day with fewer ads.
This is how far I got with this...I got stuck at DC which has 42 such towns in MD alone.
The data below is based on 2 Criteria from data.census.gov:
1. Median Black Family Income, 2020
2. Black Population, 2020(I only included places with 2,000+ population)
City, STATE, Median Black Family Income(Black Population)
Atlanta-Sandy Springs-Alpharetta Metro Area: 7 places
Alpharetta, GA $143,194(9,541)
Canton, GA $116,274(3,947)
Grayson, GA $109,066(2,669)
Milton, GA $120,722(5,974)
North Decatur, GA $106,250(2,412)
Peachtree City, GA $101,985(2,857)
Sugar Hill, GA $106,284(3,115)
Tyrone, GA $144,167(2,280)
Austin-Round Rock-Georgetown Metro Area: 2 places
Cedar Park, TX $101,542(2,907)
Leander, TX $127,703(5,919)
Boston-Cambridge-Newton Metro Area: 6 places
Brookline, MA $108,179(2,767)
Everett, MA $100,511(10,226)
Marlborough, MA $124,125(2,345)
Medford, MA $102,652(6,994)
Milton, MA $140,078(5,230)
Newton, MA $154,561(3,616)
Birmingham-Hoover Metro Area: 1 place
Helena, AL $100,125(3,887)
Denver-Aurora Metro Area: 1 place
Highlands Ranch, CO $108,988(2,037)
Houston-The Woodlands-Sugar Land Metro Area: 5 places
League City, TX $112,483(9,913)
Manvel, TX $117,626(2,103)
Pearland, TX $127,517(25,007)
Sugar Land, TX $126,111(8,898)
The Woodlands, TX $120,215(5,504)
Las Vegas-Henderson-Paradise Metro Area: No places
Los Angeles-Long Beach-Anaheim Metro Area: 14 places
Azusa, CA $100,750(2,403)
Carson, CA $101,525(24,539)
Cerritos, CA $124,745(4,708)
Costa Mesa, CA $108,529(2,247)
Culver City, CA $134,332(4,508)
Diamond Bar, CA $124,079(2,543)
Huntington Beach, CA $103,019(5,021)
Irvine, CA $148,091(7,505)
Ladera Heights, CA $163,268(4,816)
Laguna Niguel, CA $108,839(2,315)
Mission Viejo, CA $121,103(2,017)
Redondo Beach, CA $110,972(4,098)
Santa Clarita, CA $108,259(12,993)
View Park-Windsor Hills, CA $121,912(9,463)
Napa Metro Area: 1 place
American Canyon, CA $163,068(2,190)
Nashville-Murfreesboro-Franklin Metro Area: 1 place
Mount Juliet, TN $110,293(2,671)
Oxnard-Thousand Oaks-Ventura Metro Area: 2 places
Thousand Oaks, CA $117,798(3,043)
Simi Valley, CA $104,125(2,998)
Philadelphia-Camden-Wilmington Metro Area: 3 places
Glasgow, DE $106,071(3,766)
Clayton, NJ $100,828(2,047)
Lawnside, NJ $118,281(2,506)
Phoenix-Mesa-Chandler Metro Area: 3 places
Florence, AZ $103,036(2,899)
Marana, AZ $104,821(2,696)
Scottsdale, AZ $101,324(6,918)
Riverside-San Bernardino-Ontario Metro Area: 10 places
Chino Hills, CA $185,139(4,042)
Corona, CA $105,208(13,437)
Eastvale, CA $156,538(6,431)
Menifee, CA $107,447(7,820)
Montclair, CA $105,139(2,008)
Murrieta, CA $117,806(8,062)
Temecula, CA $113,386(8,075)
Temescal Valley, CA $131,106(2,329)
Wildomar, CA $104,405(2,012)
Woodcrest, CA $145,906(2,406)
Sacramento-Roseville-Folsom Metro Area: 5 places
Davis, CA $109,563(2,815)
Elk Grove, CA $104,616(25,070)
Folsom, CA $102,813(4,412)
Rocklin, CA $133,839(2,256)
Roseville, CA $152,865(4,364)
St Louis Metro Area: 2 places
Chesterfield, MO $133,289(2,411)
O'Fallon, MO $110,000(5,362)
Salt Lake City Metro Area: 1 place
West Jordan, UT $105,347(2,521)
San Diego-Chula Vista-Carlsbad Metro Area: 1 place
San Marcos, CA $111,161(2,756)
San Francisco-Oakland-Berkeley Metro Area: 17 places
Brentwood, CA $168,607(7,108)
Concord, CA $116,833(7,294)
Dublin, CA $105,500(3,024)
East Palo Alto, CA $102,545(4,366)
El Cerrito, CA $110,123(2,154)
Fairview, CA $125,857(2,272)
Fremont, CA $113,714(8,707)
Hercules, CA $106,760(5,247)
Livermore, CA $174,886(2,359)
Newark, CA $121,146(2,058)
Novato, CA $106,329(2,704)
Oakley, CA $113,285(4,418)
Pinole, CA $114,559(2,852)
San Lorenzo, CA $118,313(2,298)
San Mateo, CA $125,083(3,843)
San Ramon, CA $179,205(3,282)
Union City, CA $103,516(4,344)
San Jose-Sunnyvale-Santa Clara Metro Area: 3 places
Milpitas, CA $128,846(3,256)
Mountain View, CA $108,859(2,302)
Santa Clara, CA $116,679(4,706)
Seattle-Tacoma-Bellevue Metro Area: 4 places
Frederickson, WA $125,572(3,103)
Graham, WA $119,950(2,500)
Kirkland, WA $100,208(2,583)
North Lynwood, WA $100,568(2,177)
Stockton Metro Area: 2 places
Mountain House, CA $144,962(2,064)
Tracy, CA $129,534(6,749)
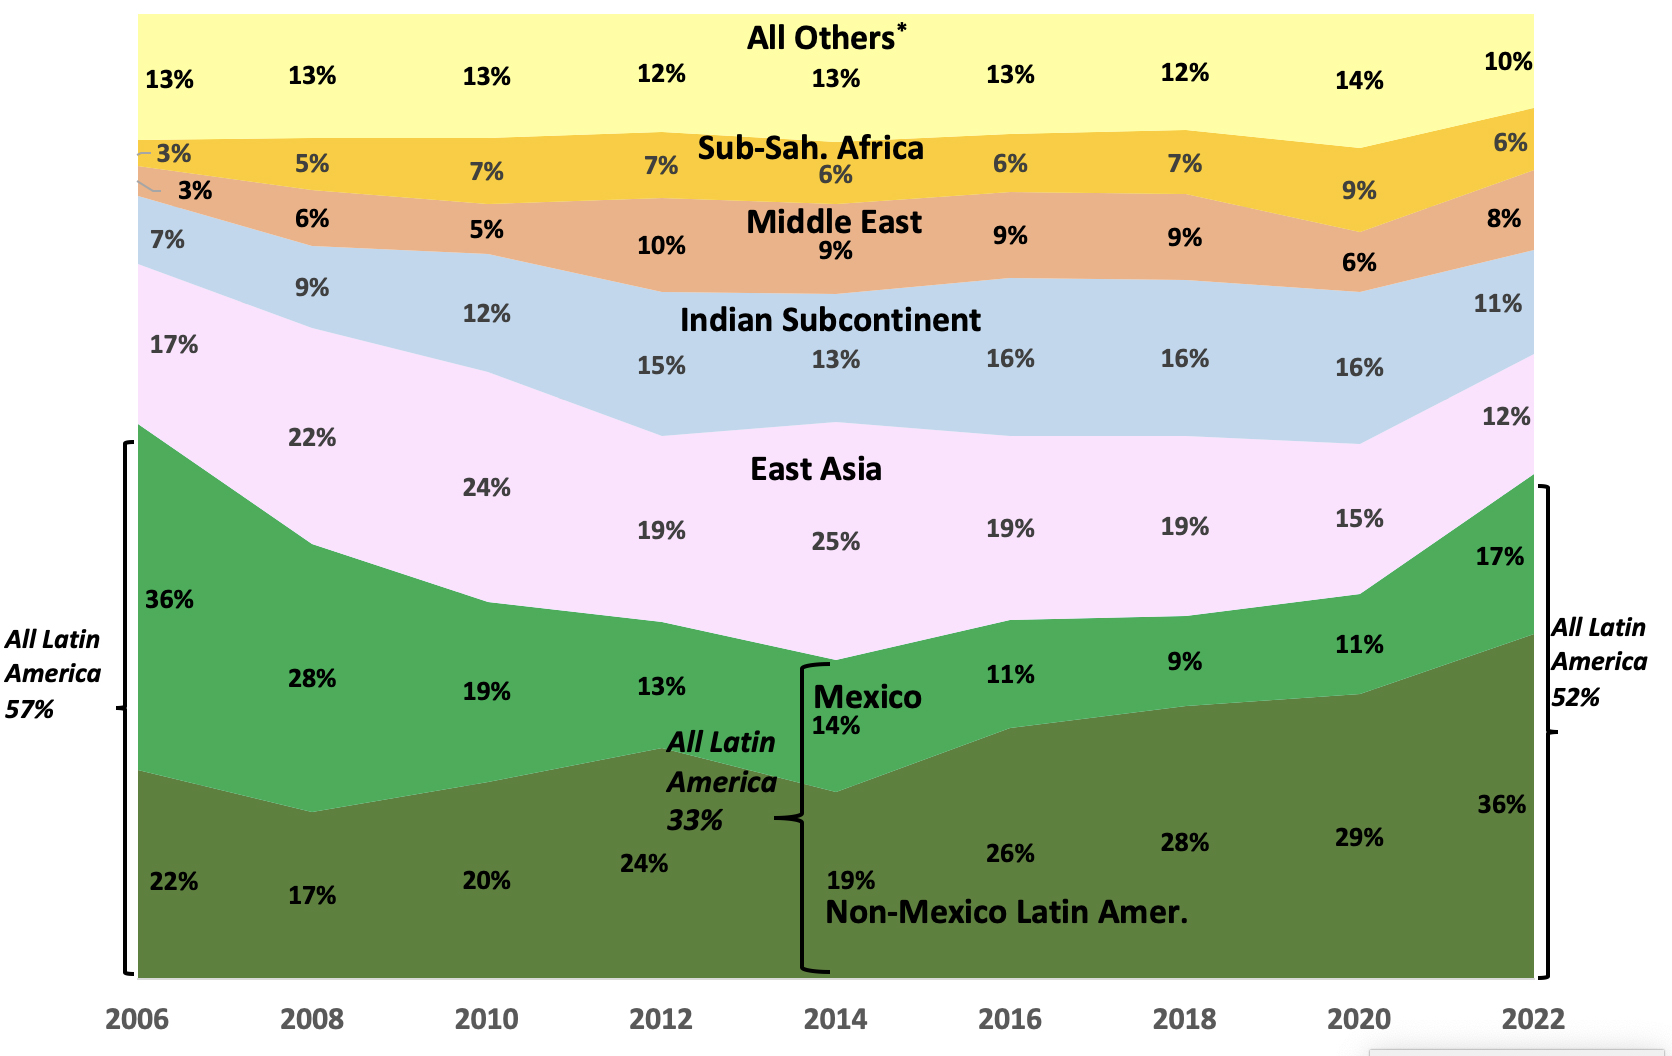
Home Report Western Hemisphere Comprises Larger Share of New Immigrants
Western Hemisphere Comprises Larger Share of New Immigrants
Half of newcomers (2020 to 2022) are now from the Americas compared to one-third a decade ago
"The number and share of new immigrants from East Asia has declined significantly. In 2022, only 12 percent of newcomers came from the region, compared to 25 percent in 2014.
The number and share of new immigrants from the Indian subcontinent also fell, declining from 16 percent of newcomers in 2018 to only 11 percent in 2022."
This is really interesting to me. DC is superlative here, but only 2 are not part of a larger CSA.
2 Criteria:
1. Median Black Family Income, 2021($80,000+)
2. Black Population(10,000+)
Urban Area--Median Black Family Income(Black Population)---commensurate CSA
Waldorf, MD $137,829(80,156)---Washington CSA
McAllen, TX $136,367(10,541)---McAllen CSA
Mission Viejo, CA $130,193(16,654)---Los Angeles CSA
Concord, CA $120,906(25,407)---San Francisco CSA
Murrieta-Temecula-Menifee, CA $119,167(47,193)---Los Angeles CSA
Merced, CA $118,380(12,171)---San Francisco CSA
Santa Rosa, CA $112,476(10,203)---San Francisco CSA
Westminster-Eldersburg, MD $109,180---Washington CSA
Murfreesboro, TN $106,982(32,204)---Nashville CSA
Antioch, CA $98,962(53,203)---San Francisco CSA
Washington, DC-VA-MD $97,537(1,468,364)---Washington CSA
Wheeling, WV-OH $97,558---No CSA
Fairfield, CA $96,991(27,919)---San Francisco CSA
Kenosha, WI-IL $93,554(11,020)---Chicago CSA
Avon-Goodyear, AZ $91,212(29,687)---Phoenix CSA
San Jose, CA $89,124(63,576)---San Francisco CSA
Boston, MA-NH-RI $87,844(515,935)---Boston CSA
Honolulu, HI $87,418(37,226)---No CSA
Fredericksburg, VA $86,371(33,712)---Washington CSA
Denton-Lewisville, TX $86,327(54,108)---Dallas CSA
Vacaville, CA $83,545(14,307)---San Francisco CSA
Riverside-San Bernardino, CA $83,131(210,575)---Los Angeles CSA
Bridgeport-Stamford, CT $82,595(135,165)---New York CSA
Battle Creek, MI $81,413(14,193)---Kalamazoo CSA
Manchester, NH $80,944(12,647)---Boston CSA
Seattle, WA $80,406(327,155)----Seattle CSA
Vallejo, CA $80,000(36,119)---San Francisco CSA
Wheeling/Bellaire/Martins Ferry/Bridgeport (the four cities where 99 percent of the few blacks who live there) is at $97,000? There is no way. That area has very low median income to begin with and from the times I've been through there, the "black" parts (though statistically very white overall) are rough.
Wheeling/Bellaire/Martins Ferry/Bridgeport (the four cities where 99 percent of the few blacks who live there) is at $97,000? There is no way. That area has very low median income to begin with and from the times I've been through there, the "black" parts (though statistically very white overall) are rough.
Correct! Wheeling, WV-OH should not be on the list. I goofed. Thank you for catching that!
Here is the accurate list as of this moment.
2 Criteria:
1. Median Black Family Income, 2021($80,000+)
2. Black Population(10,000+)
Urban Area--Median Black Family Income(Black Population)---commensurate CSA
Waldorf, MD $137,829(80,156)---Washington CSA
McAllen, TX $136,367(10,541)---McAllen CSA
Mission Viejo, CA $130,193(16,654)---Los Angeles CSA
Concord, CA $120,906(25,407)---San Francisco CSA
Murrieta-Temecula-Menifee, CA $119,167(47,193)---Los Angeles CSA
Merced, CA $118,380(12,171)---San Francisco CSA
Santa Rosa, CA $112,476(10,203)---San Francisco CSA
Westminster-Eldersburg, MD $109,180---Washington CSA
Murfreesboro, TN $106,982(32,204)---Nashville CSA
Antioch, CA $98,962(53,203)---San Francisco CSA
Washington, DC-VA-MD $97,537(1,468,364)---Washington CSA
Fairfield, CA $96,991(27,919)---San Francisco CSA
Kenosha, WI-IL $93,554(11,020)---Chicago CSA
Avon-Goodyear, AZ $91,212(29,687)---Phoenix CSA
San Jose, CA $89,124(63,576)---San Francisco CSA
Boston, MA-NH-RI $87,844(515,935)---Boston CSA
Honolulu, HI $87,418(37,226)---No CSA
Fredericksburg, VA $86,371(33,712)---Washington CSA
Denton-Lewisville, TX $86,327(54,108)---Dallas CSA
Vacaville, CA $83,545(14,307)---San Francisco CSA
Riverside-San Bernardino, CA $83,131(210,575)---Los Angeles CSA
Bridgeport-Stamford, CT $82,595(135,165)---New York CSA
Battle Creek, MI $81,413(14,193)---Kalamazoo CSA
Manchester, NH $80,944(12,647)---Boston CSA
Seattle, WA $80,406(327,155)----Seattle CSA
Vallejo, CA $80,000(36,119)---San Francisco CSA
That is interesting. McAllen overall is not wealthy AT ALL. From the 6 Texas metros with population 1M or above, I think it is the least wealthy. In fact from the 385 largest metro areas in the US McAllen is THE poorest.
The black population down there is also miniscule. I think it's the only major Texas city where the Asian population is twice as large as the AA population.
So just about every black person in McAllen must be wealthy if that data is correct. That's the thing with statistics and averages and things like median income. It doesn't give anywhere near the whole picture.
Median Income works for the Bay. That area is wealthy no matter how you look at it. I saw a ridiculous post this week about how Houston wages are low. You look at the list and McAllen is near the top, DFW is near the bottom and Houston is not listed at all. So a poster with little common sense would look at this median income data may draw conclusions such as:
1. McAllen must be THE spot for wealth blacks in Texas
2. Other Texas cities are no where as good.
Without the context of raw numbers statistics are VERY deceptive. Again median income works for the Bay because yall all billionaires, but for most other places you need context.
DFW and Houston for example are over 7 times as large as McAllen. DFW and Houston has over 80 times more black people than McAllen had people. There are over 1,200,000 black people in DFW or Houston compared to less than 20k in McAllen. So there are literally hundreds of thousands of black people in DFW and Houston making more than black people in McAllen so McAllen being second from the top of that list greatly lowers the significance of the data on that list imo.
This makes the median income data highly suspect. The overall median income in McAllen is $41k. The per capita income is less than 10k. So finding 10K black people in McAllen with a median income of $135k plus is HIGHLY suspect.
Can't trust statistics without context.
Edit: I looked it up. The McAllen metro is in Hidalgo County and has less than 5,000 black folks. The CSA adds another County but that County has negligible black folks. In fact the entire Rio Grande Valley has less than 10K black people. So there is an error in the stat
Last edited by atadytic19; 09-21-2022 at 08:49 AM..
Ok, so here are the Urban areas and I did include races in combo. Here is how this will work.
-Hispanic isn't a race, so the Hispanic numbers will be pulled the same.
-The Asian and Black numbers below will include those that are "Asian/Black Alone" and "Asian/Black in Combination".
-The White numbers will only be those that are "White Alone".
The more I go through these numbers, the more I am convinced that the perceived losses of some minority groups from some metro areas is simply a redefining of what it means to be those groups not actually people losses.
Anywhere, here they are.
New York City - 19,182,900
White: 8,187,382 - 42.7%
Hispanic: 4,924,876 - 25.7%
Black: 3,771,008 - 19.7%
Asian: 2,532,350 - 13.2%
Los Angeles - 12,257,919
Hispanic: 5,780,948 - 47.2%
White: 3,117,090 - 25.4%
Asian: 2,405,379 - 19.6%
Black: 954,238 - 7.8%
Location: That star on your map in the middle of the East Coast, DMV
8,128 posts, read 7,560,868 times
Reputation: 5785
^^ Crazy if MD, VA, and DC made up one "Chesapeake/Potomac" state it would be number #1 total in the US ahead of Texas, in about the land mass equivalent of Alabama:
Please register to post and access all features of our very popular forum. It is free and quick. Over $68,000 in prizes has already been given out to active posters on our forum. Additional giveaways are planned.
Detailed information about all U.S. cities, counties, and zip codes on our site: City-data.com.

 Please register to participate in our discussions with 2 million other members - it's free and quick! Some forums can only be seen by registered members. After you create your account, you'll be able to customize options and access all our 15,000 new posts/day with fewer ads.