Please register to participate in our discussions with 2 million other members - it's free and quick! Some forums can only be seen by registered members. After you create your account, you'll be able to customize options and access all our 15,000 new posts/day with fewer ads.
The 'death map' is in need of updating! Just last summer, a tornado touched down here in my home borough of Brooklyn. The previous tornado to hit Brooklyn occurred in 1889. It's beginning to look like weather patterns are changing--and not necessarily for the better.
That was a Man made fire that didn't get properly put out.
and most of the fires in Southern CA are MAN made as well; campfires/bonfires not put out properly, power lines, arson, etc... But either way the same conditions that exist in Southern CA for such catastrophic fires also exist in Northern CA, just not as often. Just look at all the wildfires back in June in NorCal and Angel Island earlier this year. Just saying that the Bay Area is not immune to wildfires at all.
If anyone knows about statistics though, this isn't really useful.
Think about this in the Bayesian sense. We know there is a good prior probability that a massive earthquake/tidal wave will hit the west coast in the next 10-20 years.
So while in any given 20-50 year period it's safe, you only need one "big one" (SF earthquake of 1906) to make it all worth nothing.
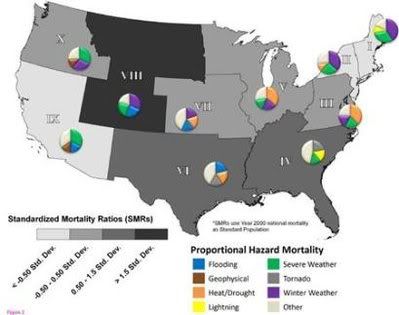
So....on the Reuters map, the Orange pie slice is Heat/Drought.
Over the entire desert southwest, there is no orange pie slice. In fact, one is apparently more likely (from this map) to die of Heat/Drought in the Midwest than either the desert Southwest or the hot, humid Southeast.
So....on the Reuters map, the Orange pie slice is Heat/Drought.
Over the entire desert southwest, there is no orange pie slice. In fact, one is apparently more likely (from this map) to die of Heat/Drought in the Midwest than either the desert Southwest or the hot, humid Southeast.
Reuters, you have some 'splaining to do!
Chicago has fatal heat waves all the time.
When was the last time an American died in the u.s from "drought?" lol
Here you go:
http://www.biomedcentral.com/graphics/email/images/deathmap.jpg (broken link)
This is a very, very interesting map. There seems to be a corrolary here, and it's pretty obvious: the closer you live to cities, the safer you likely are. A great deal of this safety vs danger, IMO, is immediate access to medical care facilities. For instance, in a rural state like New Mexico, if you suffer a bad car accident, and you are in a rural area, you are in big, big trouble.
Please register to post and access all features of our very popular forum. It is free and quick. Over $68,000 in prizes has already been given out to active posters on our forum. Additional giveaways are planned.
Detailed information about all U.S. cities, counties, and zip codes on our site: City-data.com.

 Please register to participate in our discussions with 2 million other members - it's free and quick! Some forums can only be seen by registered members. After you create your account, you'll be able to customize options and access all our 15,000 new posts/day with fewer ads.