Please register to participate in our discussions with 2 million other members - it's free and quick! Some forums can only be seen by registered members. After you create your account, you'll be able to customize options and access all our 15,000 new posts/day with fewer ads.
How would projected global warming change by 2100 if the US built 1000 nuclear power plants by 2020 (which wpuld have amounted to a global co2 emission reduction of 10%)? The earth only has 483 in operation now. Basically nothing
Co2 is a greenhouse gas and will warm the planet but it has both positive and negative effects.
Quote:
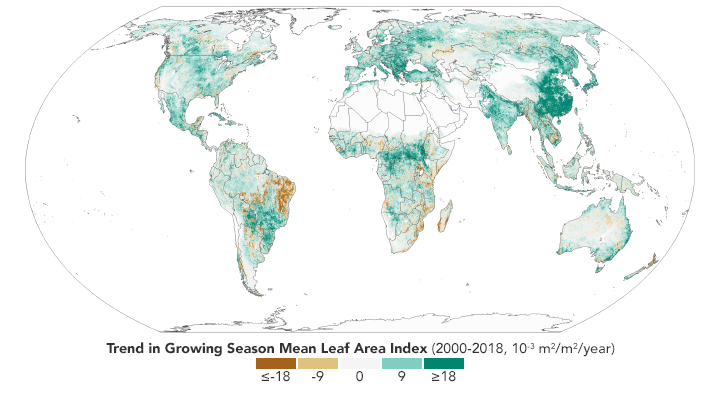
Scientists previously established that the world is greener than it was in the early 1980s. Updated maps show that the trend has continued, and researchers say reduced global warming is among the consequences.
The map above shows where greenness increased (green) and decreased (brown) across the planet between 2000 and 2018. Specifically, it shows the trend in the “leaf area index”—the amount of leaf area relative to ground area—during the growing season. The index is computed using data from the Moderate Resolution Imaging Spectroradiometer (MODIS) on NASA’s Terra and Aqua satellites. White areas are where the land is barren, built upon, or covered with ice, wetlands, or water.
Note that the map does not show overall greenness, which is why it does not exactly match heavily forested areas like the Amazon or the Congo Basin. Instead, the map shows how greenness has changed —a phenomenon most obvious in places like China and India where agriculture has intensified and governments have made efforts to conserve and expand forests
Quote:
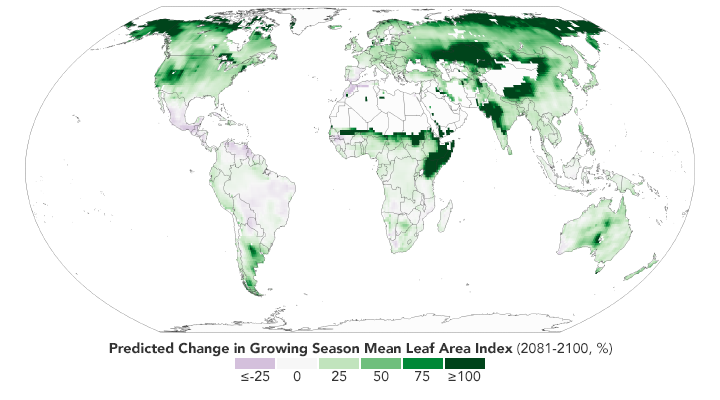
According to climate models, the future looks even greener. The second map shows what the green-up might look like in the future based on the Coupled Model Intercomparison Project (CMIP5) climate model, under a scenario in which increases in greenhouse gases lead to almost 5° Celsius (9° Fahrenheit) of warming by the end of the 21st century. Specifically, it shows the predicted change in the growing season’s “leaf area index” from 2081-2100 relative to 1981-2000. The chart below the map shows the predicted changes by latitude. Notice that high latitudes in the Northern Hemisphere are still expected to change the most.
I thought we were all expecting the SW to head into a prolonged drought? How come they have the Utah area as the area within the contiguous US that will green up the most?
Anyways, I guess the Arctic greening will be mainly due to temperature increases but the rest seems to be tied in large part to changes in precipitation since it's non-uniform. And it seems like they have a lot of different predictions for which areas will get more or less precipitation depending on which model and parameters you use.
They want cheap reliable energy for their 1.3 billion peopls
Quote:
More than 90% of the 195 coal plants being built around the world are in Asia, according to data from GEM.
Tamil Nadu is India's second-most industrialised state and is one of the country's top renewable energy producers. But it is also building the most coal-fired plants in the country. read more
"We cannot depend on just solar and wind," a senior official at Tamil Nadu Generation and Distribution Corp told Reuters.
Please register to post and access all features of our very popular forum. It is free and quick. Over $68,000 in prizes has already been given out to active posters on our forum. Additional giveaways are planned.
Detailed information about all U.S. cities, counties, and zip codes on our site: City-data.com.

 Please register to participate in our discussions with 2 million other members - it's free and quick! Some forums can only be seen by registered members. After you create your account, you'll be able to customize options and access all our 15,000 new posts/day with fewer ads.