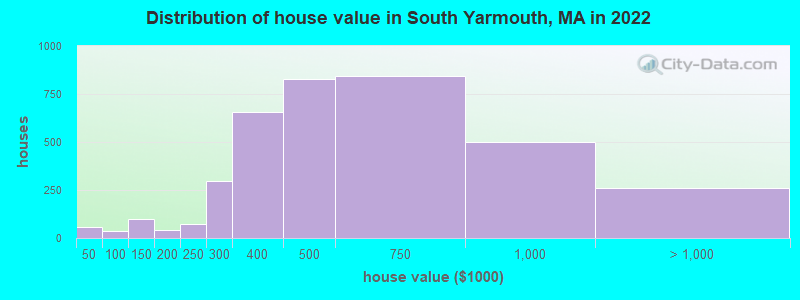
Estimated median house or condo value in 2022: $522,815 (it was $143,100 in 2000)
South Yarmouth:
$522,815
MA:
$534,700
Mean prices in 2022:all housing units: $623,757; detached houses: $648,447; townhouses or other attached units: $490,502; in 2-unit structures: $577,155; in 3-to-4-unit structures: $445,551; in 5-or-more-unit structures: $351,307; mobile homes: $108,058
Median gross rent in 2022: $1,694.
March 2022 cost of living index in South Yarmouth: 119.8 (more than average, U.S. average is 100)
Percentage of residents living in poverty in 2022: 7.9%
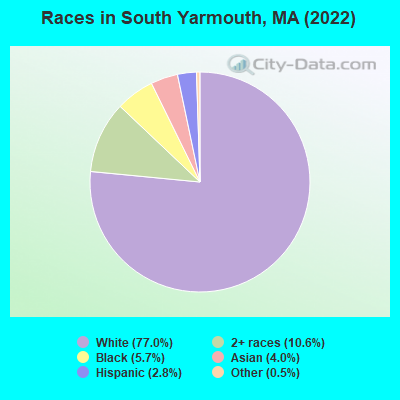
(6.4% for White Non-Hispanic residents, 5.3% for Black residents, 13.9% for Hispanic or Latino residents, 15.0% for other race residents, 25.9% for two or more races residents)
According to our research of Massachusetts and other state lists, there were 3 registered sex offenders living in South Yarmouth, Massachusetts as of May 19, 2024. The ratio of all residents to sex offenders in South Yarmouth is 3,689 to 1. The ratio of registered sex offenders to all residents in this city is lower than the state average.
Recent articles from our blog. Our writers, many of them Ph.D. graduates or candidates, create easy-to-read articles on a wide variety of topics.
Ancestries: Irish (15.5%), English (12.6%), Jamaican (10.5%), Italian (10.0%), Brazilian (8.6%), American (7.5%).
Current Local Time: EST time zone
Elevation: 20 feet
Land area: 7.00 square miles.
Population density: 1,584 people per square mile (low).
2,122 residents are foreign born (8.9% Latin America, 5.2% Europe, 3.4% Asia).
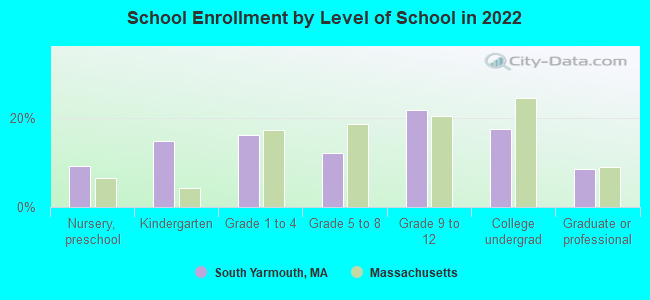
This place:
17.7%
Massachusetts:
17.6%
Median real estate property taxes paid for housing units with mortgages in 2022: $3,152 (0.6%) Median real estate property taxes paid for housing units with no mortgage in 2022: $4,086 (0.7%)
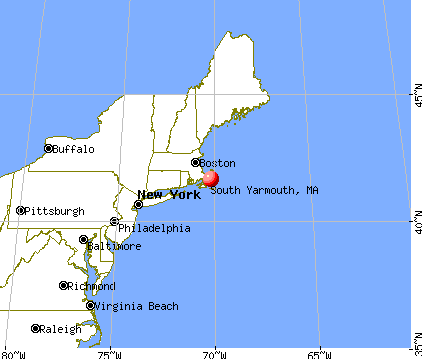
Nearest city with pop. 50,000+: New Bedford, MA (37.9 miles , pop. 93,768).
Nearest city with pop. 200,000+: Boston, MA (64.3 miles , pop. 589,141).
Nearest city with pop. 1,000,000+: Bronx, NY (199.3 miles , pop. 1,332,650).
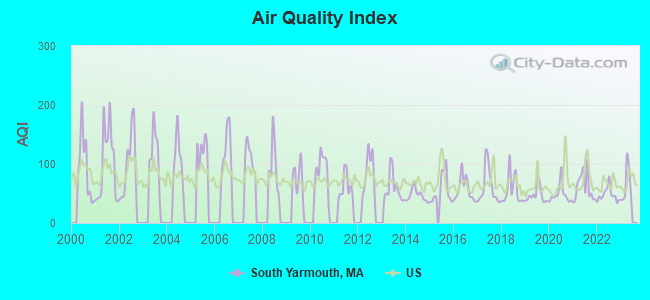
Air Quality Index (AQI) level in 2022 was 48.0. This is significantly better than average.
City:
48.0
U.S.:
72.6
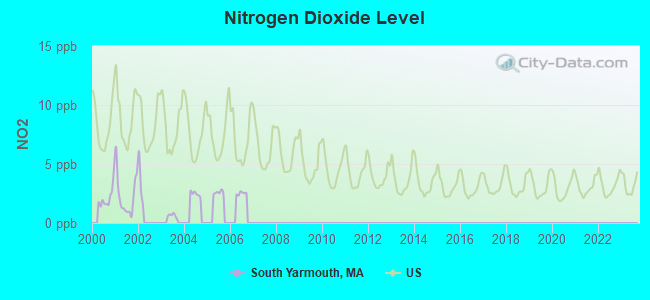
Nitrogen Dioxide (NO2) [ppb] level in 2001 was 2.30. This is significantly better than average.Closest monitor was 22.5 miles away from the city center.
City:
2.30
U.S.:
5.11
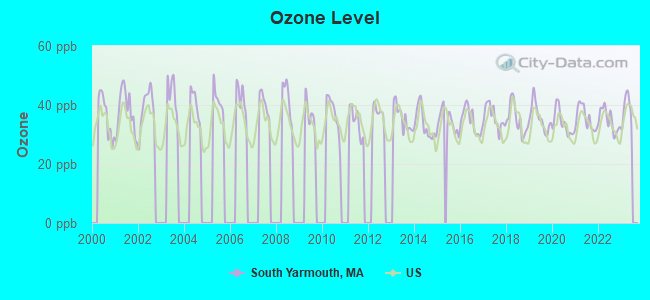
Ozone [ppb] level in 2022 was 34.8. This is about average.Closest monitor was 23.2 miles away from the city center.
City:
34.8
U.S.:
33.3
Earthquake activity:
South Yarmouth-area historical earthquake activity is significantly above Massachusetts state average. It is 77% smaller than the overall U.S. average.
On 10/16/2012 at 23:12:25, a magnitude 4.7 (4.7 ML, Depth: 10.0 mi, Class: Light, Intensity: IV - V) earthquake occurred 135.5 miles away from the city center On 1/19/1982 at 00:14:42, a magnitude 4.7 (4.5 MB, 4.7 MD, 4.5 LG) earthquake occurred 145.4 miles away from South Yarmouth center On 10/7/1983 at 10:18:46, a magnitude 5.3 (5.1 MB, 5.3 LG, 5.1 ML, Class: Moderate, Intensity: VI - VII) earthquake occurred 262.9 miles away from South Yarmouth center On 4/20/2002 at 10:50:47, a magnitude 5.3 (5.3 ML, Depth: 3.0 mi) earthquake occurred 264.4 miles away from the city center On 8/22/1992 at 12:20:32, a magnitude 4.8 (4.8 MB, 3.8 MS, 4.7 LG, Depth: 6.2 mi) earthquake occurred 177.3 miles away from South Yarmouth center On 4/20/2002 at 10:50:47, a magnitude 5.2 (5.2 MB, 4.2 MS, 5.2 MW, 5.0 MW) earthquake occurred 263.8 miles away from South Yarmouth center Magnitude types: regional Lg-wave magnitude (LG), body-wave magnitude (MB), duration magnitude (MD), local magnitude (ML), surface-wave magnitude (MS), moment magnitude (MW)
Natural disasters:
The number of natural disasters in Barnstable County (21) is greater than the US average (15). Major Disasters (Presidential) Declared: 11 Emergencies Declared: 8
Causes of natural disasters: Hurricanes: 7, Floods: 5, Storms: 4, Snows: 3, Snowstorms: 3, Winter Storms: 3, Blizzards: 2, Snowfall: 1, Tropical Storm: 1, Wind: 1, Other: 1 (Note: some incidents may be assigned to more than one category).
Main business address for: CCBT FINANCIAL COMPANIES INC (NATIONAL COMMERCIAL BANKS).
Hospitals and medical centers in South Yarmouth:
WINDSOR NURSING AND RETIREMENT HOME (265 N MAIN ST)
Other hospitals and medical centers near South Yarmouth:
HOSPICE OF VNA OF CEN AND OUTER CAPE COD (Hospital, about 3 miles away; SOUTH DENNIS, MA)
MAYFLOWER PLACE NURSING CENTER (Nursing Home, about 4 miles away; WEST YARMOUTH, MA)
CAPE COD ARTIFICIAL KIDNEY CENTER (BMA CAPE COD) (Dialysis Facility, about 4 miles away; YARMOUTH, MA)
OLSTEN KIMBERLY QUALITY CARE (Home Health Center, about 4 miles away; YARMOUTH PORT, MA)
CAPE COD HOSPITAL Acute Care Hospitals (about 5 miles away; HYANNIS, MA)
HYANNIS SKILLED CARE CENTER (Nursing Home, about 5 miles away; HYANNIS, MA)
LEWIS BAY CONV HOME (Nursing Home, about 5 miles away; HYANNIS, MA)
Colleges/universities with over 2000 students nearest to South Yarmouth:
Cape Cod Community College (about 8 miles; West Barnstable, MA; Full-time enrollment: 2,491)
University of Massachusetts-Dartmouth (about 42 miles; North Dartmouth, MA; FT enrollment: 7,545)
Bridgewater State University (about 46 miles; Bridgewater, MA; FT enrollment: 9,802)
Bristol Community College (about 48 miles; Fall River, MA; FT enrollment: 5,707)
Massasoit Community College (about 50 miles; Brockton, MA; FT enrollment: 5,442)
Stonehill College (about 53 miles; Easton, MA; FT enrollment: 2,563)
Roger Williams University (about 55 miles; Bristol, RI; FT enrollment: 4,375)
YARMOUTH TOWN LIBRARY BOARD (Operating income: $803,669; Location: 312 OLD MAIN STREET; 86,062 books; 19 e-books; 5,048 audio materials; 6,994 video materials; 4 local licensed databases; 34 state licensed databases; 205 print serial subscriptions)
Notable locations in South Yarmouth: Bass River West Jetty Light (A), Bass River Golf Club (B), South Yarmouth Plaza (C), South Dennis Station (D), Yarmouth Fire Department Station 1 Headquarters (E). Display/hide their locations on the map
Lakes and reservoirs: Labans Pond (A), Seine Pond (B), Plashes Pond (C), Long Pond (D), Lily Pond (E), James Pond (F), Halfway Pond (G), Flax Pond (H). Display/hide their locations on the map
Tourist attractions: Bonkerz Party Zone (Arcades & Amusements; 41 Long Pond Dr), American Host Tours (Tours & Charters; 2 Whites Path).
Hotels: Hemeon-Abbott Management Corp (5 Theatre Colony Ln), Beach'N Towne Motel (1261 Rt 28), Best Western Blue Water on the Ocean (291 South Shore Drive), Castle Dawn Motel (226 Route 28), Ocean Club On Smugglers Beach The (329 South Shore Dr), Guerilla Marketing Inc (881 Route 28), Bass River Motel (891 Route 28), Gull Wing Suites (Route 28), Ocean Mist Motor Lodge (97 South Shore Drive).
Barnstable County has a predicted average indoor radon screening level between 2 and 4 pCi/L (pico curies per liter) - Moderate Potential
Average household size:
This place:
2.1 people
Massachusetts:
2.5 people
Percentage of family households:
This place:
56.4%
Whole state:
63.0%
Percentage of households with unmarried partners:
This place:
6.5%
Whole state:
7.0%
Likely homosexual households (counted as self-reported same-sex unmarried-partner households)
Lesbian couples: 0.5% of all households
Gay men: 0.4% of all households
101 people in nursing facilities/skilled-nursing facilities in 2010
10 people in residential treatment centers for juveniles (non-correctional) in 2010
People in group quarters in South Yarmouth in 2000:
110 people in nursing homes
69 people in other workers' dormitories
15 people in other noninstitutional group quarters
8 people in other group homes
6 people in residential treatment centers for emotionally disturbed children
4 people in homes for the mentally retarded
4 people in religious group quarters
Banks with branches in South Yarmouth (2011 data):
RBS Citizens, National Association: South Yarmouth Station Ave Stop And, South Yarmouth Branch, South Yarmouth Stop & Shop. Info updated 2007/09/19: Bank assets: $106,940.6 mil, Deposits: $75,690.2 mil, headquarters in Providence, RI, positive income, 1135 total offices, Holding Company: Uk Financial Investments Limited
TD Bank, National Association: South Yarmouth Branch at 1095 Route 28, branch established on 1965/02/15. Info updated 2010/10/04: Bank assets: $188,912.6 mil, Deposits: $153,149.8 mil, headquarters in Wilmington, DE, positive income, 1314 total offices, Holding Company: Toronto-Dominion Bank, The
The Cape Cod Five Cents Savings Bank: Yarmouth Branch at 514 Station Ave, branch established on 1987/10/17. Info updated 2006/11/03: Bank assets: $2,106.5 mil, Deposits: $1,831.3 mil, headquarters in Harwich Port, MA, positive income, Mortgage Lending Specialization, 17 total offices
Sovereign Bank, National Association: South Yarmouth Branch at 1029 Route 28, branch established on 1934/01/01. Info updated 2012/01/31: Bank assets: $78,146.9 mil, Deposits: $48,042.9 mil, headquarters in Wilmington, DE, positive income, Commercial Lending Specialization, 718 total offices, Holding Company: Banco Santander, S.A.
Bank of America, National Association: South Yarmouth Branch at 1326 Main Street, branch established on 1953/04/06. Info updated 2009/11/18: Bank assets: $1,451,969.3 mil, Deposits: $1,077,176.8 mil, headquarters in Charlotte, NC, positive income, 5782 total offices, Holding Company: Bank Of America Corporation
Rockland Trust Company: Station Ave Branch at 428 Station Avenue, branch established on 1925/01/01. Info updated 2009/05/20: Bank assets: $4,974.4 mil, Deposits: $3,903.9 mil, headquarters in Rockland, MA, positive income, Commercial Lending Specialization, 67 total offices, Holding Company: Independent Bank Corp.
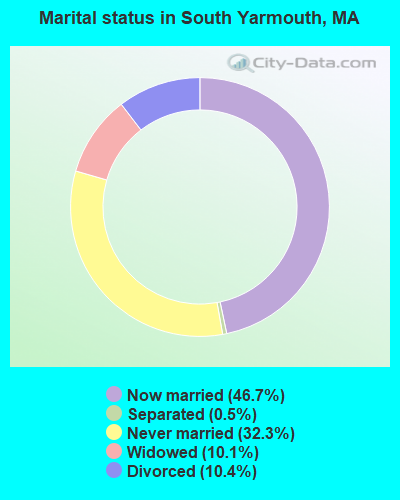
For population 15 years and over in South Yarmouth:
Never married: 32.3%
Now married: 46.7%
Separated: 0.5%
Widowed: 10.1%
Divorced: 10.4%
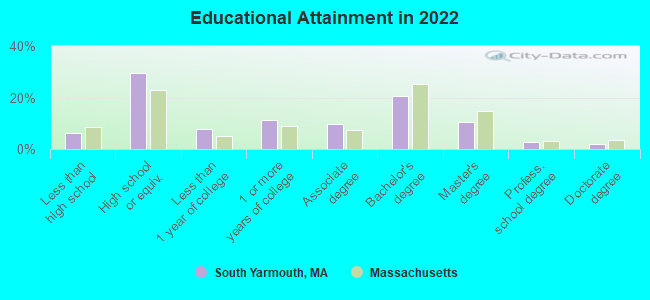
For population 25 years and over in South Yarmouth:
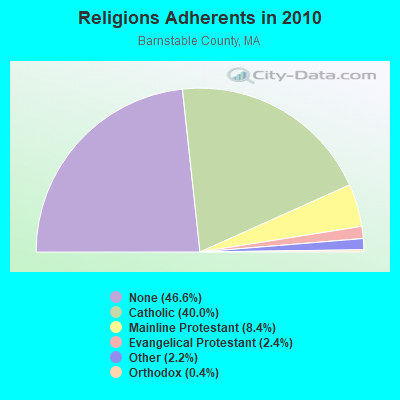
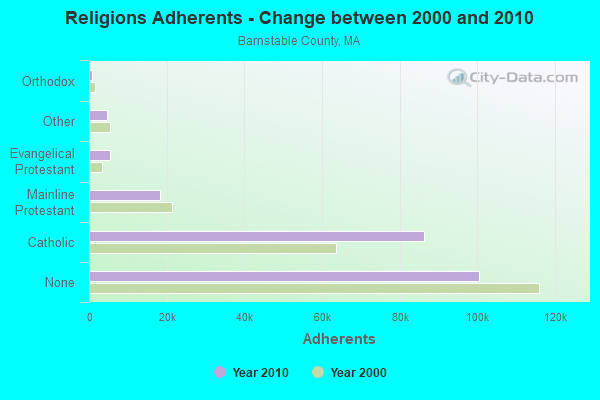
Religion statistics for South Yarmouth, MA (based on Barnstable County data)
Religion
Adherents
Congregations
Catholic
86,370
18
Mainline Protestant
18,165
68
Evangelical Protestant
5,281
46
Other
4,734
32
Orthodox
810
3
None
100,528
-
Source: Clifford Grammich, Kirk Hadaway, Richard Houseal, Dale E.Jones, Alexei Krindatch, Richie Stanley and Richard H.Taylor. 2012. 2010 U.S.Religion Census: Religious Congregations & Membership Study. Association of Statisticians of American Religious Bodies. Jones, Dale E., et al. 2002. Congregations and Membership in the United States 2000. Nashville, TN: Glenmary Research Center. Graphs represent county-level data
96 Old Main St (Lat: 41.658722 Lon: -70.198917), Type: Tower, Overall height: 12 m, Call Sign: KIZ722, Assigned Frequencies: 156.325 MHz, 156.425 MHz, 156.450 MHz, 156.500 MHz, 156.800 MHz, Grant Date: 01/10/1995, Expiration Date: 01/10/2000, Cancellation Date: 05/06/2001, Registrant: Yarmouth, Town Of, 96 Old Main St, South Yarmouth, MA 02664
Aircraft: BEECH 95-B55 (T42A) (Category: Land, Engines: 2, Seats: 6, Weight: Up to 12,499 Pounds, Speed: 165 mph), Engine: CONT MOTOR I0-470 SERIES (260 HP) (Reciprocating) N-Number: 111PD, N111PD, N-111PD, Serial Number: TC-2176, Year manufactured: 1978, Airworthiness Date: 09/22/1978, Certificate Issue Date: 03/20/1993 Registrant (Corporation): Davenport Realty Trust, 20 N Main St, South Yarmouth, MA 02664
Aircraft: PIPER PA-28-140 (Category: Land, Seats: 4, Weight: Up to 12,499 Pounds, Speed: 107 mph), Engine: LYCOMING 0-320 SERIES (180 HP) (Reciprocating) N-Number: 56771, N56771, N-56771, Serial Number: 28-7425032, Year manufactured: 1973, Airworthiness Date: 10/03/1973, Certificate Issue Date: 11/07/2006 Registrant (Co-Owned): Joseph M Toto, 18 Old Cedar Ln, South Yarmouth, MA 02664, Other Owners: Susan M Toto
Aircraft: CESSNA 150G (Category: Land, Seats: 2, Weight: Up to 12,499 Pounds, Speed: 90 mph), Engine: CONT MOTOR 0-200 SERIES (100 HP) (4 Cycle) N-Number: 3604J, N3604J, N-3604J, Serial Number: 15064904, Year manufactured: 1966, Airworthiness Date: 08/24/1966, Certificate Issue Date: 10/18/2005 Registrant (Individual): Steven A Richard, 108 Cranberry Ln, South Yarmouth, MA 02664 Deregistered:Cancel Date: 01/17/2019
Aircraft: VIGNEAU JOHN S RAF 2000-GTX (Category: Land, Seats: 2, Weight: Up to 12,499 Pounds), Engine: SUBARU ALL MDLS A/B (400 HP) (Reciprocating) N-Number: 9327B, N9327B, N-9327B, Serial Number: H2-03-14-593, Year manufactured: 2004, Airworthiness Date: 06/01/2004, Certificate Issue Date: 04/16/2004 Registrant (Individual): John S Vigneau, 205 High Bank Rd, South Yarmouth, MA 02664 Deregistered:Cancel Date: 03/24/2017
Home Mortgage Disclosure Act Aggregated Statistics For Year 2009 (Based on 2 partial tracts)
A) FHA, FSA/RHS & VA Home Purchase Loans
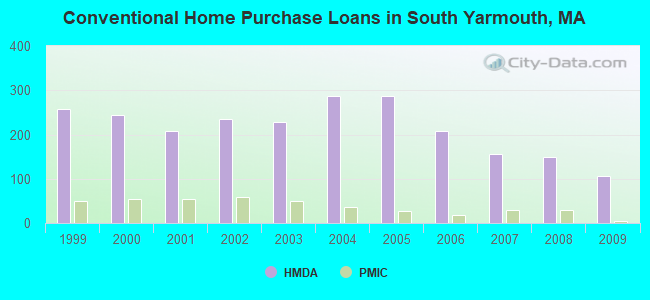
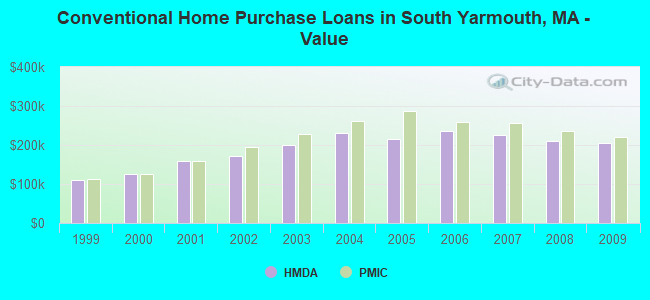
B) Conventional Home Purchase Loans
C) Refinancings
D) Home Improvement Loans
E) Loans on Dwellings For 5+ Families
F) Non-occupant Loans on < 5 Family Dwellings (A B C & D)
Number
Average Value
Number
Average Value
Number
Average Value
Number
Average Value
Number
Average Value
Number
Average Value
LOANS ORIGINATED
28
$222,169
107
$203,848
327
$210,304
16
$211,438
0
$0
173
$230,673
APPLICATIONS APPROVED, NOT ACCEPTED
4
$213,315
7
$200,379
26
$189,217
0
$0
0
$0
16
$196,143
APPLICATIONS DENIED
1
$324,840
13
$299,755
82
$268,891
8
$177,824
1
$163,040
27
$279,984
APPLICATIONS WITHDRAWN
4
$229,275
13
$215,455
51
$218,715
5
$141,252
0
$0
24
$233,355
FILES CLOSED FOR INCOMPLETENESS
0
$0
6
$235,865
13
$218,719
0
$0
0
$0
6
$214,885
Aggregated Statistics For Year 2008 (Based on 2 partial tracts)
A) FHA, FSA/RHS & VA Home Purchase Loans
B) Conventional Home Purchase Loans
C) Refinancings
D) Home Improvement Loans
E) Loans on Dwellings For 5+ Families
F) Non-occupant Loans on < 5 Family Dwellings (A B C & D)
G) Loans On Manufactured Home Dwelling (A B C & D)
Number
Average Value
Number
Average Value
Number
Average Value
Number
Average Value
Number
Average Value
Number
Average Value
Number
Average Value
LOANS ORIGINATED
15
$241,410
150
$209,885
159
$213,024
24
$120,922
1
$154,890
138
$230,143
1
$99,640
APPLICATIONS APPROVED, NOT ACCEPTED
0
$0
8
$210,185
21
$212,762
4
$96,970
0
$0
12
$201,212
0
$0
APPLICATIONS DENIED
3
$298,807
18
$201,587
78
$240,968
12
$81,464
0
$0
20
$215,721
0
$0
APPLICATIONS WITHDRAWN
2
$246,445
8
$225,774
36
$239,894
3
$205,977
0
$0
12
$220,729
0
$0
FILES CLOSED FOR INCOMPLETENESS
0
$0
4
$317,688
9
$190,949
1
$115,750
0
$0
1
$143,460
0
$0
Aggregated Statistics For Year 2007 (Based on 2 partial tracts)
A) FHA, FSA/RHS & VA Home Purchase Loans
B) Conventional Home Purchase Loans
C) Refinancings
D) Home Improvement Loans
E) Loans on Dwellings For 5+ Families
F) Non-occupant Loans on < 5 Family Dwellings (A B C & D)
Number
Average Value
Number
Average Value
Number
Average Value
Number
Average Value
Number
Average Value
Number
Average Value
LOANS ORIGINATED
2
$263,925
156
$226,909
219
$230,175
35
$98,059
1
$228,260
107
$261,335
APPLICATIONS APPROVED, NOT ACCEPTED
0
$0
22
$248,523
42
$240,223
5
$122,224
0
$0
18
$248,782
APPLICATIONS DENIED
1
$227,750
25
$209,744
121
$265,262
26
$80,278
0
$0
29
$226,424
APPLICATIONS WITHDRAWN
1
$240,940
12
$216,580
53
$232,165
3
$217,290
0
$0
12
$233,750
FILES CLOSED FOR INCOMPLETENESS
0
$0
3
$393,593
28
$239,193
1
$28,690
0
$0
3
$197,313
Aggregated Statistics For Year 2006 (Based on 2 partial tracts)
A) FHA, FSA/RHS & VA Home Purchase Loans
B) Conventional Home Purchase Loans
C) Refinancings
D) Home Improvement Loans
F) Non-occupant Loans on < 5 Family Dwellings (A B C & D)
G) Loans On Manufactured Home Dwelling (A B C & D)
Number
Average Value
Number
Average Value
Number
Average Value
Number
Average Value
Number
Average Value
Number
Average Value
LOANS ORIGINATED
1
$409,920
208
$236,478
314
$226,521
71
$132,081
148
$259,706
1
$69,260
APPLICATIONS APPROVED, NOT ACCEPTED
0
$0
20
$215,109
57
$237,256
3
$88,110
11
$211,606
1
$9,060
APPLICATIONS DENIED
0
$0
45
$185,609
125
$235,729
29
$109,348
26
$202,472
0
$0
APPLICATIONS WITHDRAWN
0
$0
15
$343,657
93
$219,641
2
$123,605
16
$322,999
0
$0
FILES CLOSED FOR INCOMPLETENESS
0
$0
5
$237,064
25
$213,434
1
$107,280
6
$214,245
0
$0
Aggregated Statistics For Year 2005 (Based on 2 partial tracts)
A) FHA, FSA/RHS & VA Home Purchase Loans
B) Conventional Home Purchase Loans
C) Refinancings
D) Home Improvement Loans
F) Non-occupant Loans on < 5 Family Dwellings (A B C & D)
G) Loans On Manufactured Home Dwelling (A B C & D)
Number
Average Value
Number
Average Value
Number
Average Value
Number
Average Value
Number
Average Value
Number
Average Value
LOANS ORIGINATED
1
$262,440
288
$216,005
358
$213,286
50
$135,838
159
$237,502
0
$0
APPLICATIONS APPROVED, NOT ACCEPTED
0
$0
24
$288,855
37
$184,892
6
$57,585
15
$278,901
0
$0
APPLICATIONS DENIED
0
$0
63
$226,233
106
$215,306
29
$77,735
29
$228,331
2
$13,135
APPLICATIONS WITHDRAWN
0
$0
34
$251,930
138
$212,520
14
$176,296
22
$220,736
0
$0
FILES CLOSED FOR INCOMPLETENESS
0
$0
4
$246,482
26
$214,091
1
$79,050
1
$431,550
0
$0
Aggregated Statistics For Year 2004 (Based on 2 partial tracts)
A) FHA, FSA/RHS & VA Home Purchase Loans
B) Conventional Home Purchase Loans
C) Refinancings
D) Home Improvement Loans
E) Loans on Dwellings For 5+ Families
F) Non-occupant Loans on < 5 Family Dwellings (A B C & D)
G) Loans On Manufactured Home Dwelling (A B C & D)
Number
Average Value
Number
Average Value
Number
Average Value
Number
Average Value
Number
Average Value
Number
Average Value
Number
Average Value
LOANS ORIGINATED
4
$252,898
286
$231,826
412
$191,319
48
$122,235
2
$2,935,240
198
$226,899
0
$0
APPLICATIONS APPROVED, NOT ACCEPTED
0
$0
16
$224,042
54
$183,082
9
$42,056
0
$0
15
$198,583
1
$62,500
APPLICATIONS DENIED
1
$290,500
26
$266,153
99
$193,262
26
$67,959
0
$0
24
$179,438
0
$0
APPLICATIONS WITHDRAWN
0
$0
40
$199,849
155
$204,303
5
$81,172
1
$5,434,800
17
$212,052
0
$0
FILES CLOSED FOR INCOMPLETENESS
0
$0
5
$272,824
27
$212,094
1
$289,790
0
$0
10
$222,215
0
$0
Aggregated Statistics For Year 2003 (Based on 2 partial tracts)
A) FHA, FSA/RHS & VA Home Purchase Loans
B) Conventional Home Purchase Loans
C) Refinancings
D) Home Improvement Loans
E) Loans on Dwellings For 5+ Families
F) Non-occupant Loans on < 5 Family Dwellings (A B C & D)
Number
Average Value
Number
Average Value
Number
Average Value
Number
Average Value
Number
Average Value
Number
Average Value
LOANS ORIGINATED
10
$230,542
229
$199,710
916
$157,743
26
$67,444
1
$931,160
304
$170,287
APPLICATIONS APPROVED, NOT ACCEPTED
0
$0
23
$192,853
91
$160,359
7
$55,026
0
$0
33
$188,387
APPLICATIONS DENIED
3
$248,630
33
$209,544
129
$180,971
25
$59,083
0
$0
27
$210,772
APPLICATIONS WITHDRAWN
0
$0
22
$220,793
135
$163,304
6
$61,645
0
$0
17
$195,695
FILES CLOSED FOR INCOMPLETENESS
0
$0
1
$335,520
18
$153,452
2
$109,920
0
$0
7
$139,120
Aggregated Statistics For Year 2002 (Based on 2 partial tracts)
A) FHA, FSA/RHS & VA Home Purchase Loans
B) Conventional Home Purchase Loans
C) Refinancings
D) Home Improvement Loans
E) Loans on Dwellings For 5+ Families
F) Non-occupant Loans on < 5 Family Dwellings (A B C & D)
Number
Average Value
Number
Average Value
Number
Average Value
Number
Average Value
Number
Average Value
Number
Average Value
LOANS ORIGINATED
10
$189,105
234
$172,290
667
$144,903
35
$63,219
0
$0
245
$159,345
APPLICATIONS APPROVED, NOT ACCEPTED
1
$167,570
26
$166,524
44
$139,925
8
$37,305
1
$797,100
18
$149,066
APPLICATIONS DENIED
2
$113,705
16
$150,456
87
$147,428
18
$28,777
0
$0
16
$147,331
APPLICATIONS WITHDRAWN
0
$0
10
$163,135
79
$138,910
10
$29,101
0
$0
15
$175,436
FILES CLOSED FOR INCOMPLETENESS
2
$127,265
2
$127,385
11
$148,858
0
$0
0
$0
1
$199,950
Aggregated Statistics For Year 2001 (Based on 2 partial tracts)
A) FHA, FSA/RHS & VA Home Purchase Loans
B) Conventional Home Purchase Loans
C) Refinancings
D) Home Improvement Loans
E) Loans on Dwellings For 5+ Families
F) Non-occupant Loans on < 5 Family Dwellings (A B C & D)
Number
Average Value
Number
Average Value
Number
Average Value
Number
Average Value
Number
Average Value
Number
Average Value
LOANS ORIGINATED
21
$156,634
208
$157,876
489
$126,763
31
$36,105
0
$0
159
$144,804
APPLICATIONS APPROVED, NOT ACCEPTED
1
$171,410
17
$144,464
33
$108,985
7
$30,789
0
$0
7
$183,891
APPLICATIONS DENIED
4
$158,725
23
$137,172
74
$101,565
18
$22,528
0
$0
15
$116,403
APPLICATIONS WITHDRAWN
2
$177,630
12
$199,527
86
$126,831
8
$33,709
1
$93,300
11
$166,800
FILES CLOSED FOR INCOMPLETENESS
0
$0
1
$323,950
6
$112,867
1
$17,220
0
$0
0
$0
Aggregated Statistics For Year 2000 (Based on 2 partial tracts)
A) FHA, FSA/RHS & VA Home Purchase Loans
B) Conventional Home Purchase Loans
C) Refinancings
D) Home Improvement Loans
F) Non-occupant Loans on < 5 Family Dwellings (A B C & D)
Number
Average Value
Number
Average Value
Number
Average Value
Number
Average Value
Number
Average Value
LOANS ORIGINATED
22
$117,555
245
$124,515
110
$110,695
33
$40,537
107
$127,074
APPLICATIONS APPROVED, NOT ACCEPTED
0
$0
19
$110,051
18
$91,504
8
$36,054
8
$103,346
APPLICATIONS DENIED
3
$122,887
41
$112,771
56
$92,287
14
$43,074
16
$107,042
APPLICATIONS WITHDRAWN
1
$61,760
12
$177,515
48
$91,502
3
$36,280
10
$193,554
FILES CLOSED FOR INCOMPLETENESS
0
$0
2
$125,875
5
$61,786
1
$14,700
0
$0
Aggregated Statistics For Year 1999 (Based on 2 partial tracts)
A) FHA, FSA/RHS & VA Home Purchase Loans
B) Conventional Home Purchase Loans
C) Refinancings
D) Home Improvement Loans
E) Loans on Dwellings For 5+ Families
F) Non-occupant Loans on < 5 Family Dwellings (A B C & D)
Detailed PMIC statistics for the following Tracts:0120.00
, 0121.00
2002 - 2018 National Fire Incident Reporting System (NFIRS) incidents
Based on the data from the years 2002 - 2018 the average number of fire incidents per year is 42. The highest number of fire incidents - 87 took place in 2004, and the least - 2 in 2010. The data has a growing trend.
When looking into fire subcategories, the most incidents belonged to: Structure Fires (41.8%), and Outside Fires (36.0%).
Fire incident types reported to NFIRS in South Yarmouth, MA


 Recent articles from our blog. Our writers, many of them Ph.D. graduates or candidates, create easy-to-read articles on a wide variety of topics.

 (37.9 miles


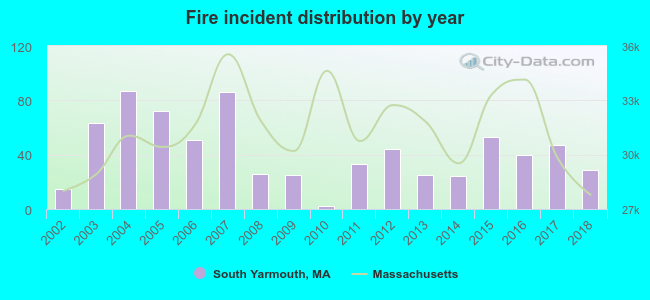 Based on the data from the years 2002 - 2018 the average number of fire incidents per year is 42. The highest number of fire incidents - 87 took place in 2004, and the least - 2 in 2010. The data has a growing trend.
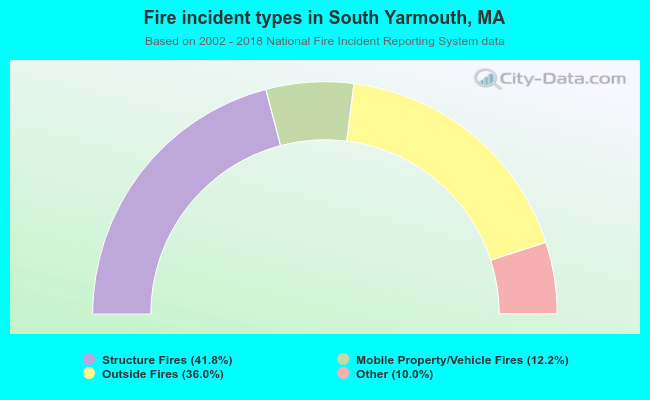 When looking into fire subcategories, the most incidents belonged to: Structure Fires (41.8%), and Outside Fires (36.0%).