Races in Huron, South Dakota (SD) Detailed Stats
Data:
Races - White alone (%)
Races - White alone (% change since 2000)
Races - Black alone (%)
Races - Black alone (% change since 2000)
Races - American Indian alone (%)
Races - American Indian alone (% change since 2000)
Races - Asian alone (%)
Races - Asian alone (% change since 2000)
Races - Hispanic (%)
Races - Hispanic (% change since 2000)
Races - Native Hawaiian and Other Pacific Islander alone (%)
Races - Native Hawaiian and Other Pacific Islander alone (% change since 2000)
Races - Two or more races(%)
Races - Two or more races(% change since 2000)
Races - Other race alone (%)
Races - Other race alone (% change since 2000)
Racial diversity
Place of birth - Born in state of residence (%)
Place of birth - Born in state of residence (%) - White
Place of birth - Born in state of residence (%) - Black or African American
Place of birth - Born in state of residence (%) - Asian
Place of birth - Born in state of residence (%) - Hispanic or Latino
Place of birth - Born in state of residence (%) - American Indian and Alaska Native
Place of birth - Born in state of residence (%) - Multirace
Place of birth - Born in state of residence (%) - Other Race
Place of birth - Born in other state (%)
Place of birth - Born in other state (%) - White
Place of birth - Born in other state (%) - Black or African American
Place of birth - Born in other state (%) - Asian
Place of birth - Born in other state (%) - Hispanic or Latino
Place of birth - Born in other state (%) - American Indian and Alaska Native
Place of birth - Born in other state (%) - Multirace
Place of birth - Born in other state (%) - Other Race
Place of birth - Native, outside of US (%)
Place of birth - Native, outside of US (%) - White
Place of birth - Native, outside of US (%) - Black or African American
Place of birth - Native, outside of US (%) - Asian
Place of birth - Native, outside of US (%) - Hispanic or Latino
Place of birth - Native, outside of US (%) - American Indian and Alaska Native
Place of birth - Native, outside of US (%) - Multirace
Place of birth - Native, outside of US (%) - Other Race
Place of birth - Foreign born (%)
Place of birth - Foreign born (%) - White
Place of birth - Foreign born (%) - Black or African American
Place of birth - Foreign born (%) - Asian
Place of birth - Foreign born (%) - Hispanic or Latino
Place of birth - Foreign born (%) - American Indian and Alaska Native
Place of birth - Foreign born (%) - Multirace
Place of birth - Foreign born (%) - Other Race
Residents speaking English at home (%)
Residents speaking English at home - Born in the United States (%)
Residents speaking English at home - Native, born elsewhere (%)
Residents speaking English at home - Foreign born (%)
Residents speaking Spanish at home (%)
Residents speaking Spanish at home - Born in the United States (%)
Residents speaking Spanish at home - Native, born elsewhere (%)
Residents speaking Spanish at home - Foreign born (%)
Residents speaking other language at home (%)
Residents speaking other language at home - Born in the United States (%)
Residents speaking other language at home - Native, born elsewhere (%)
Residents speaking other language at home - Foreign born (%)
Marital status - Never married (%)
Marital status - Now married (%)
Marital status - Separated (%)
Marital status - Widowed (%)
Marital status - Divorced (%)
Ancestries Reported - Arab (%)
Ancestries Reported - Czech (%)
Ancestries Reported - Danish (%)
Ancestries Reported - Dutch (%)
Ancestries Reported - English (%)
Ancestries Reported - French (%)
Ancestries Reported - French Canadian (%)
Ancestries Reported - German (%)
Ancestries Reported - Greek (%)
Ancestries Reported - Hungarian (%)
Ancestries Reported - Irish (%)
Ancestries Reported - Italian (%)
Ancestries Reported - Lithuanian (%)
Ancestries Reported - Norwegian (%)
Ancestries Reported - Polish (%)
Ancestries Reported - Portuguese (%)
Ancestries Reported - Russian (%)
Ancestries Reported - Scotch-Irish (%)
Ancestries Reported - Scottish (%)
Ancestries Reported - Slovak (%)
Ancestries Reported - Subsaharan African (%)
Ancestries Reported - Swedish (%)
Ancestries Reported - Swiss (%)
Ancestries Reported - Ukrainian (%)
Ancestries Reported - United States (%)
Ancestries Reported - Welsh (%)
Ancestries Reported - West Indian (%)
Ancestries Reported - Other (%)
Geographical mobility - Same house 1 year ago (%)
Geographical mobility - Same house 1 year ago (%) - White
Geographical mobility - Same house 1 year ago (%) - Black or African American
Geographical mobility - Same house 1 year ago (%) - Asian
Geographical mobility - Same house 1 year ago (%) - Hispanic or Latino
Geographical mobility - Same house 1 year ago (%) - American Indian and Alaska Native
Geographical mobility - Same house 1 year ago (%) - Multirace
Geographical mobility - Same house 1 year ago (%) - Other Race
Geographical mobility - Moved within same county (%)
Geographical mobility - Moved within same county (%) - White
Geographical mobility - Moved within same county (%) - Black or African American
Geographical mobility - Moved within same county (%) - Asian
Geographical mobility - Moved within same county (%) - Hispanic or Latino
Geographical mobility - Moved within same county (%) - American Indian and Alaska Native
Geographical mobility - Moved within same county (%) - Multirace
Geographical mobility - Moved within same county (%) - Other Race
Geographical mobility - Moved from different county within same state (%)
Geographical mobility - Moved from different county within same state (%) - White
Geographical mobility - Moved from different county within same state (%) - Black or African American
Geographical mobility - Moved from different county within same state (%) - Asian
Geographical mobility - Moved from different county within same state (%) - Hispanic or Latino
Geographical mobility - Moved from different county within same state (%) - American Indian and Alaska Native
Geographical mobility - Moved from different county within same state (%) - Multirace
Geographical mobility - Moved from different county within same state (%) - Other Race
Geographical mobility - Moved from different state (%)
Geographical mobility - Moved from different state (%) - White
Geographical mobility - Moved from different state (%) - Black or African American
Geographical mobility - Moved from different state (%) - Asian
Geographical mobility - Moved from different state (%) - Hispanic or Latino
Geographical mobility - Moved from different state (%) - American Indian and Alaska Native
Geographical mobility - Moved from different state (%) - Multirace
Geographical mobility - Moved from different state (%) - Other Race
Geographical mobility - Moved from abroad (%)
Geographical mobility - Moved from abroad (%) - White
Geographical mobility - Moved from abroad (%) - Black or African American
Geographical mobility - Moved from abroad (%) - Asian
Geographical mobility - Moved from abroad (%) - Hispanic or Latino
Geographical mobility - Moved from abroad (%) - American Indian and Alaska Native
Geographical mobility - Moved from abroad (%) - Multirace
Geographical mobility - Moved from abroad (%) - Other Race
Place of birth for the foreign-born population - Ireland (%)
Place of birth for the foreign-born population - Denmark (%)
Place of birth for the foreign-born population - Norway (%)
Place of birth for the foreign-born population - Sweden (%)
Place of birth for the foreign-born population - United Kingdom (%)
Place of birth for the foreign-born population - England (%)
Place of birth for the foreign-born population - Scotland (%)
Place of birth for the foreign-born population - Other Northern Europe (%)
Place of birth for the foreign-born population - Austria (%)
Place of birth for the foreign-born population - Belgium (%)
Place of birth for the foreign-born population - France (%)
Place of birth for the foreign-born population - Germany (%)
Place of birth for the foreign-born population - Netherlands (%)
Place of birth for the foreign-born population - Switzerland (%)
Place of birth for the foreign-born population - Other Western Europe (%)
Place of birth for the foreign-born population - Greece (%)
Place of birth for the foreign-born population - Italy (%)
Place of birth for the foreign-born population - Portugal (%)
Place of birth for the foreign-born population - Spain (%)
Place of birth for the foreign-born population - Other Southern Europe (%)
Place of birth for the foreign-born population - Albania (%)
Place of birth for the foreign-born population - Belarus (%)
Place of birth for the foreign-born population - Bosnia and Herzegovina (%)
Place of birth for the foreign-born population - Bulgaria (%)
Place of birth for the foreign-born population - Croatia (%)
Place of birth for the foreign-born population - Czechoslovakia (%)
Place of birth for the foreign-born population - Hungary (%)
Place of birth for the foreign-born population - Latvia (%)
Place of birth for the foreign-born population - Lithuania (%)
Place of birth for the foreign-born population - North Macedonia (Macedonia) (%)
Place of birth for the foreign-born population - Moldova (%)
Place of birth for the foreign-born population - Poland (%)
Place of birth for the foreign-born population - Romania (%)
Place of birth for the foreign-born population - Russia (%)
Place of birth for the foreign-born population - Serbia (%)
Place of birth for the foreign-born population - Ukraine (%)
Place of birth for the foreign-born population - Other Eastern Europe (%)
Place of birth for the foreign-born population - China (%)
Place of birth for the foreign-born population - Hong Kong (%)
Place of birth for the foreign-born population - Taiwan (%)
Place of birth for the foreign-born population - Japan (%)
Place of birth for the foreign-born population - Korea (%)
Place of birth for the foreign-born population - Other Eastern Asia (%)
Place of birth for the foreign-born population - Afghanistan (%)
Place of birth for the foreign-born population - Bangladesh (%)
Place of birth for the foreign-born population - India (%)
Place of birth for the foreign-born population - Iran (%)
Place of birth for the foreign-born population - Kazakhstan (%)
Place of birth for the foreign-born population - Nepal (%)
Place of birth for the foreign-born population - Pakistan (%)
Place of birth for the foreign-born population - Sri Lanka (%)
Place of birth for the foreign-born population - Uzbekistan (%)
Place of birth for the foreign-born population - Other South Central Asia (%)
Place of birth for the foreign-born population - Burma (%)
Place of birth for the foreign-born population - Cambodia (%)
Place of birth for the foreign-born population - Indonesia (%)
Place of birth for the foreign-born population - Laos (%)
Place of birth for the foreign-born population - Malaysia (%)
Place of birth for the foreign-born population - Philippines (%)
Place of birth for the foreign-born population - Singapore (%)
Place of birth for the foreign-born population - Thailand (%)
Place of birth for the foreign-born population - Vietnam (%)
Place of birth for the foreign-born population - Other South Eastern Asia (%)
Place of birth for the foreign-born population - Armenia (%)
Place of birth for the foreign-born population - Iraq (%)
Place of birth for the foreign-born population - Israel (%)
Place of birth for the foreign-born population - Jordan (%)
Place of birth for the foreign-born population - Kuwait (%)
Place of birth for the foreign-born population - Lebanon (%)
Place of birth for the foreign-born population - Saudi Arabia (%)
Place of birth for the foreign-born population - Syria (%)
Place of birth for the foreign-born population - Turkey (%)
Place of birth for the foreign-born population - Yemen (%)
Place of birth for the foreign-born population - Other Western Asia (%)
Place of birth for the foreign-born population - Eritrea (%)
Place of birth for the foreign-born population - Ethiopia (%)
Place of birth for the foreign-born population - Kenya (%)
Place of birth for the foreign-born population - Somalia (%)
Place of birth for the foreign-born population - Uganda (%)
Place of birth for the foreign-born population - Zimbabwe (%)
Place of birth for the foreign-born population - Other Eastern Africa (%)
Place of birth for the foreign-born population - Cameroon (%)
Place of birth for the foreign-born population - Congo (%)
Place of birth for the foreign-born population - Democratic Republic of Congo (Zaire) (%)
Place of birth for the foreign-born population - Other Middle Africa (%)
Place of birth for the foreign-born population - Egypt (%)
Place of birth for the foreign-born population - Morocco (%)
Place of birth for the foreign-born population - Sudan (%)
Place of birth for the foreign-born population - Other Northern Africa (%)
Place of birth for the foreign-born population - South Africa (%)
Place of birth for the foreign-born population - Other Southern Africa (%)
Place of birth for the foreign-born population - Cabo Verde (%)
Place of birth for the foreign-born population - Ghana (%)
Place of birth for the foreign-born population - Liberia (%)
Place of birth for the foreign-born population - Nigeria (%)
Place of birth for the foreign-born population - Senegal (%)
Place of birth for the foreign-born population - Sierra Leone (%)
Place of birth for the foreign-born population - Other Western Africa (%)
Place of birth for the foreign-born population - Australia (%)
Place of birth for the foreign-born population - New Zealand (%)
Place of birth for the foreign-born population - Fiji (%)
Place of birth for the foreign-born population - Micronesia (%)
Place of birth for the foreign-born population - Bahamas (%)
Place of birth for the foreign-born population - Barbados (%)
Place of birth for the foreign-born population - Cuba (%)
Place of birth for the foreign-born population - Dominica (%)
Place of birth for the foreign-born population - Dominican Republic (%)
Place of birth for the foreign-born population - Grenada (%)
Place of birth for the foreign-born population - Haiti (%)
Place of birth for the foreign-born population - Jamaica (%)
Place of birth for the foreign-born population - St. Vincent and the Grenadines (%)
Place of birth for the foreign-born population - Trinidad and Tobago (%)
Place of birth for the foreign-born population - West Indies (%)
Place of birth for the foreign-born population - Other Caribbean (%)
Place of birth for the foreign-born population - Belize (%)
Place of birth for the foreign-born population - Costa Rica (%)
Place of birth for the foreign-born population - El Salvador (%)
Place of birth for the foreign-born population - Guatemala (%)
Place of birth for the foreign-born population - Honduras (%)
Place of birth for the foreign-born population - Mexico (%)
Place of birth for the foreign-born population - Nicaragua (%)
Place of birth for the foreign-born population - Panama (%)
Place of birth for the foreign-born population - Other Central America (%)
Place of birth for the foreign-born population - Argentina (%)
Place of birth for the foreign-born population - Bolivia (%)
Place of birth for the foreign-born population - Brazil (%)
Place of birth for the foreign-born population - Chile (%)
Place of birth for the foreign-born population - Colombia (%)
Place of birth for the foreign-born population - Ecuador (%)
Place of birth for the foreign-born population - Guyana (%)
Place of birth for the foreign-born population - Peru (%)
Place of birth for the foreign-born population - Uruguay (%)
Place of birth for the foreign-born population - Venezuela (%)
Place of birth for the foreign-born population - Other South America (%)
Place of birth for the foreign-born population - Canada (%)
Place of birth for the foreign-born population - Other Northern America (%)
Place of birth for the foreign-born population - Other (%)
Latest news about races in Huron, SD collected exclusively by city-data.com from local newspapers, TV, and radio stations
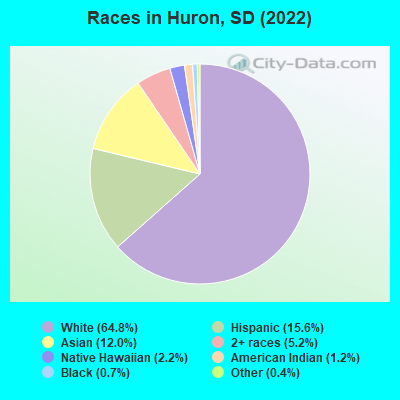
According to 2022 data, the most numerous races in Huron, SD are White alone (9,389 residents), American Indian alone (173 residents), and Hispanic (2,261 residents). 79.7% of Huron residents speak English at home. 15.8% of Huron, SD residents are foreign-born (8.2% born in Asia, 6.0% born in Latin America), which is 81.0% greater than the foreign-born rate of 3.0% across the entire state of South Dakota.
Race distribution in Huron
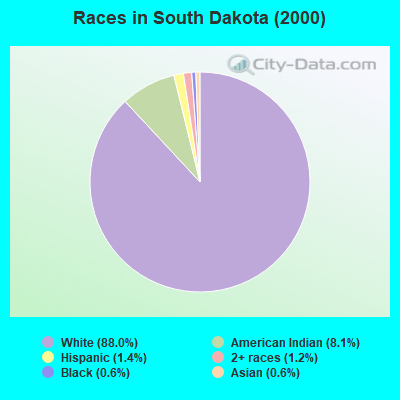
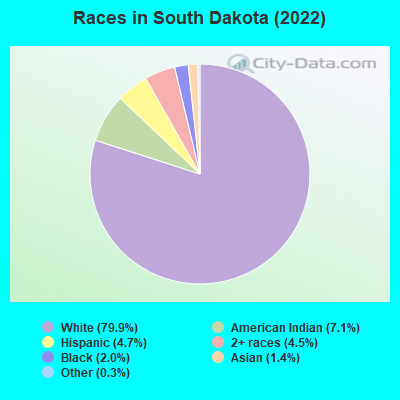
2000 2022
664,585 88.0% White alone 60,988 8.1% American Indian alone 10,903 1.4% Hispanic 8,960 1.2% Two or more races 4,563 0.6% Black alone 4,316 0.6% Asian alone 310 0.04% Other race alone 219 0.03% Native Hawaiian and Other
726,885 79.9% White alone 64,666 7.1% American Indian alone 42,430 4.7% Hispanic 40,984 4.5% Two or more races 18,053 2.0% Black alone 12,874 1.4% Asian alone 3,136 0.3% Other race alone 796 0.09% Native Hawaiian and Other
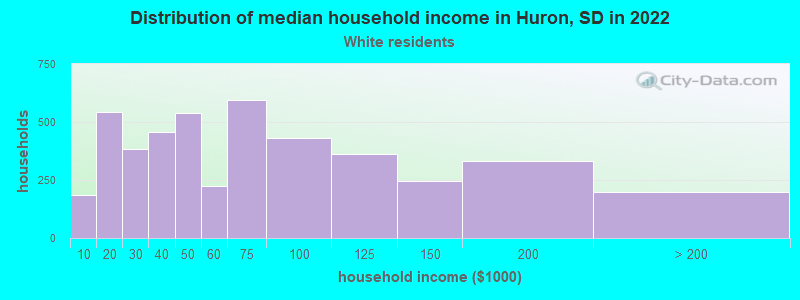
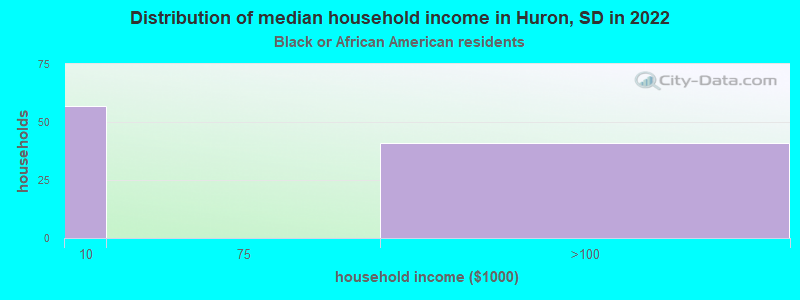
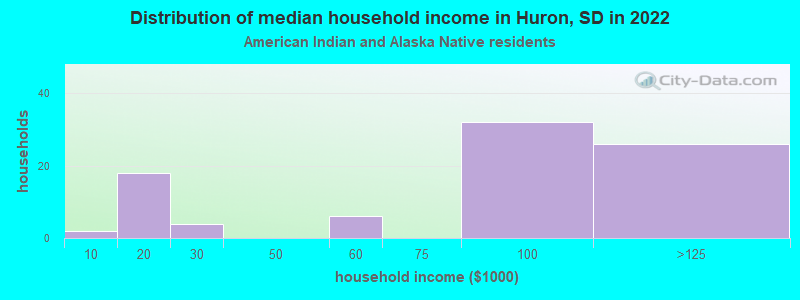
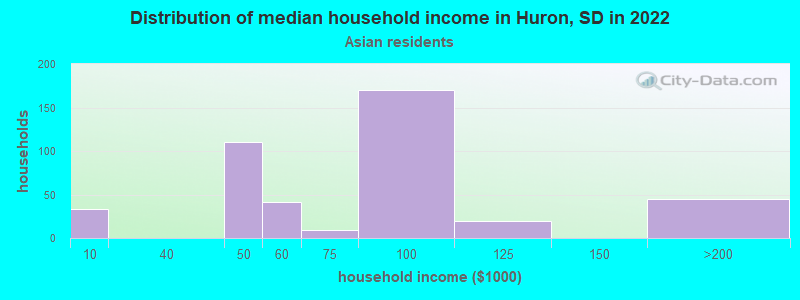
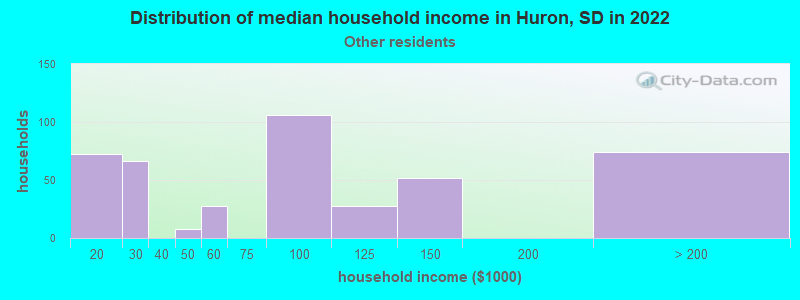
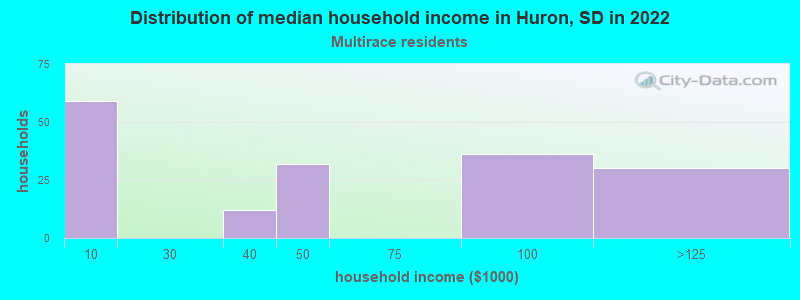
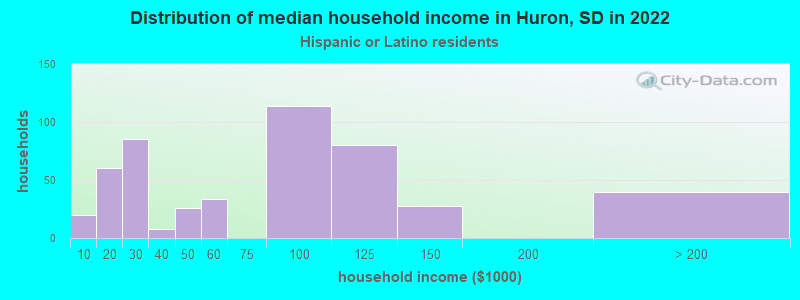
Income and house value in Huron Median household income in 2022 $57,802 White non-Hispanic householders$2,900 Black householders$75,108 American Indian and Alaska Native householders$63,599 Asian householders$87,374 Some other race householders$73,337 Hispanic or Latino race householdersMedian 2022 house value $153,854 White Non-Hispanic householders$123,872 Black or African American householders$98,624 American Indian or Alaska Native householders$134,918 Two or more races householders$72,324 Hispanic or Latino householders
Median age by race in Huron
46.3 Median age for White residents43.4 49.1 39.7 Median age for Black or African American residents-839,160,838.3 21.5 36.1 Median age for American Indian / Alaska Native residents32.3 35.7 29.0 Median age for Asian residents30.1 32.0 69.0 Median age for Native Hawaiian / Pacific Islander residents-1,038,202,246.2 -670,599,802.7 22.7 Median age for Other race residents21.3 31.3 10.1 Median age for Two or more races residents13.7 8.0 46.6 Median age for White alone residents45.0 48.9 18.9 Median age for Hispanic or Latino residents24.2 11.9
Owner/renter occupied households by race in Huron
House owners and renters - White residents 3,204 71.3% Owner occupied1,291 28.7% Renter occupiedHouse owners and renters - Black or African American residents 26 32.1% Owner occupied56 67.9% Renter occupiedHouse owners and renters - American Indian / Alaska Native residents 28 39.3% Owner occupied44 60.7% Renter occupiedHouse owners and renters - Asian residents 162 37.4% Owner occupied272 62.6% Renter occupiedHouse owners and renters - Native Hawaiian / Pacific Islander residents 72 100.0% Renter occupiedHouse owners and renters - Other race residents 363 58.5% Owner occupied258 41.5% Renter occupiedHouse owners and renters - Two or more races residents 93 55.9% Owner occupied73 44.1% Renter occupiedHouse owners and renters - White alone residents 3,212 71.7% Owner occupied1,265 28.3% Renter occupiedHouse owners and renters - Hispanic or Latino residents 288 58.1% Owner occupied208 41.9% Renter occupied
Language usage in Huron
English speakers - Total 79.7% of residents of Huron speak English at home.
9.1% of residents speak Spanish at home 649 54.4% Speak English very well545 45.6% Speak English less than very well12.0% of residents speak other language at home 268 17.0% Speak English very well1,305 83.0% Speak English less than very well
English speakers - Born in the United States 86.4% of residents of Huron speak English at home.
9.4% of residents speak Spanish at home 363 94.5% Speak English very well21 5.5% Speak English less than very well4.2% of residents speak other language at home 83 48.3% Speak English very well89 51.7% Speak English less than very well
English speakers - Native, born elsewhere 19.5% of residents of Huron speak English at home.
85.4% of residents speak Spanish at home 35 100.0% Speak English less than very well
English speakers - Foreign-born 21.2% of residents of Huron speak English at home.
39.2% of residents speak Spanish at home 249 32.2% Speak English very well525 67.8% Speak English less than very well50.1% of residents speak other language at home 84 8.5% Speak English very well906 91.5% Speak English less than very well
White (Caucasian) - Speak only English Native:
96.5% (8,647)Foreign-born:
50.4% (11)
White (Caucasian) - Speak another language Native:
3.8% (344)Foreign-born:
51.2% (12)
American Indian / Alaska Native - Speak another language Native:
17.7% (41)Foreign-born:
100.0% (9)
Asian - Speak only English Native:
9.7% (49)Foreign-born:
18.8% (197)
Asian - Speak another language Native:
100.0% (509)Foreign-born:
73.0% (767)
Other race - Speak only English Native:
50.8% (341)Foreign-born:
7.4% (99)
Other race - Speak another language Native:
49.4% (332)Foreign-born:
92.1% (1,240)
White alone - Speak only English Native:
97.4% (8,575)Foreign-born:
42.7% (12)
White alone - Speak another language Native:
2.7% (241)Foreign-born:
57.0% (16)
Hispanic or Latino - Speak only English Native:
63.5% (628)Foreign-born:
6.5% (55)
Hispanic or Latino - Speak another language Native:
37.1% (366)Foreign-born:
95.0% (795)
Foreign-born residents in Huron 2,284 residents are foreign born (8.2% Asia , 6.0% Latin America ).
This city:
15.8%South Dakota:
3.8%
Marital status for residents in Huron Marital status - White (Caucasian) population 15 years and over
Males 27.3% Never married55.7% Now married3.4% Separated4.1% Widowed9.5% DivorcedFemales 22.3% Never married49.8% Now married0.0% Separated17.0% Widowed10.9% DivorcedWomen who gave birth in the past 12 months Now married:
66.7% (152)Unmarried:
33.3% (76)
Women who did not give birth in the past 12 months Now married:
42.6% (669)Unmarried:
57.4% (902)
Marital status - Black or African American population 15 years and over
Males 100.0% Never married0.0% Now married0.0% Separated0.0% Widowed0.0% DivorcedFemales 100.0% Never married0.0% Now married0.0% Separated0.0% Widowed0.0% DivorcedWomen who did not give birth in the past 12 months Now married:
0.0% (0)Unmarried:
100.0% (74)
Marital status - American Indian / Alaska Native population 15 years and over
Males 69.8% Never married22.2% Now married0.0% Separated0.0% Widowed7.9% DivorcedFemales 56.8% Never married31.6% Now married0.0% Separated0.0% Widowed11.6% DivorcedWomen who did not give birth in the past 12 months Now married:
12.3% (7)Unmarried:
87.7% (49)
Marital status - Asian population 15 years and over
Males 12.9% Never married80.4% Now married0.0% Separated0.0% Widowed6.7% DivorcedFemales 12.5% Never married83.3% Now married0.0% Separated0.0% Widowed4.2% DivorcedWomen who gave birth in the past 12 months Now married:
0.0% (0)Unmarried:
100.0% (22)
Women who did not give birth in the past 12 months Now married:
80.4% (274)Unmarried:
19.6% (67)
Marital status - Native Hawaiian / Pacific Islander population 15 years and over
Males 100.0% Never married0.0% Now married0.0% Separated0.0% Widowed0.0% DivorcedFemales 100.0% Never married0.0% Now married0.0% Separated0.0% Widowed0.0% DivorcedWomen who did not give birth in the past 12 months Now married:
0.0% (0)Unmarried:
100.0% (72)
Marital status - Other race population 15 years and over
Males 25.1% Never married71.7% Now married0.0% Separated3.3% Widowed0.0% DivorcedFemales 28.0% Never married52.7% Now married0.0% Separated0.0% Widowed19.3% DivorcedWomen who gave birth in the past 12 months Now married:
66.7% (68)Unmarried:
33.3% (34)
Women who did not give birth in the past 12 months Now married:
55.9% (234)Unmarried:
44.1% (184)
Marital status - Two or more races population 15 years and over
Males 58.2% Never married36.0% Now married0.0% Separated0.0% Widowed5.8% DivorcedFemales 50.0% Never married30.9% Now married0.0% Separated0.0% Widowed19.1% DivorcedWomen who gave birth in the past 12 months Now married:
88.9% (9)Unmarried:
11.1% (1)
Women who did not give birth in the past 12 months Now married:
31.3% (24)Unmarried:
68.7% (53)
Marital status - White alone, not Hispanic / Latino population 15 years and over
Males 26.7% Never married56.6% Now married3.5% Separated4.1% Widowed9.1% DivorcedFemales 22.4% Never married49.4% Now married0.0% Separated17.1% Widowed11.1% DivorcedWomen who gave birth in the past 12 months Now married:
67.9% (153)Unmarried:
32.1% (72)
Women who did not give birth in the past 12 months Now married:
42.6% (674)Unmarried:
57.4% (908)
Marital status - Hispanic or Latino population 15 years and over
Males 36.4% Never married57.7% Now married0.0% Separated2.3% Widowed3.7% DivorcedFemales 27.3% Never married55.6% Now married0.0% Separated0.0% Widowed17.2% DivorcedWomen who gave birth in the past 12 months Now married:
63.4% (54)Unmarried:
36.6% (31)
Women who did not give birth in the past 12 months Now married:
55.2% (193)Unmarried:
44.8% (157)
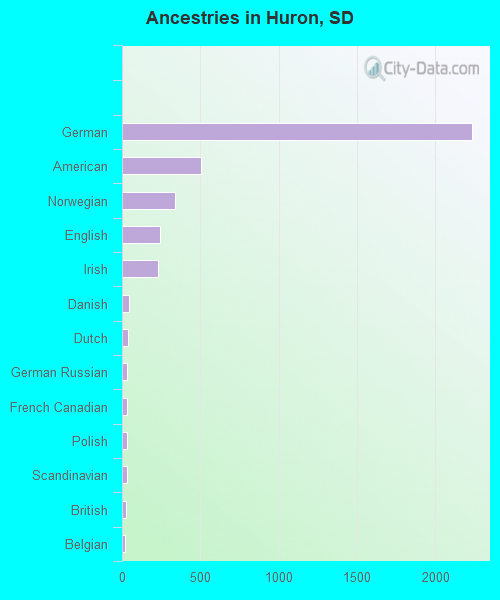
Ancestries in Huron
2,233 31.1% German507 7.1% American339 4.7% Norwegian245 3.4% English230 3.2% Irish47 0.7% Danish40 0.6% Dutch35 0.5% German Russian32 0.4% French Canadian30 0.4% Polish29 0.4% Scandinavian27 0.4% British21 0.3% Belgian20 0.3% French20 0.3% Swedish17 0.2% European16 0.2% Scottish13 0.2% Iranian13 0.2% Portuguese11 0.2% Finnish7 0.10% Russian2 0.03% Eastern European
Children Nativity (place of birth) in Huron
Children under 6 years - Living with two parents Both parents native 679 100.0% NativeBoth parents foreign-born 187 72.2% Native72 27.8% Foreign-bornOne native, one foreign-born parent 114 100.0% NativeChildren under 6 years - Living with one parent Native parent 243 100.0% NativeForeign-born parent 148 62.2% Native90 37.8% Foreign-bornChildren 6 to 17 years - Living with two parents Both parents native 1,025 100.0% NativeBoth parents foreign-born 293 50.9% Native283 49.1% Foreign-bornOne native, one foreign-born parent 100 100.0% NativeChildren 6 to 17 years - Living with one parent Native parent 587 91.5% Native54 8.5% Foreign-bornForeign-born parent 106 64.8% Native57 35.2% Foreign-born
Grandparents responsible for own grandchildren in Huron
Grandparents (30 to 59 years) White / Caucasian 23 100.0% Responsible for grandchildrenAmerican Indian / Alaska Native 3 100.0% Responsible for grandchildrenWhite alone, not Hispanic / Latino 23 100.0% Responsible for grandchildren
Grandparents (60 years and over) White / Caucasian 110 100.0% Not responsible for grandchildrenWhite alone, not Hispanic / Latino 111 100.0% Not responsible for grandchildren